[inline_ad_block]
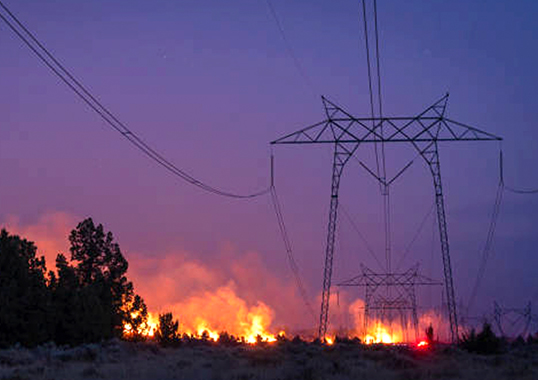
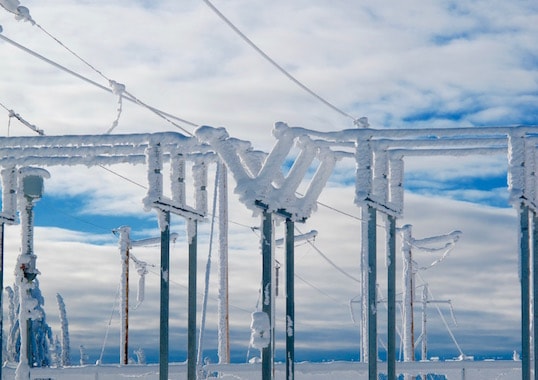
Flashover problems encountered across the globe confirm that ice and snow can significantly diminish insulator performance and impact grid reliability. Much research has therefore been published on this topic and an excellent review was made by Masoud Farzeneh and William Chisholm in their book “Insulators for Icing and Polluted Environments”. Proper design of insulators for these types of service environments is critical and the deterministic approach that forms the basis for most design may well be too conservative and lead to unnecessarily long insulators. According to this approach, for example, average stress of 40 to 50 kV/m for large diameter DC insulators with ice accretion of more than 30 mm and water conductivity of 100 μS/cm could mean the need for over 16 m long station insulators in the case of 800 kV systems.
The deterministic approach is reflected in IEEE 1783-2009 – the only available test standard. Among other things, it basically recommends testing with water conductivity of 100 μS/cm. But this value may be too high and not representative of relatively clean mountainous regions. This confirms the need for a more precise approach to design, especially when looking to DC and UHV applications.
The problem can perhaps best be looked at from a statistical viewpoint using an approach similar to that applied for contaminated conditions. Firstly, different environmental parameters need to be carefully defined since these can affect insulator performance. When characterizing ice and snow, the most important of these are: width (S), mass density (ρ) and equivalent water conductivity (σ in μS/cm, which also takes into account any presence of contamination). Each is characterized by a statistical distribution. It is also important to estimate how many critical events occur during a typical year (i.e. number of days with presence of ice and snow under conditions favoring flashover). Then, probabilistic insulator withstand characteristics have to be determined, usually expressed in terms of ISP (ice stress product) and SSP (snow stress product), that also take into account factors such as type of voltage stress (AC, DC+, DC-), insulator diameter, altitude, insulator inclination and number of insulators in parallel subject to this environment. Finally, acceptable number of flashovers per year has to be defined based on criticality of these various service phenomena as well as the relative importance of the system under study.
It is immediately clear that much data is needed. Often, such information is limited and provisional reasonable assumptions have to be made when trying to apply the statistical approach. This also suggests the need for more research within the international community. In particular, more work may be needed to define ice and snow mapping (as done for pollution) and to determine insulator strength as a function of insulator inclination, for both ice and snow. Application of the statistical approach could help users better understand the importance of different parameters and, once calibrated, could also serve as an efficient tool when designing new lines. Indeed, once the approach has been calibrated on the basis of field experience with AC systems in a certain region, extrapolating the information could be used to design AC systems with higher voltage or even DC systems in the same service area.
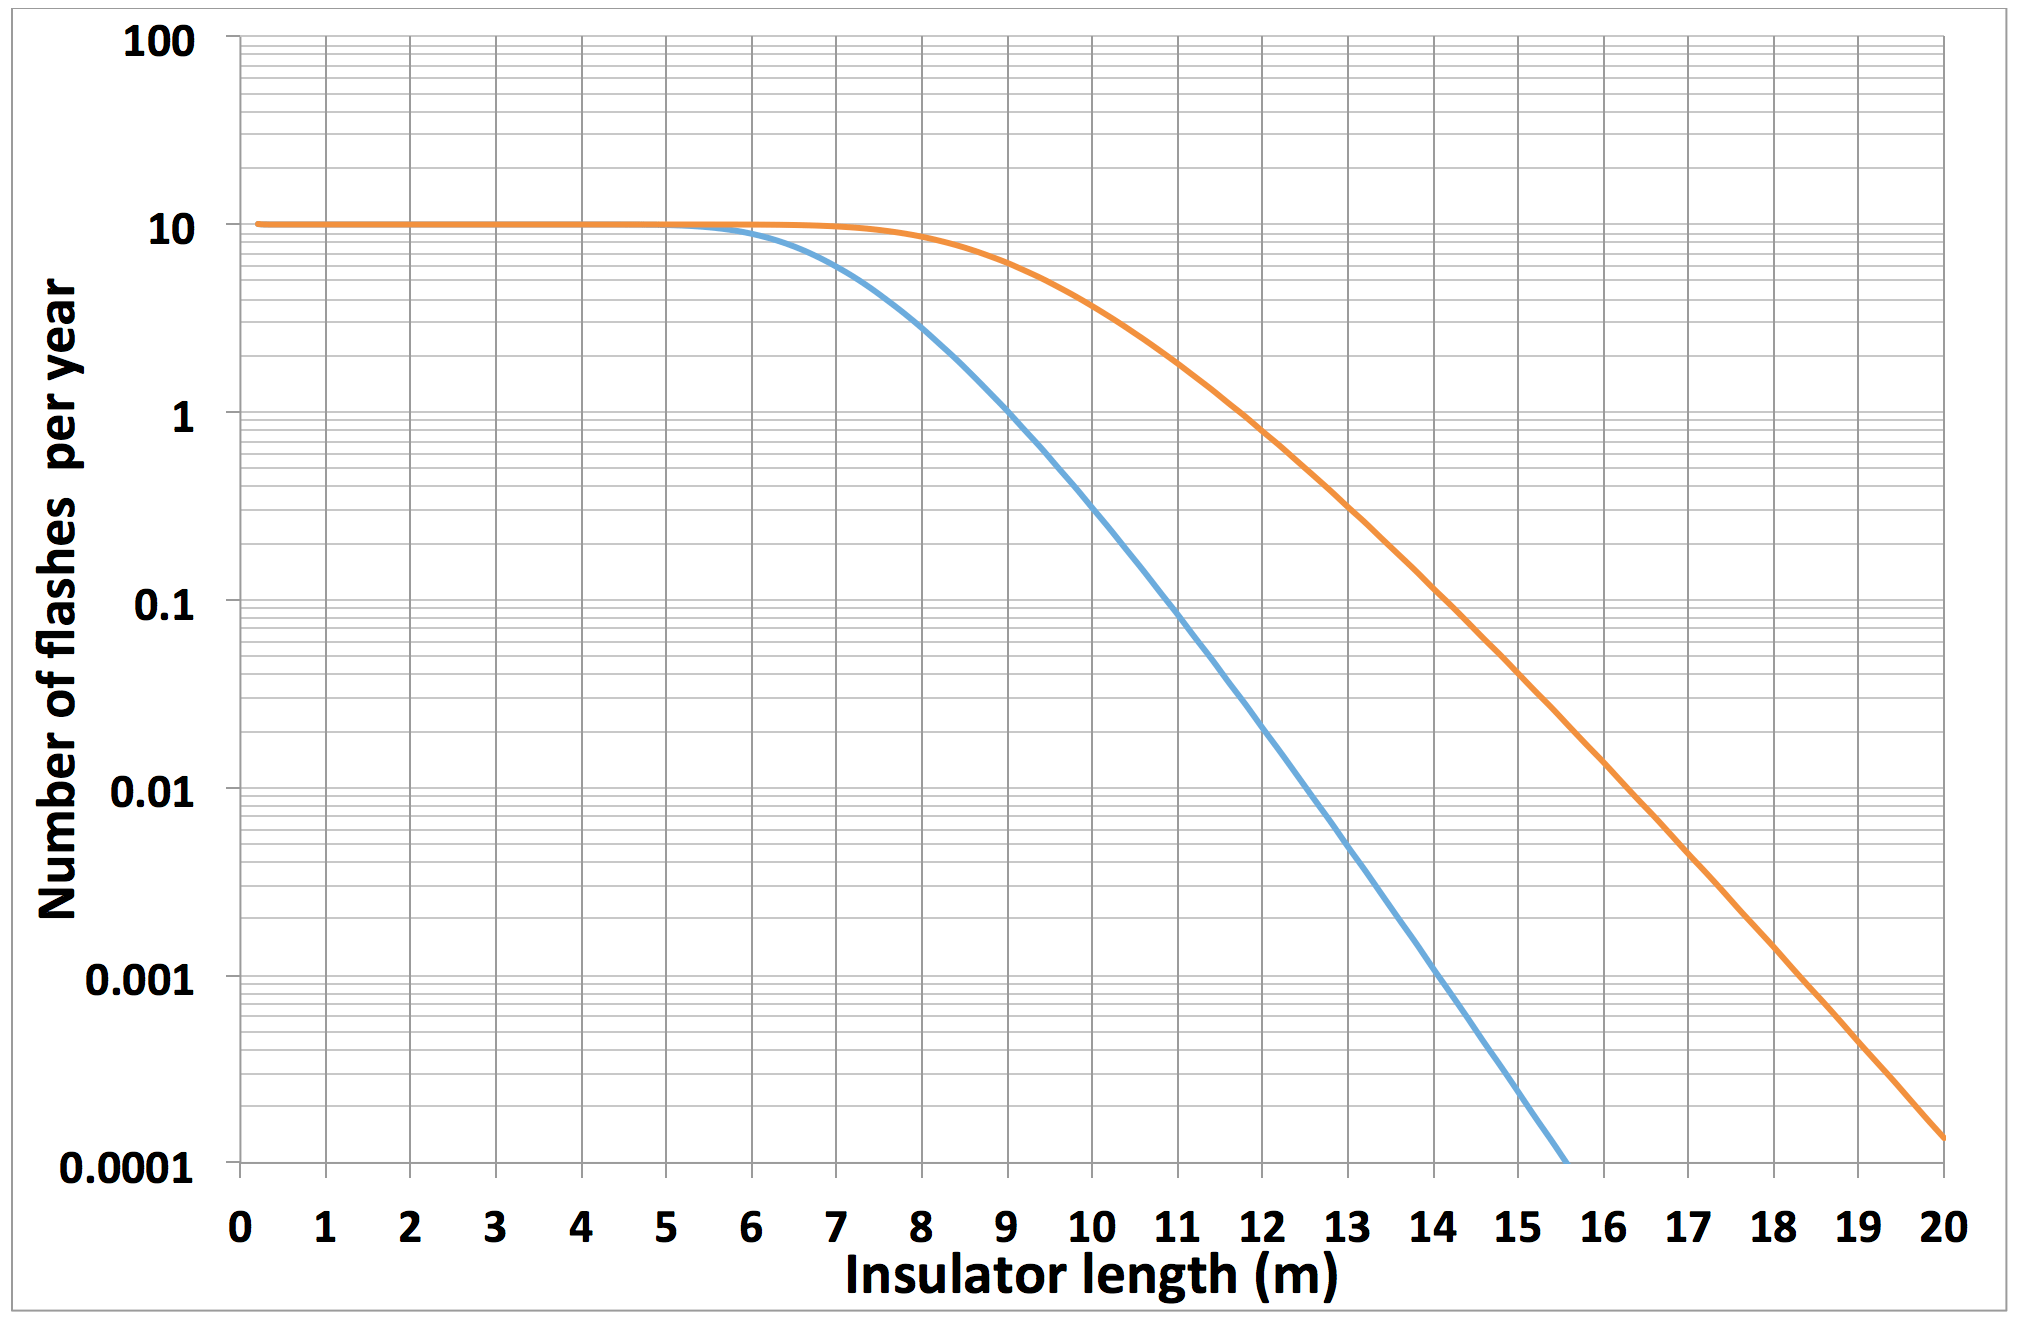
An example of applying the statistical approach is shown in this chart that refers to an 800 kV DC line. The figure indicates required line insulator length, assuming an ‘I’ string, as a function of acceptable number of flashovers for cases of equivalent water conductivity of 25 and 100 μS/ cm. The relevance of conductivity as a parameter is clear. Accepting 1 flashover every 10 years, a string length of 11 m would be sufficient in the case of 25 μS/cm but more than 14 m would be necessary for 100 μS/cm.
In conclusion, correct design requires an adequate estimate of environmental parameters as well as a statistical approach. For many sites, e.g. mountainous areas, maximum conductivity of 25 μS/cm could be representative. This parameter selection should also be the basis for research to develop and validate rapid test procedures, similar to those proposed and adopted for pollution tests. It may be time for IEC to prepare a comprehensive new guideline, starting with the IEEE approach but then working to improve it.
Alberto Pigini