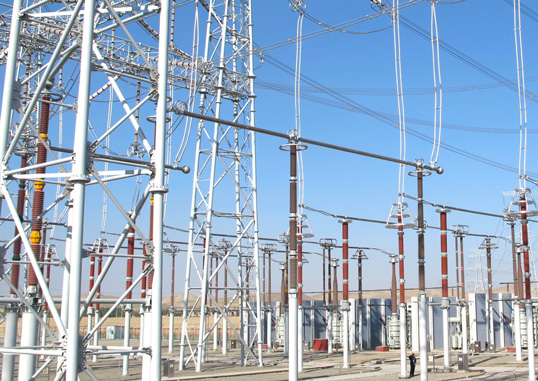
Electrical infrastructure is especially at risk from meteorological extremes because it is extensive, exposed, and interdependent. Overhead transmission lines traverse forests, mountains, and coastlines, making them frontline victims of disasters arising from such events.
This edited contribution to INMR by Michele de Nigris summarizes recent work by Ricerca Sistema Energetico (RSE) in Italy to assess and improve the resilience of overhead transmission lines against extreme weather events. Special attention focuses on strong winds, heavy rain and snowfall and wildfire.

Background
Extreme weather events have struck the Italian transmission network in recent years, e.g. heavy wet snow that caused line trip outs, short circuits and structural failures; powerful winds that tore towers apart; heavy rain, floods and landslides that submerged substation equipment and collapsed tower foundations; and wildfires that impacted significant portions of the country causing damage as well as supply interruptions.
Continuous improvement in resilience of overhead lines in Italy has been an effort involving several parties, including the country’s national energy regulator (ARERA), which issued directives to incentivize network operators to enhance resilience of their power system by ensuring both rewards and penalties. Network operators were mandated to assess performance of their assets under extreme weather events and propose actions to improve resilience. RSE served as the technical arm to develop, propose, validate, and monitor methods to assess the effectiveness of the measures proposed to be taken before, during and after extreme events, i.e., anticipation, preparation, absorption, adaptation, rapid recovery, and sustainment of critical system operation.
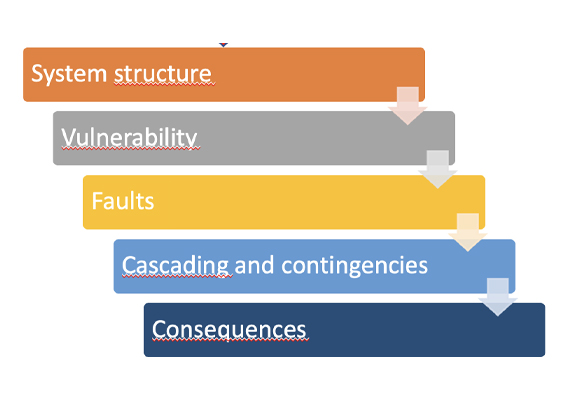
The method, developed jointly with Italian TSO Terna, has since been approved by the regulator and is now part of the transmission grid code. It is based on an advanced probabilistic approach, and deepens the connections between threats such as extreme weather events, component vulnerabilities (i.e., their susceptibility to these threats), and power system contingencies (i.e. failures) potentially leading to extended service degradation and blackouts.
Below is a summary of this, with focus on threats linked to extreme events and their consequences for overhead lines as the input to set up measures to increase resilience.
Extreme Weather Events
The European Copernicus program identified 2024 as the hottest year on record. Notably, global temperatures exceeded the 1.5°C increase above pre-industrial levels for the first time. November 2024 ranks as the second warmest month in history, with an average surface air temperature of 14.1°C, which is 0.7°C higher than the 1991-2020 average. Even of greater concern are sea temperatures due to their critical function as regulators of global climate. Data from 2024 show a concerning rise in damage due to prolonged drought (+54.5% compared to 2023), river floods (+24%), and pluvial floods (+12%). Italy, for example, is divided between regions experiencing chronic water shortages and those inundated by excessive rain, highlighting systemic inadequacies in adapting to extreme weather. Among the most adversely affected regions, Northern Italy experienced 198 extreme weather events, followed by Southern Italy with 92, and Central Italy with 61.
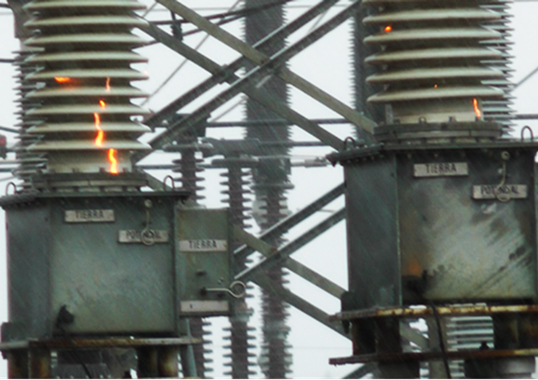
Electrical power infrastructure is particularly at risk because it is extensive, exposed, and interdependent. Overhead transmission lines cross forests, mountains, and coastlines, making them frontline victims of environmental extremes. Moreover, the situation in 2024 is not new. In recent years, several outstanding events caused extensive damage to power infrastructure and data from the Italian TSO confirm this dramatic trend. Fig. 1 depicts recent electrical system disruptions linked with extreme weather.
Among the events affecting the transmission system in Italy were:
• Storms & Winds:
Devastating windstorms such as the Vaia storm of October 2018 (with up to 200 km/h gusts) toppled 42 million trees and damaged power lines on a massive scale. Severe winds and winter storms often threaten the stability of transmission towers and lines.
• Floods & Landslides
Back-to-back heavy rainfall events in 2014 & 2015 triggered floods and debris flows, destabilizing transmission tower foundations and causing extended outages. Overall, between 2013 and 2020, landslides and floods accounted for about 9% of energy supply disruptions from extreme events in Italy. In terms of permanent impact to infrastructure, 58% of the damage recorded during landslides and flood events affected line poles and 17% the conductors.
• Wildfire
2017 and 2021 saw unprecedented wildfire activity in Italy, with the former dubbed an “annus horribilis” for number of fires and 2021 breaking the record for burned area (~150,000 ha). Hotter, drier weather has lengthened the fire season and increased extreme fire behaviour.
• Compound Hazards
These hazards often compound. For example, drought and heat favour ignition and spread of wildfire, or storms cause both flooding and landslides – challenging grid reliability. A severe snowstorm in early 2017 in central Italy caused line failures and concurrently hampered wildfire response by forcing transmission line shutdowns for firefighter safety.

Evaluating Threats: Methodology
To investigate the evolution of environmental hazards across extensive diverse regions, researchers have developed global gridded datasets, known as re-analyses. These consist of physically based reconstructions of historical conditions, generated through numerical weather prediction models that assimilate archival observations.
Such datasets provide three-dimensional representations of atmospheric and terrestrial variables at sub-daily intervals over historical timespans of varying length. The most used global reanalysis, developed by the European Centre for Medium-range Weather Forecasts (ECMWF) is the ERA5 dataset. It covers the globe with a spatial resolution of around 30 km and an hourly temporal resolution, with 137 vertical levels from the surface to a height of 80 km.
To reproduce and understand past and present threats over Italy, an atmospheric reanalyses dataset, called MERIDA was developed. MERIDA consists of a dynamic downscaling of the ECMWF global reanalysis ERA5, using a Weather Research and Forecasting (WRF) model, configured to describe typical weather conditions. The computational domain is defined using two grids with a spatial resolution of 21 km and 7 km respectively, with the internal grid centred over Italy, as shown in Fig. 2.
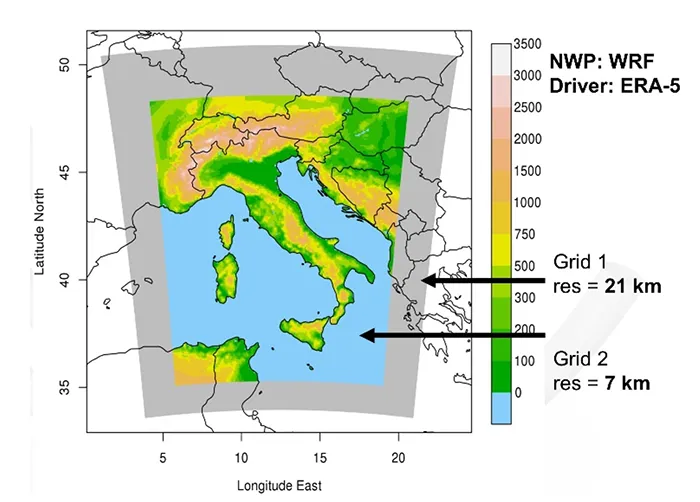
The dataset has hourly temporal resolution and spans over 30 years, with 22 different meteorological variables computed at 40 different altitude levels, comprising 1.5*1012 records. These datasets allow researchers to study past extreme events, understand their characteristics, and track their evolution over time. They are also essential to developing warning systems by identifying environmental conditions that favour occurrence of such events.
Moreover, to assist Transmission System Operators to develop robust resilience strategies, it is essential to utilize climate projections derived from advanced climate models. These models simulate the Earth’s future climate over coming decades, integrating scenarios based on varying concentrations of greenhouse gases that influence the planet’s radiative equilibrium, as well as factors such as demographic trends, land use, and economic development trajectories.
To assess the potential impact of extreme meteorological events on overhead transmission infrastructure, future climate scenarios are analysed using an ensemble of model simulations under 2 distinct configurations: Representative Concentration Pathway (RCP) 8.5, RCP4.5 and RCP2.6. RCP8.5 represents a high-emission scenario with minimal mitigation, whereas RCP4.5 reflects a pathway incorporating moderate greenhouse gas emissions reductions and RCP2.6 considers outstanding greenhouse gas emissions reductions.
For the Italian context, long-term climate projections are conducted using an ensemble of high-resolution (~12 km) regional models from the Euro-CORDEX initiative, each rigorously selected and validated for reliability. Both projections based on previously mentioned RCP 4.5 and 8.5 are considered. This methodology enables comprehensive evaluation of risks associated with climate-driven hazards that can affect the structural and operational integrity of transmission networks.

Strong Winds
Strong winds constitute an increasingly significant meteorological threat for operators of electrical networks. In recent years, Italy witnessed severe windstorms, with the Vaia event of late Oct. 2018 standing out in intensity. The storm affected northeast Italy, unleashing wind gusts between 100 and 200 km/h and resulting in widespread and protracted disruptions to electricity supply. Damage to transmission infrastructure was attributed both to direct mechanical stress exerted by extreme wind and to secondary effects such as the toppling of trees onto overhead lines.
Accurate analysis of extreme weather events within the context of Italy’s complex geomorphology requires spatial resolutions surpassing the 7 km offered by the MERIDA dataset. To this end, a high-resolution analytical tool has been developed: the Atlante EOLico ItaliANo (AEOLIAN) – a state-of-the-art Italian Wind Atlas designed primarily for energy system planning applications. AEOLIAN provides a 30-year (1990–2019) archive of wind data at an exceptional 1 km spatial resolution and hourly temporal granularity, covering Italy both on and offshore, across various measurement heights.
To illustrate the benefit of employing such high-resolution datasets in reconstructing wind fields over complex terrain, Fig. 3 presents a comparative analysis of 10m wind speeds recorded at the Monte Cesen meteorological station (Veneto Region, approx. 1500m above sea level) during the Vaia event, evaluated against previous reanalysis products, namely MERIDA and MERIDA HRES—the latter offering an improved 4 km horizontal resolution.
AEOLIAN demonstrated superior accuracy to observed wind series, whereas the coarser-resolution datasets exhibited more pronounced deviations at several timesteps. This highlighted the limitations of their modelling configurations and spatial resolutions in accurately reconstructing wind fields over complex terrain. Moreover, it is essential to underscore the distinctive nature of events such as Vaia, whose destructive potential depends greatly on slope orientation and local topography. Indeed, within a span of merely a few hundred metres, areas subjected to severe damage co-exist alongside zones that remained unaffected.
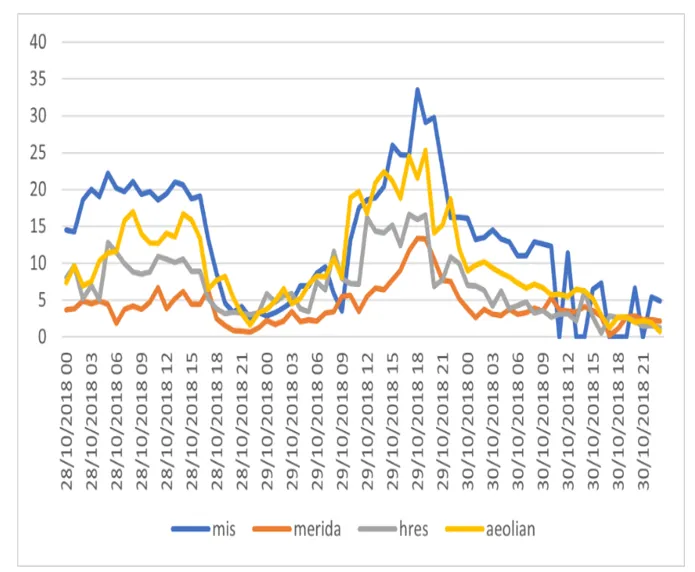
Fig. 4 illustrates the situation at another complex-terrain substation, Monte Verena. In this instance, all datasets displayed comparable behaviour, with AEOLIAN not exhibiting a clear advantage in capturing measured wind trends.
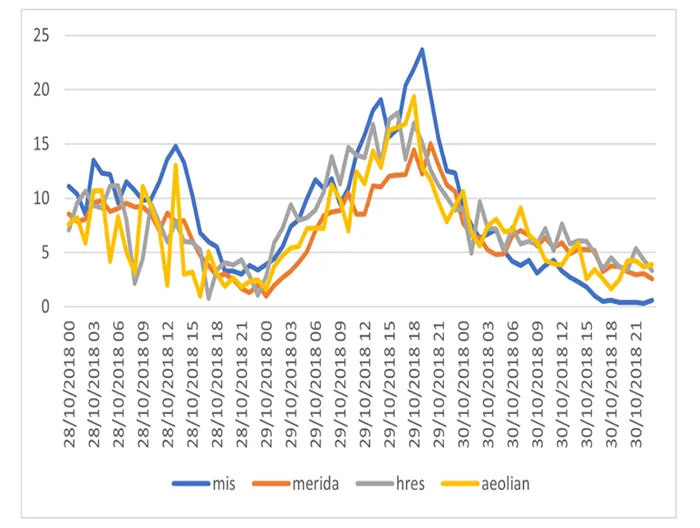

Collectively, this study underscored the intrinsic difficulty when trying to reconstruct localized extreme events, even when employing high-resolution datasets.
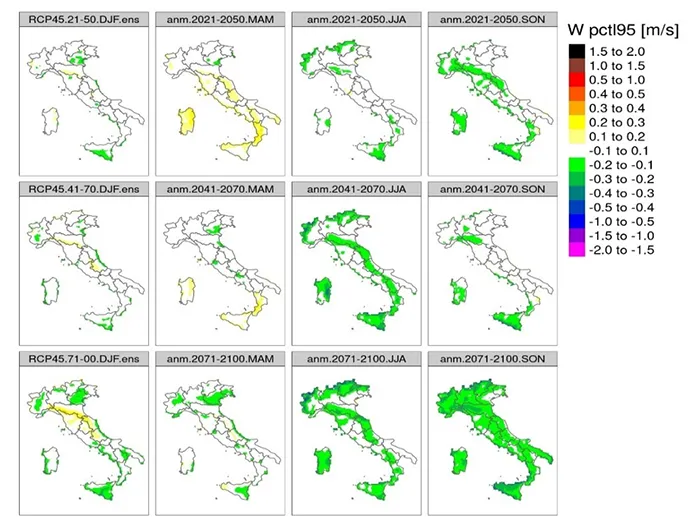
From a climate standpoint, application of modeled datasets—incorporating mean and maximum daily wind intensities—has enabled development of predictive scenarios spanning the periods 2021–2050, 2041–2070, and 2071–2100. These scenarios characterize both average and extreme aspects of wind intensity, as illustrated in Fig. 5. Notably, wide variability among the ensemble models (with standard deviation fields frequently exceeding the magnitude of projected change) complicates extraction of definitive trends, particularly concerning occurrence of extreme wind events—an outcome corroborated by prior studies.
Operationally, when forecasts indicate likelihood of a major windstorm, grid operators proactively implement preventive actions, such as real-time reconfiguration of load flows, to mitigate consequences of potential line outages. The aftermath of the Vaia storm, for example, prompted Italy’s TSO to expedite programs focused on reinforcing transmission towers in wind-exposed regions and expanding vegetation management along corridors to reduce risk of tree falls affecting lines.
In addition, advances in real-time monitoring—utilizing weather stations and LiDAR systems deployed along critical network spans—have enhanced operational responsiveness to wind-induced damage. Over the long term, undergrounding transmission lines, where technically and economically feasible, offers complete mitigation against wind-related hazards, although associated costs remain prohibitive for most high voltage routes.
As a result, primary adaptation strategies continue to prioritize fortification of overhead lines with deployment of stronger towers and reduced span lengths in high-risk zones. At the same time, refined outage management protocols such as rapid deployment of repair crews and use of mobile transformers can bolster network resilience in the face of increasingly severe wind events.
Extreme Precipitation
The overarching impact of total precipitation—comprising both snowfall and rainfall—on overhead transmission infrastructure is intrinsically linked to excess water infiltration into terrain. This generates surface runoff capable of inducing urban flooding in densely paved regions and greater inundations when river discharges exceed the capacity of channel banks. Moreover, water infiltration leads to soil saturation, diminishing its cohesive properties and thus predisposing terrain to landslides.
Within this analytical framework, the MERIDA and MERIDA HRES reanalysis tools have proven indispensable for depicting both synoptic meteorological phenomena—primarily originating from frontal systems. These are distinguished by prolonged and persistent precipitation over extensive areas with the potential to induce landslides and major flooding (e.g. the 1994 Piedmont flood). Also, convective events that give rise to highly intense, localized storms can trigger catastrophic flash floods and debris flow episodes.
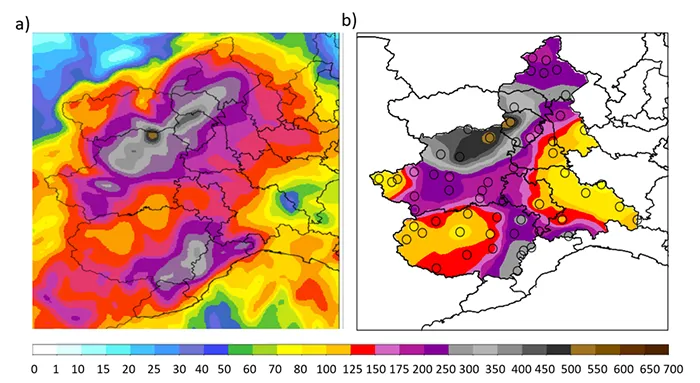
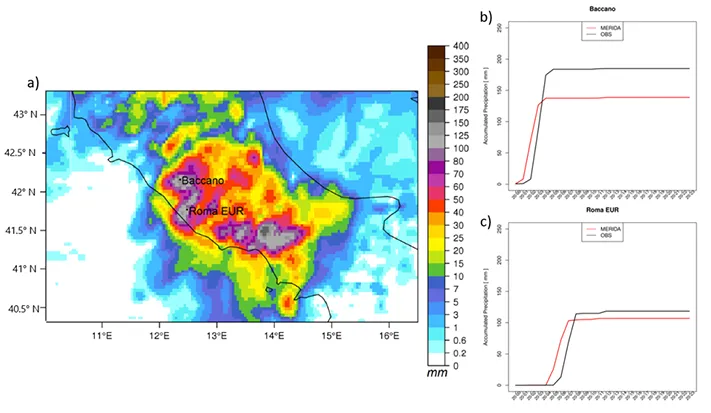
Figs. 6 and 7 illustrate the efficacy of historical datasets in replicating the cumulative precipitation associated with such extreme events: the 1994 Piedmont flood, which resulted in 70 fatalities and economic losses amounting to approximately 1.2% of Italy’s GDP for that year and the 2011 urban flooding in Rome, where 120 mm of rain fell within 2 hours, causing substantial disruption to urban infrastructure and electrical substations. In both scenarios, the MERIDA reanalysis products demonstrated their ability to reconstruct these extreme events, with modeled precipitation patterns and quantities aligning closely with observations from the Italian rain gauge network.
Specifically, Fig. 6 depicts accumulated precipitation for the Piedmont flood in Nov. 1994, juxtaposing MERIDA output with interpolated station data from the Italian observation network. MERIDA successfully captured both the principal precipitation peak and its magnitude, corroborated by ground observations. Similarly, Fig. 7 displays the accumulated precipitation map for the Rome urban flooding event of Oct. 2011, contrasting MERIDA reanalysis with observed accumulated precipitation at Baccano and Roma EUR sites, as reported by local rain gauges.
The MERIDA dataset accurately replicated the intense and localized precipitation events at Baccano and Rome (Panel a), albeit with a local underestimation in correspondence of Baccano (Panel b). A more accurate estimate was obtained for ROMA EUR station (Panel c).
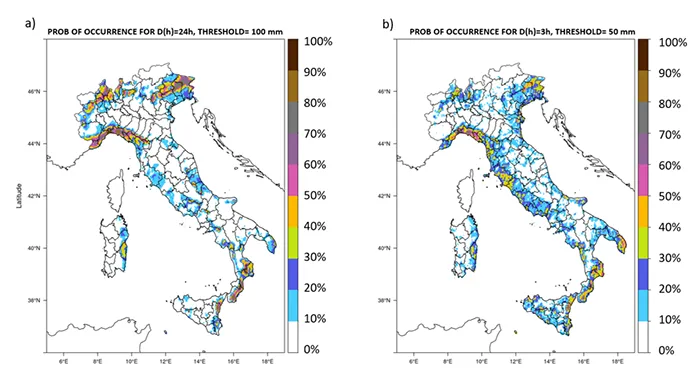
Availability of more than 3 decades of data from the MERIDA reanalysis has enabled application of the Generalized Extreme Value (GEV) method to estimate statistical return periods and, consequently, determine the probability of occurrence of extreme precipitation events, encompassing both persistent synoptic systems and short-lived, high-intensity convective storms. The results presented in Fig. 8 delineate regions of the Italian peninsula that are most susceptible to extreme precipitation, differentiated by rainfall duration.
Panel a, which illustrates the probabilities of occurrence of events exceeding 50 mm in 3-h, identifies regions with the greatest propensity for intense, localized convective storms. These are concentrated mainly in Liguria, and in the Ionian sectors of southern Italy, where formation of low-pressure systems over the western Mediterranean facilitates uptake of moisture from the sea. Upon encountering complex coastal topography, these air masses release heavy, spatially confined downpours.
Panel b depicts likelihood of events surpassing 100 mm of precipitation within a 24-h period. Here, spatial distribution of high probabilities closely tracks regions where the most significant rainfall is attributable to winter frontal systems interacting with mountain topography of the Alps and Apennines. This dynamic results in prolonged, abundant precipitation across northern Italy, Liguria, and the southern areas of Calabria and Sicily.
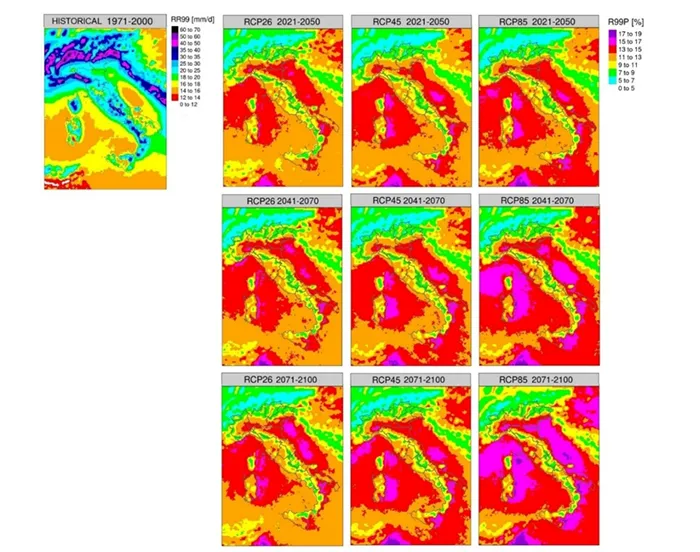
To systematically assess projected patterns of extreme precipitation across Italy through a climatological lens, the WMO ETCCDI climate extreme index R99PTOT was employed. This index is tailored to characterize climatic extremes by quantifying frequency of exceptionally wet days—defined as when daily precipitation exceeds the 99th percentile of the established reference period. Temporal analysis reveals a pronounced trajectory toward intensification of such extremes throughout this century, with regional manifestations most evident in the north and coastal sectors of Italy.
The magnitude and spatial distribution of these anomalies vary according to the different Representative Concentration Pathway scenarios (RCP2.6, RCP4.5, and RCP8.5), as illustrated in Fig. 9.
Geo-Hydrological Hazards
Geo-hydrological hazards, including flooding and landslides, constitute significant risks to electrical infrastructure. Extreme flood events can compromise operational capacity of hydropower plants which are pivotal for balancing critical hydrological regimes and safeguarding downstream regions. Landslides can impact power lines, leading to local failures that have the potential to cascade across the network.
To assess and quantify these risks, a novel process-based numerical framework—CRHyME (Climatic Rainfall Hydrogeological Model Experiment)—has been developed. CRHyME is a spatially distributed, basin-scale model designed to simulate the initiation and propagation of rainfall-induced geo-hydrological hazards, specifically shallow landslides and debris flows, and to quantify their respective magnitudes. The model’s architecture integrates the physical mechanisms by which hydrological dynamics influence and potentially trigger geo-hydrological instabilities at the catchment scale, encompassing a suite of slope stability processes.
Geo-hydrological threats from intense precipitation are principally categorized as shallow landslides and debris flows. These phenomena can originate either on hillslopes or within drainage networks, emerging from collapse of the superficial soil layer. Notably, debris flows are characterized by higher water content, enabling them to travel with greater velocity and over more extensive distances compared to shallow landslides, with substantial volumetric growth driven by erosive entrainment. The CRHyME Model incorporates predictive formulations for the triggering of both processes.
The CRHyME Model is currently undergoing development. Below, two representative applications are presented: the first involves a retrospective analysis of historical geo-hydrological events, while the second explores projections of future geo-hydrological hazards affecting high voltage lines traversing two catchments in the Emilia region of Italy. For retrospective analyses, outputs from the MERIDA reanalysis served as input data, whereas future projections were generated using three distinct climate models from the EURO-CORDEX programme.
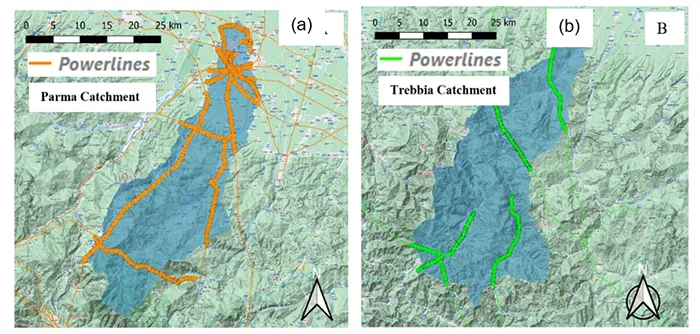
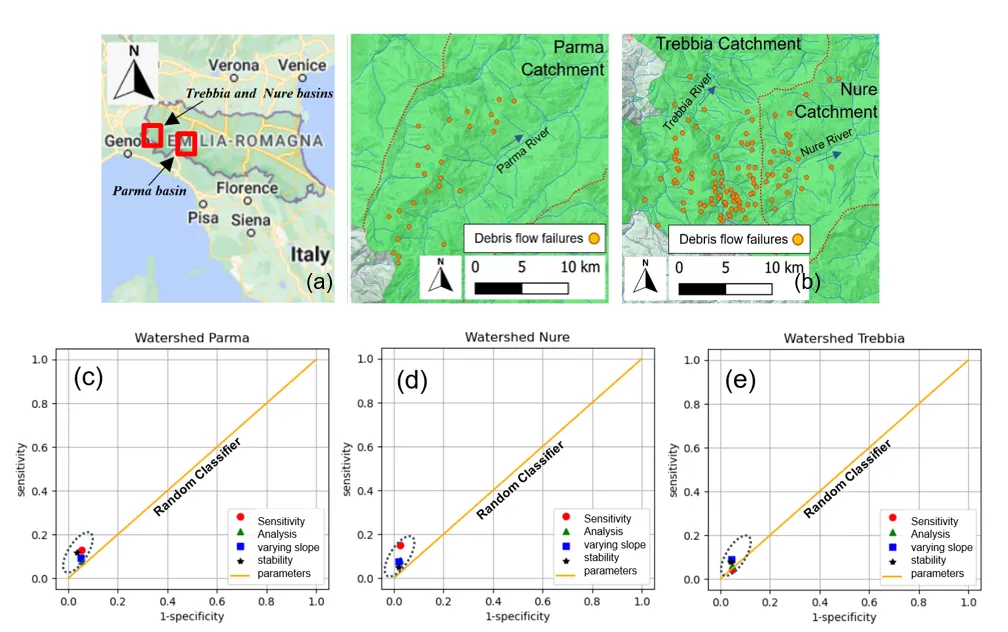
The Emilia region experienced severe geo-hydrological phenomena in Oct. 2014 and Sept. 2015, during which multiple shallow landslides were triggered, that subsequently evolved into debris flows and flash floods. The most significantly impacted watersheds were the Parma basin during the Oct. 2014 event, and the Trebbia and Nure basins during the Sept. 2015 event (see Fig. 10). This region is of strategic importance for the Italian transmission network since several high voltage lines intersect the affected catchments.
According to the literature, pylons represent the most vulnerable components within electrical power systems since they are highly susceptible to collapse if impacted by rapidly moving landslides. While the network is sometimes capable of compensating for isolated tower failures, redundancy is not always guaranteed, thereby demanding enhanced attention in infrastructure planning. Exposure of high voltage lines to geo-hydrological threats—specifically shallow landslides and debris flow failures—has been evaluated in relation to their spatial distribution within the catchments (see Fig. 10).
For the Emilia region case study, simulations using the CRHyME framework encompassed a 5-year period, spanning from Sept. 1, 2011 to Sept. 1, 2016, during which major geo-hydrological events (Oct. 13, 2014 and Sept. 14, 2015) were recorded in the area. MERIDA reanalysis data—including daily rainfall and temperature—served as the basis for these simulations, ensuring a robust representation of the climatic conditions influencing occurrence of shallow landslides and debris flows within the study domain.
Evaluation of CRHyME’s capability to identify debris flow initiation during the October 2014 and September 2015 events (see Fig. 11) was conducted through Receiver Operating Characteristic (ROC) analysis. In most cases, the model demonstrated superior performance compared to a random classifier, exhibiting sensitivity values between 0.1 and 0.2, and generally higher specificity contingent upon chosen slope stability parameters. Across these simulations, detection of debris flow failures was particularly effective within a confined valley catchment, corroborating in situ field observations.
Specifically, the Nure watershed achieved the highest classification scores, followed by the Parma basin with intermediate performance, whereas model representation of slope instabilities was comparatively limited for the Trebbia catchment.
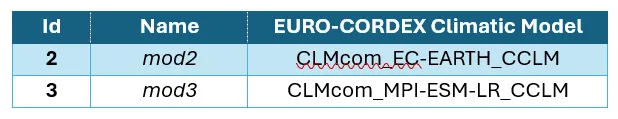
Given the potential for recurrence of such phenomena, the CRHyME model was executed under the most severe climate change scenario (RCP8.5). The climate projections are derived from the EURO-CORDEX project [21], [46], with the RCP 8.5 scenario employed (see Table 1). For the analysed EURO-CORDEX models (including mod2, mod3), the CRHyME framework was applied to future simulations spanning the period from Jan. 1, 2006 to 1 Jan. 1, 2075.

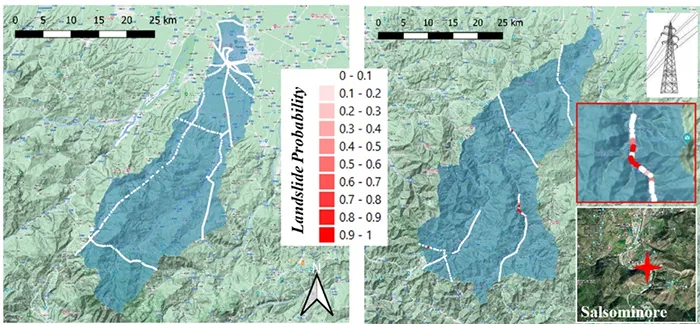
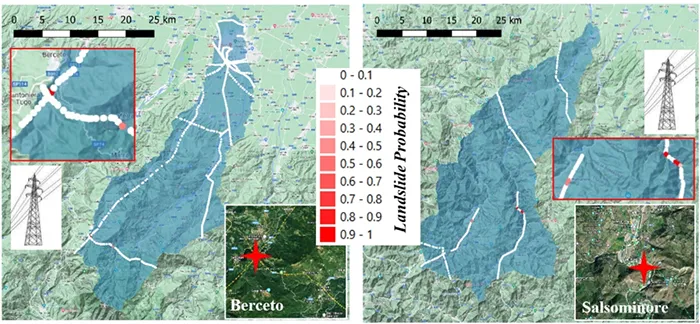
Extended simulations were undertaken to assess the likelihood of landslide occurrence at specific locations. Strictly speaking, landslide events are not inherently periodic, as subsequent geomorphological alterations can fundamentally change local slope stability dynamics. However, in the absence of explicit modelling of such features, frequency is utilised as an indicator to identify the most conditionally unstable regions warranting particular attention. Figs. 12 and 13 present the frequencies of shallow landslide and debris flow failures under projected climate change scenarios, as derived from the mod2 simulation. Comparable spatial distributions were observed in simulations mod3. Within both catchments, the most unstable regions are depicted in red, whereas areas exhibiting relative stability are shown in white. Overlays of high-voltage powerline networks on these hazard maps facilitate a spatial analysis of risk exposure, enabling the identification of sectors most susceptible to shallow landslides and debris flows.
Findings indicate that the Trebbia basin’s highest risk sector for power line vulnerability is situated near Salsominore, while in the Parma basin the area of greatest concern is proximal to Berceto. Notably, the pylon with the maximal predicted probability of debris flow failure is geographically close to zones that underwent severe geo-hydrological disturbances in Sept. 2015 and Oct. 2014, thereby corroborating the pronounced landslide susceptibility of these localities.
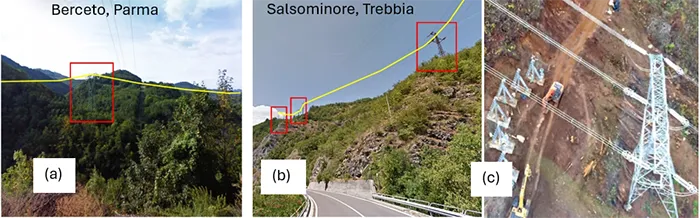
Prospective geo-hydrological hazards are likely to continue posing significant risks in these sectors. Accordingly, implementation of mitigation strategies (see Fig. 14) or potential relocation of pylons, is advised to prevent overhead line failure and mitigate risk of future blackouts.

Wildfire
Concern regarding wildfire hazards has intensified in recent years, particularly across the Mediterranean. Prolonged heat waves, extended drought, and strong winds—conditions exacerbated by climate change—now occur with greater frequency, creating an environment conducive to wildfire propagation.
Ignition and sustenance of fires involve 3 principal factors: combustible material, oxygen, and elevated temperatures. Italy’s terrain, notably in southern areas, is abundant in combustible vegetation, including scrub, dry grasses, and wood, contributing to fuel availability. While ambient temperatures in Italy seldom reach thresholds for spontaneous combustion, critical summer conditions can facilitate ignition and markedly accelerate fire spread, with wind serving as primary vector for propagation.
The European Forest Fire Information System (EFFIS) systematically monitors burned areas throughout Europe, compiling comprehensive data on incidence and extent of wildland fires across European member states with annual updates. EFFIS records indicate a pronounced escalation in wildfire occurrences throughout Italy over the past decade, peaking in 2017—a year designated as annus horribilis—and culminating in a record of 150,000 hectares affected in 2021. Projections suggest that frequency and severity of wildfires will continue to rise in coming decades, driven by increasing prevalence of fire-favourable weather conditions.
Wildfires inflict significant damage on critical infrastructure, particularly transmission lines, which are frequently de-activated to facilitate firefighting efforts and mitigate safety risks. Between 2017 and 2023, approximately one thousand transmission line deactivations were documented as direct or indirect consequences of proximal wildfires. Such disruptions exert considerable influence on continuity of electricity supply as well as market stability for end-users.
Formulation of an effective forecasting methodology for wildfire-prone conditions is paramount for preparedness and timely intervention. Direct prediction of wildfire ignition, however, is not feasible, since naturally occurring fires are rare in the Italian context, whereby lightning strikes with absence of precipitation. Most ignition sources are human caused. Nonetheless, it is still possible to predict the environmental and meteorological conditions that predispose an area to fire initiation and propagation.
Forecasting fire spread risk is therefore critical to enable Transmission System Operators to proactively plan for and manage potentially hazardous situations at specific locations. Development of a robust early warning system requires characterization of each site with respect to land cover, vegetation type, slope, elevation, and soil moisture. By integrating detailed weather data, it then becomes feasible to compute a fire danger index.
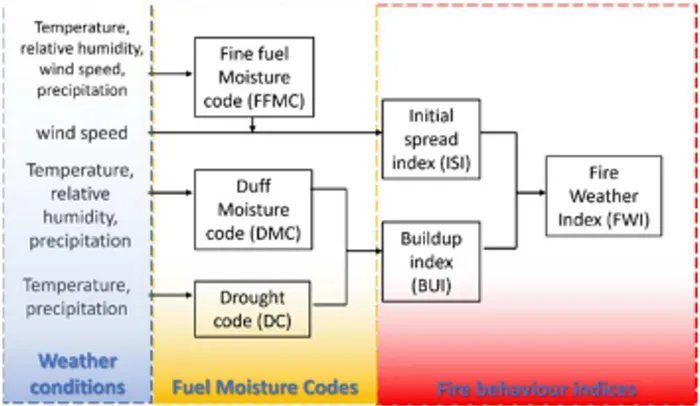
A meteorological indicator known as the Fire Weather Index (FWI) has been developed and adopted globally. FWI quantifies the propensity for wildfire ignition and expansion under prevailing meteorological conditions and now forms the backbone of most operational wildfire monitoring frameworks worldwide. FWI also serves as a quantitative measure of fire danger, derived from meteorological inputs. It is calculated daily using midday temperature and relative humidity at a height of 2 m, wind speed at 10 m, and total precipitation over the preceding 24-h. These variables modify FWI values from the previous day in an iterative process, necessitating an initial condition and a designated spin-up period to ensure accurate computation.
Structurally, FWI comprises 6 distinct components: 3 that pertain to the moisture content of various fuel types, 2 that describe rate of fire spread and fuel consumption, and one that quantifies fire intensity as the energy output per unit length of the fire front. Fig. 15 presents a schematic overview of these components. Analysing the scheme reported, it becomes possible to note that weather information is an input for all components of the final danger index. Therefore, accurate estimation of local weather is essential to obtain a reliable fire danger value.
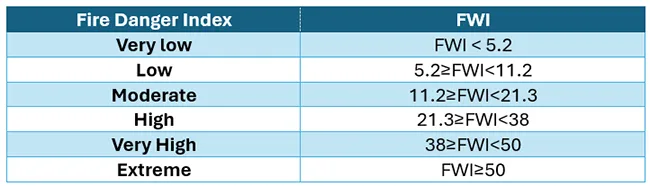
Higher FWI values correspond to higher fire hazard. Classes of hazard have been defined by EFFIS, according to values reported in Table 2.
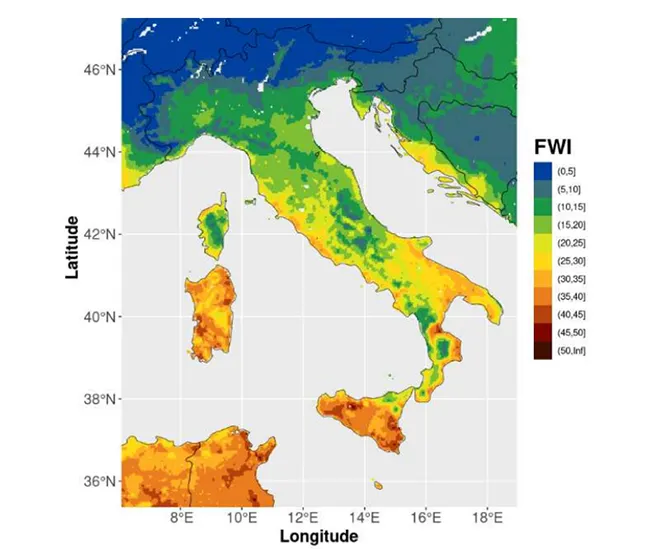
In the current study, FWI has been employed to assess average fire danger across Italy, with the aim of identifying regions exhibiting increased risk due to geomorphological and climatic factors. Calculation of FWI was based on historical analysis of meteorological parameters—including precipitation, temperature, wind speed, and relative humidity. The data utilized derived from an internal reanalysis dataset, MERIDA HRES-OI, which provides a spatial resolution of 4×4 km with hourly temporal granularity, amalgamating numerical weather simulations and observational data. Fig. 16 reports assessment of FWI for the timespan 2005 to 2020. Moreover, FWI underpins a prototype warning system designed specifically for the Italian Transmission System, delivering forecasts of fire danger for each 4×4 km grid cell up to 3 days in advance.
Long-term average FWI provides insight into the climatology of a region and enables identification of areas most susceptible to wildfire, thereby supporting strategic infrastructure planning. Nevertheless, use of average values alone does not account for variability year-to-year, which can result from transient synoptic-scale phenomena and significantly influence fire risk in any given year.
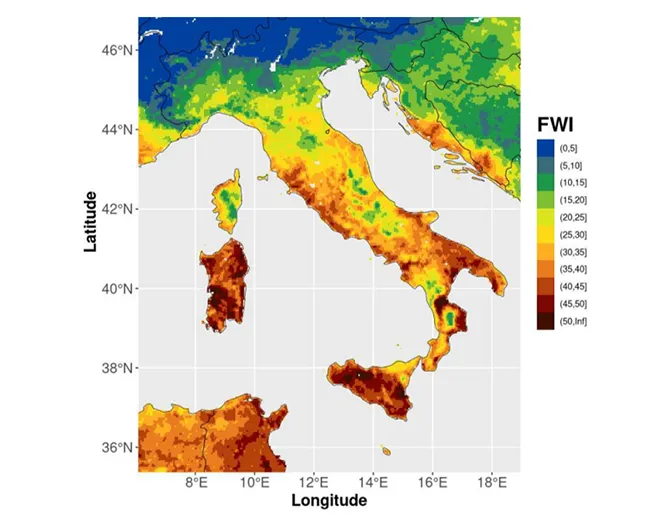
For example, 2017 was marked by numerous wildfire events across Italy. Fig. 17 presents average FWI distribution for summer 2017, facilitating direct comparison with the climatological baseline shown in Fig. 16. Notably, the data reveal elevated FWI values in the Islands, northern Calabria, and throughout Apulia, regions that typically exhibit lower baseline fire danger classes, with FWI values generally ranging from approximately 15 to 30. This contrast underscores the exceptional nature of wildfire risk in these areas in 2017.
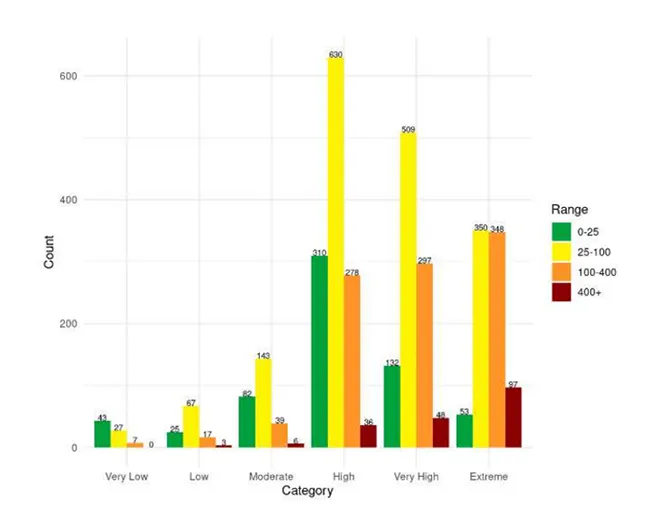
To rigorously evaluate FWI as a reliable indicator of wildfire danger and to facilitate its application in an effective warning system, a comprehensive analysis has been performed correlating historical fire events with corresponding FWI values. Specifically, wildfire occurrence catalogued in the EFFIS Burned Area Dataset for the Italian Peninsula between 2010 and 2020 was compared against FWI values derived from the MERIDA HRES-OI dataset on the day of ignition, classified according to categories outlined in Table 2.
Results, depicted in Fig. 18, demonstrate that 87% of ignitions occurred during periods characterised by “high”, “very high”, or “extreme” fire danger, with most small and medium-sized fires associated with “high” FWI days. The largest wildfire events (exceeding 400 hectares of burned area) occurred mainly under the most severe FWI conditions, with a clear escalation in event magnitude corresponding to increasing FWI danger class. Conversely, fewer small wildfires were observed in the upper FWI categories, underscoring the propensity for fires to escalate rapidly and exceed containment under adverse meteorological conditions. These findings support the conclusion that elevated FWI values are strongly associated with potential for wildfires to spread uncontrollably.
Having established the efficacy of FWI as an indicator of wildfire danger, a prototype fire danger warning system has been developed. To illustrate this methodology, reference is made to July 19, 2022 and the major wildfire that occurred in Massarosa, Tuscany—an event that posed significant risk to power infrastructure supplying a densely populated coastal region, including Viareggio, during the peak tourist season.
Fig. 19 displays FWI values calculated from meteorological forecasts issued the previous day (July 18), with wildfire locations recorded in the EFFIS Burned Area Dataset for 2022-07-19 denoted by purple markers. It is evident that multiple areas exhibited extreme FWI values, attributable to prolonged high temperatures and a persistent deficit of precipitation, leading up to the ignition event.
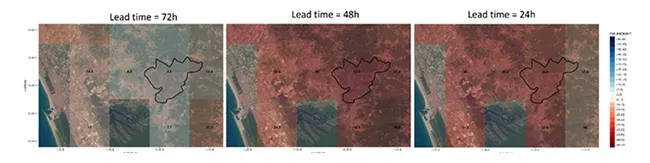
Notably, daily FWI values on high-risk days can greatly exceed the summer average (see Fig. 16 for comparison), often surpassing 75. Moreover, all wildfire incidents occurred in zones characterized by extremely elevated FWI levels, which further substantiates use of this index for early warning and fire danger assessment. The Massarosa wildfire ultimately affected some 860 hectares and caused significant disruptions to the regional electrical grid. The area impacted is clearly delineated in SENTINEL-2 satellite imagery.
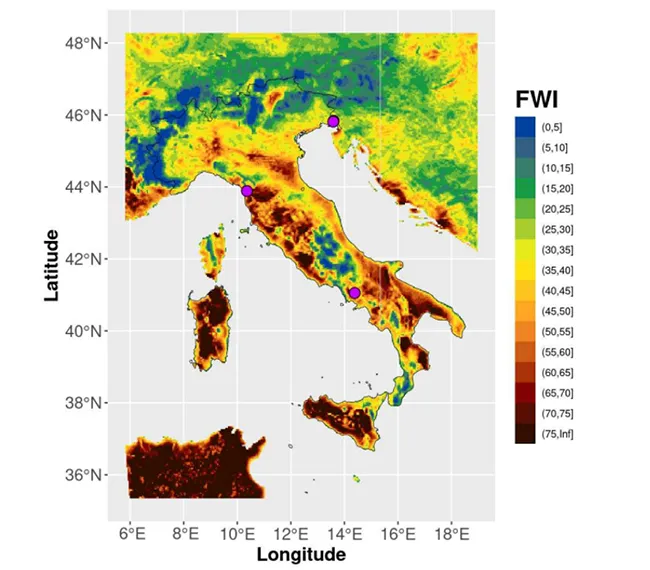
Fig. 20 represents FWI values over the area of interest as well as shape of the area burned. It should be noted that the forecast issued 3 days in advance (lead time = 72 hours) greatly underestimated fire danger of the area; the following 2 forecasts, issued 48 and 24 hours before fire ignition corrected this and yielded an FWI value of 60+, more than 40 points higher than the July average for that area (seen in Fig. 21).
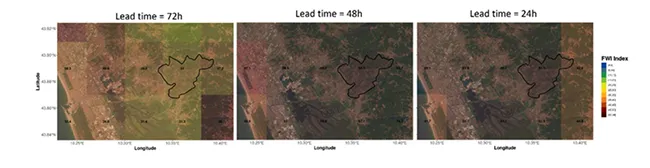
This change in the forecast is due to the 3-day forecast giving a lower value for wind speed than the other two, the latter being more realistic given that newspapers reported the presence of a strong Mistral wind.
Overall, looking at many other case studies, FWI values stay consistent throughout the forecasts, despite their being issued at different times (with the earliest being issued 3 days before the fires). This suggests that FWI could probably be used as a reliable fire danger index, even in forecasts with lead times longer than 3 days.
Another interesting observation of note from Fig. 19 is that there is a large inhomogeneity in the index along the peninsula and in the islands. This reflects the ability of the index to be sensitive to local variations in weather conditions, and also the capability of the WRF model to accurately describe the complex geography of Italy. It should also be noted that while there were high FWI values in Sicily and in Sardinia, no wildfires broke out. This illstrates that FWI does not indicate probability of fire ignition caused by human activity but rather ease of fire spread in the event of ignition.
Conclusions
Overhead power lines are exposed to intense weather events that can impact their performance and threaten their structural integrity. Transmission system operators are required to implement adequate measures to increase resilience of power networks.
Short term operational decisions and long-term planning and network reinforcement measures can be carried out using an advanced probabilistic approach to risk. The methods set up in the case of Italy required computing the severity, extent and duration of the threats, in terms of associated probability distributions, knowing evolution of meteorological phenomena over geographically spread infrastructure. To assess evolution of threats during the recent past and during the current period, an atmospheric reanalyses dataset, called MERIDA, has been developed and validated for strong winds, extreme precipitation, landslides and wildfires.
Long term climate-related projections are carried out using an ensemble of high-resolution regional models, adequately selected, and validated, to elaborate future climate scenarios under different greenhouse gas emission pathways (namely, RCP8.5, RCP4.5) and RCP2.6. Extreme precipitation is expected to increase locally, mainly over northern regions and over coastal areas, whereas no significant change in occurrences of extreme winds were detected in the analyses.
Geo-hydrological hazards are frequent and related to meteorology and climate but their magnitude is difficult to quantify. Nonetheless, the former is necessary to carry out proper risk assessment and define strategies for increasing resilience of electrical infrastructure. This is particularly true under the projected future climate change scenario whereby intensification of extreme events is expected with high confidence.
The new CRHyME represents a novelty in the panorama of classical spatially distributed hydrological models. It tries to couple together slope failure models with the hydrological component and includes extreme event reanalysis and climate change scenarios in the simulation. Resilience plans based on application of the method described are adopted with approval of the national regulatory Authority.
A fire danger assessment for Italy has been performed by calculating FWI over the entire country over the past two decades. Results comparing wildfires in Italy with FWI values show a clear relationship between the two, and FWI is therefore valid as a fire danger indicator.
A fire danger forecasting tool to support transmission system operators in their real time operation of the power system has been set up and implemented. This tool could prevent critical situations and avoid prolonged outages and economic losses by assuring better preparedness and more rapid response to fire events. Preliminary results look promising. Further analyses and improvements are underway, for example refining description of the soil, which is a fundamental element in determining FWI.
Acknowledgements
This work has been financed by the Research Fund for the Italian Electrical System under the Three-Year Research Plan 2025-2027 (MASE, Decree n.388 of November 6th, 2024), in compliance with the Decree of April 12th, 2024. None of the content of this article has been AI-generated; the author did, however, use MSCopilot for editing and styling purposes. This is, as mentioned, a review paper. It refers to numerous recent works carried out in Italy by researchers and experts from RSE, namely: A. Abbate, F. Apadula, R. Bonanno, E. Ciapessoni, D. Cirio, E. Collino, F. D’Amico, P. Faggian, M. Lacavalla, L. Mancusi, A. Pitto, S. Sperati, A. Trevisiol, F. Viterbo, L. Vadacca. A close collaboration has been established with TERNA and the following experts have been involved: L. Minto, F. Pietrocola, S. Talomo, C. Vergine.
Bibliography
[1] M. de Nigris; A. Abbate; R. Bonanno; E. Collino; P. Faggian; S. Sperati; F. Viterbo, «Understanding and mitigating the effects of climate change on overhead transmission lines: recent developments in Italy,» Cigre Science and Engineering, n. N°32 February 2024, 2024.
[2] F. D’Amico; E. Collino; F. Viterbo; R. Bonanno; M. de Nigris; C. Vergine; F. Pietrocola; S. Talomo, «Fire Danger Characterization in Italy: Mitigating the Impact on Real Time Operation of the Power System,» in AEIT International Conference, Trieste, 2024.
[3] A. Abbate; L. Mancusi; F. Apadula; M. de Nigris, «CRHyME (Climatic Rainfall Hydrogeological Model Experiment): a model for geo-hydrological hazards quantification to electrical infrastructures,» in CIGRE 2023 Sendai Colloquium, Japan, 3-7 October 2023, Sendai – Japan, 2023.
[4] Ministero dell’Ambiente e della Sicurezza Energetica, Ricerca di Sistema : modalità per la selezione e il finanziamento dei progetti di ricerca da ammettere all’erogazione degli stanziamenti di cui all’articolo 11 (Fondo per la ricerca), comma 1, del decreto 26 gennaio 2000, 2024.
[5] ARERA, Deliberazione 22 Dicembre 2015 646/2015/R/Eel – Testo Integrato Della Regolazione Output-Based Dei Servizi Di Distribuzione E Misura Dell’energia Elettrica, Per Il Periodo Di Regolazione 2016-2023, 2015.
[6] ARERA, Deliberazione 23 Dicembre 2015 653/2015/R/Eel – Testo Integrato Della Regolazione Output-Based Del Servizio Di Trasmissione Dell’energia Elettrica, Per Il Periodo Di Regolazione 2016-2023.
[7] ARERA, Determinazione 7 marzo 2017 n. 2/2017 Linee guida per la presentazione dei Piani di lavoro per l’incremento della resilienza del sistema elettrico.
[8] TERNA, «ALLEGATO A76 – Metodologia Per Il Calcolo Del Beneficio Per L’incremento Della Resilienza Della RTN,» 2021.
[9] ARERA, Deliberazione 18 Gennaio 2022 9/2022/R/Eel – Verifica Di Conformità Del Codice Di Trasmissione, Dispacciamento, Sviluppo E Sicurezza Della Rete, In Materia Di Valutazione Dell’incremento Di Resilienza Di Progetti Di Sviluppo Della Rete, 2022.
[10] E. Ciapessoni, D. Cirio, G. Kjølle, S. Massucco, A. Pitto e M. Sforna, «Probabilistic Risk-Based Security Assessment of Power Systems Considering Incumbent Threats and Uncertainties,» IEEE Trans. on Smart Grid, vol. vol. 7, n. no. 6, pp. 2890-2903, Nov. 2019.
[11] E. Ciapessoni, D. Cirio, A. Pitto, P. Marcacci, M. Lacavalla, S. Massucco, F. Silvestro e M. Sforna, «A Risk-based methodology and tool combining threat analysis and power system security assessment,» Energies, vol. 11, n. 83, 2018.
[12] E. Ciapessoni, D. Cirio, A. Pitto e M. Sforna, «A risk-based resilience assessment tool to anticipate critical system conditions in case of natural threats,» IEEE Milan PowerTech, Milan, Italy, 2019, pp. 1-6., 2019.
[13] E. Ciapessoni, A. Pitto e D. Cirio, «An Application of a Risk-Based Methodology to Anticipate Critical Situations Due to Extreme Weather Events in Transmission and Distribution Grids,» Energies – https://doi.org/10.3390/en14164742, 2021.
[14] E. Ciapessoni, A. Pitto e G. Pirovano, «Quantifying the benefits of Room Temperature Vulcanising rubber coatings for HV insulators against pollution in power system resilience assessment studies,» in IEEE PES General Meeting, 2023.
[15] COPERNICUS, «Global Climate highlights 2024,» 2025.
[16] TERNA, «Informativa di Terna sul Cambiamento Climatico,» 2023. [Online]. Available: https://download.terna.it/terna/Informativa%20di%20Terna%20sul%20Cambiamento %20Climatico%202022_8da6b2fd714984b.pdf.
[17] W. Skamarock, J. Klemp e J. Dudhia, «A Description of the Advanced Research WRF Version 3,» Tech. Note NCAR/TN-475+STR, 2008.
[18] H. Hersbach, B. Bell, P. Berrisford e al., «The ERA5 global reanalysis,» Q J R Meteorol Soc, vol. 146, n. 730, pp. 1999-2049, 2020.
[19] R. Bonanno, M. Lacavalla e S. Sperati, «A new high‐resolution Meteorological Reanalysis Italian Dataset: MERIDA,» Quarterly Journal of the Royal Meteorological Society, vol. 145, n. 721, pp. 1756-1779, 2019.
[20] D. Van Vuuren, J. Edmonds, M. Kainuma, K. Riahi, A. Thomson, K. Hibbard, G. Hurtt, T. Kram, V. Krey e J.-F. e. a. Lamarque, «The representative concentration pathways: An overview.,» Climate Change, vol. 109, p. 5–31, 2011.
[21] F. Giorgi e W. Gutowski, «Regional dynamical downscaling and the CORDEX initiative,» Annu. Rev. Environ. Resour., vol. 40, pp. 467-490, 2015.
[22] P., Faggian; R., Bonanno; M., Lacavalla; P., Marcacci; G., Pirovano, «Research and operational activities to cope with wet snow impacts on overhead power lines in current and future climate over Italy,» in Proceedings of the CIGRE’-SEERC 2nd South East Regional CIGRE Conference, Kyiv – Ukraine, 2018.
[23] P. Faggian; A. Trevisiol; G. Decimi, «Future projections of wet snow frequency and wet snow load on overhead high voltage conductors over Italy,» Cold Regions Science and Technology, vol. vol. 217, p. 103980, 2024.
[24] P. Faggian; A. Trevisiol,, «Climate extreme scenarios affecting the Italian energy system with a multi-hazard approach,» Bulletin of Atmospheric Science and Technology, Vol. %1 di %2vol. 5, fasc. 1,, p. 4, 2024.
[25] F., Viterbo; R., Bonanno; S., Sperati, «La rianalisi meteorologica e idrologica a supporto del sistema elettrico nazionale per l’individuazione delle minacce atmosferiche e al suolo,» Ricerca di Sistema (RdS), 2022.
[26] M., Lacavalla; R., Bonanno; S., Sperati, «La rianalisi meteorologica e idrologica a supporto del sistema elettrico nazionale per l’individuazione delle minacce atmosferiche e al suolo,» Ricerca di Sistema, Milano, 2020.
[27] S., Sperati; S., Alessandrini, «La nuova banca dati anemologica italiana,» Ricerca di Sistema (RdS), Milano, 2021.
[28] S. Sperati et al., «A new Wind Atlas to support the expansion of the Italian wind power fleet,» Wind Energy, Vol. %1 di %2vol. 27, fasc. 3, p. pp. 298–316, 2024.
[29] B. Rockel; K. Woth, Extremes of Near-Surface Wind Speed over Europe and Their Future Changes as Estimated from an Ensemble of RCM, 2007.
[30] P. Faggian, «Climate Change Projections for Mediterranean Region with Focus over Alpine Region and Italy,» Journal of Environmental Science and Engineering B, vol. 4 (2015), n. doi:10.17265/2162-5263/2015.09.004, pp. 482-500, 2015.
[31] F. Cavalleri et al., «Multi-scale assessment of high-resolution reanalysis precipitation fields over Italy,» Atmospheric Research, vol. vol. 312, pp. p. 107734,, 2024.
[32] Consiglio Nazionale delle Ricerche, Istituto di Ricerca per la Protezione Idrogeologica (CNR-IRPI), «Evento alluvionale in Piemonte. 02-06 Novembre 1994,» Popolazione a Rischio da Frana e da Inondazione in Italia (POLARIS), [Online]. Available: https://polaris.irpi.cnr.it/event/evento-alluvionale-in-piemonte/. [Consultato il giorno 21 04 2023].
[33] S. Kotz.; S. Nadarajah, Extreme value distributions: theory and applications, World Scientific, 2000.
[34] WMO, «Guidelines on Analysis of Extremes in a Changing Climate in Support. of Informed Decisions for Adaptation,» Technical Report WCDMP. No. 72, WMO/TD-No. 1500, Geneva, Switzerland, 2009, 2009.
[35] P. Faggian, «Future Precipitation Scenarios over Italy,» Water 2021, 13, 1335, vol. 13, n. https://doi.org/10.3390/w13101335, p. 1335, 2021.
[36] L. Mancusi e A. Abbate, «Manuale del modello CRHyME (Climate Rainfall Hydrogeological Modelling Experiment), RSE Report RdS 21012462,» RSE, Milano, 2021.
[37] L. Mancusi e A. Abbate, «Strumenti per la mappatura delle minacce idrogeologiche per il sistema energetico e incidenza dei cambiamenti climatici RSE Report RdS 21010317,» RSE, Milano, 2021.
[38] N. Bernardo, L. Vadacca e A. Abbate, «Valutazione integrata delle pericolosità geologiche per il sistema elettro-energetico italiano: individuazione di un caso pilota strategico,» Ricerca di Sistema 2022 n. 22014047, Milano, 2022.
[39] A. Trigila; C. Iadanza; B. Lastoria; M. Bussettini; A. Barbano, «Dissesto idrogeologico in Italia: pericolosità e indicatori di rischio – Edizione 2021,» ISPRA, Roma, 2021.
[40] A. Abbate, Hydrogeological hazards evaluation under climate change scenarios : an application of the CRHyME model (Climatic Rainfall Hydrogeological Modelling Experiment), Milano: Politecnico di Milano, 2022.
[41] D. Varnes, «Slope movement types and processes,» Special Report, vol. 176, pp. 11-33, 1978.
[42] G. Ciccarese, M. Mulas, P. P. Alberoni, G. Truffelli e A. Corsini, «“Debris flows rainfall thresholds in the Apennines of Emilia-Romagna (Italy) derived by the analysis of recent severe rainstorms events and regional meteorological data”,» Geomorphology, n. doi: 10.1016/j.geomorph.2020.107097, p. p. 107097, Jun. 2020.
[43] G. Ciccarese; M. Mulas; A. Corsini, «Combining spatial modelling and regionalisation of rainfall thresholds for debris flowhazrds mapping in the Emilia-Romagna Apennines (Italy),» Landslides, vol. 18, pp. 3513-3529, 2021.
[44] Y. Ge et al., «A comparison of five methods in landslides susceptibility assessment: a case study from the 330kV transmission line in Gansu Region, China,» Environmental Earth Science, vol. 77, n. 19, p. 662, 218.
[45] V. Vakhshoori e M. Zare, «Is the ROC curve a reliable tool to compare the validity of landslide susceptibility maps?,» Geomatics, Natural Hazards and Risk, vol. 9, p. 249–266, January 2018.
[46] D. Jacob, «EURO-CORDEX: new high-resolution climate change projections for European impact research,» Regional Environmental Change, vol. 14, n. 2, pp. 563-578, 2014.
[47] J. Corominas; J. Moya, «A review of assessing landslide frequency for hazard zoning purposes,» Enginnering Geology, vol. 102, n. 3, pp. 193-213, 2008.
[48] JRC – European Joint Research Centre, «The European Fire Database Technical specifications and data submission,» 2014.
[49] J. San-Miguel-Ayanz, T. Durrant, R. Boca, P. Maianti, G. Libertá, D. Oom, A. Branco, D. d. Rigo, D. Ferrari e D. Roglia, «Advance report on Forest Fires in Europe, Middle East and North Africa 2022,» Publications Office of the European Union, Luxembourg, 2023.
[50] P. Faggian, «Estimating fire danger over Italy in the next decades,» Euro-Mediterr J Environ Integr, n. https://doi.org/10.1007/s41207-018-0053-1, 2018.
[51] M. Moritz, M. Parisien, E. Batllori, M. K. MA, J. V. Dorn, D. Ganz e K. Hayhoe, «Climate change and disruptions to global fire activity,» Ecosphere, n. https ://doi.org/10.1890/es11-00345 .1, pp. 1-22, 2012.
[52] M. Turco, M. Llasat, J. V. Hardenberg e A. P. A, «Climate change impacts on wildfires in a Mediterranean environment.,» Climate Change, vol. 125, p. 369–380, 2014.
[53] C. Van Wagner, «Development and structure of the Canadian Forest Fire Weather Index System,» Canadian Forestry Service, 1987.
[54] Copernicus, « Copernicus,» [Online]. Available: https://browser.dataspace.copernicus.eu/.
[55] C. Van Wagner; T. Pickett, , «Equations and FORTRAN program for the Canadian Forest Fire Weather Index System,,» Forestry technical report, vol. 33, 1985.
[56] EFFIS, «Data and Services,» 2024. [Online]. Available: https://forest-fire.emergency.copernicus.eu/applications/data-and-services.