Performance of overhead line insulation in DC differs from AC mostly because of ionization of the airborne particles that result from the unidirectional electric field. Contamination levels in DC are therefore typically more severe than for AC, even in the same service environment. In fact, CIGRE and IEC have both published technical guides and mathematical models to account for this phenomenon when designing insulation for a DC line.
This edited contribution by J.M. George, E. Brocard, D. Lepley and F. Virlogeux of Sediver compares insulation levels defined by these models with actual observations from the field as well as results of laboratory testing. The authors argue that the differences identified underline the need for further evaluation of these models which, given their highly conservative nature, could lead to string lengths that are over dimensioned for the application.
Review of Key Parameters
Pollution Severity
Pollution deposits on the surface of an insulator are classified by Equivalent Salt Deposit Density (ESDD) as well as Non-Soluble Deposit Density (NSDD). Both are important parameters. ESDD level contributes to higher conductivity of the water on the surface of an insulator and increased leakage current; NSDD acts like a sponge sucking moisture during morning dew or fog events, thereby providing water to the leakage current and dry band arcing mechanism.
Moreover, contamination deposits in the field are usually not homogeneous, such that bottom surfaces of an insulator are typically more polluted than the top surfaces. CUR, defined as the ratio of bottom to top ESDD level, is the parameter that describes this property. For practical reasons, CUR in laboratory testing is often set at 1 and thereby provides more severe conditions than with a higher CUR value. Other parameters also play a role, including shape and dimension of an insulator, altitude, polarity and dynamics of the pollution deposition process. These are all clearly explained in relevant industry documents such as CIGRE C4.303-TB518, (Outdoor insulation in polluted conditions. Guidelines for selection and dimensioning. Part 2. The dc case) and IEC TS 60815-4 Edition 1.0 2016-10 (Selection and dimensioning of high voltage insulators intended for use in pollution conditions. Part: insulators for dc systems). The focus of this discussion is on determining required leakage distance of a string of insulators based on CUR, ESDD and NSDD.

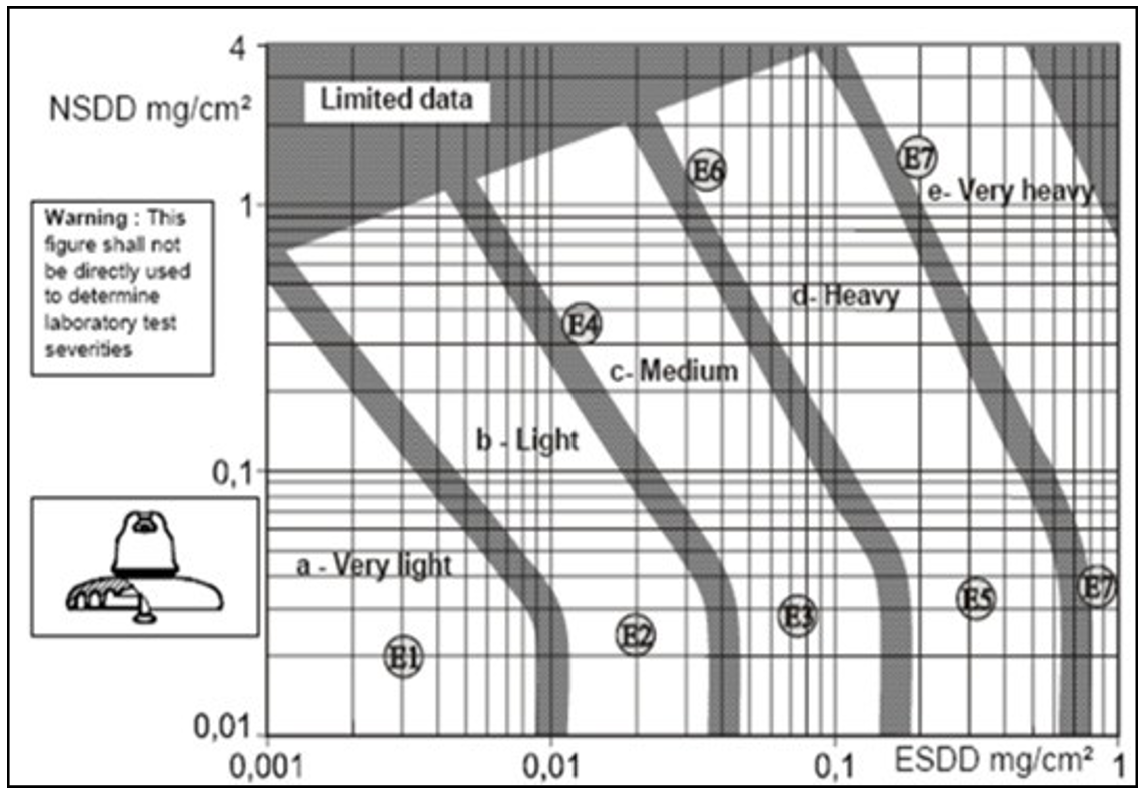
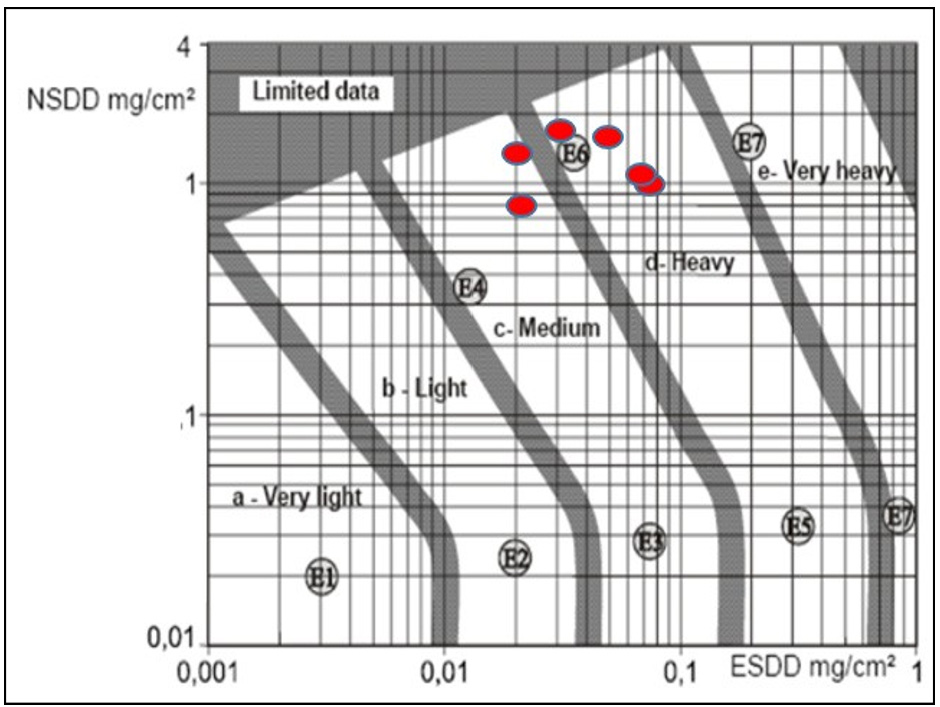
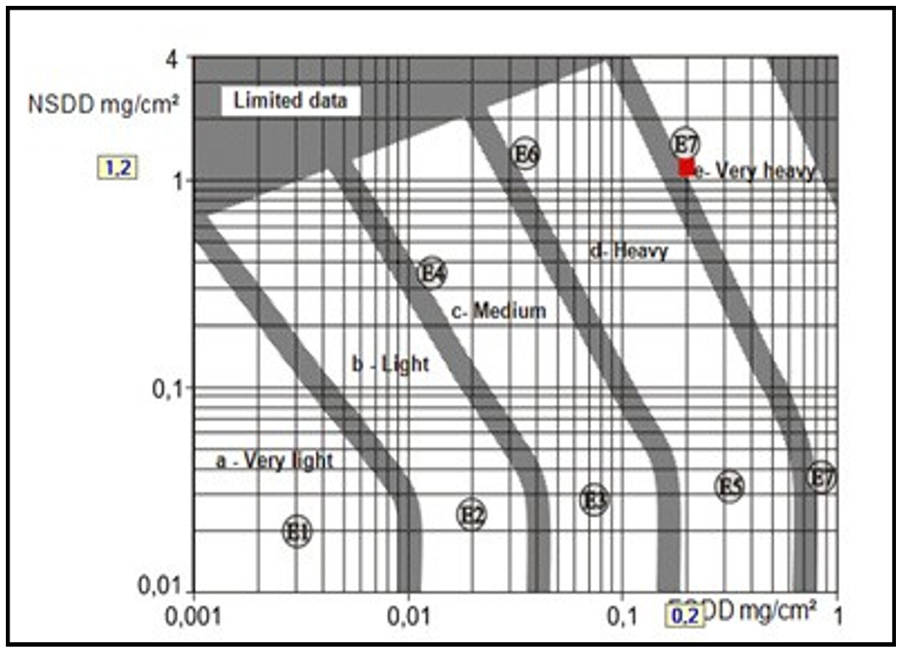
Contamination severity in any given environment is classified from very light to very heavy (see Fig. 1). Specific creepage distance is then determined to avoid insulator flashovers under the appliable pollution conditions. An important element in this discussion is Reference Unified Specific Creepage (RUSC) distance, defined as minimum calculated USCD. Once this is known, insulator design (e.g. from a supplier catalogue) and number of insulators required in the string can be selected.
Example of String Design Based on Theoretical Approach Described in (1) and (2)
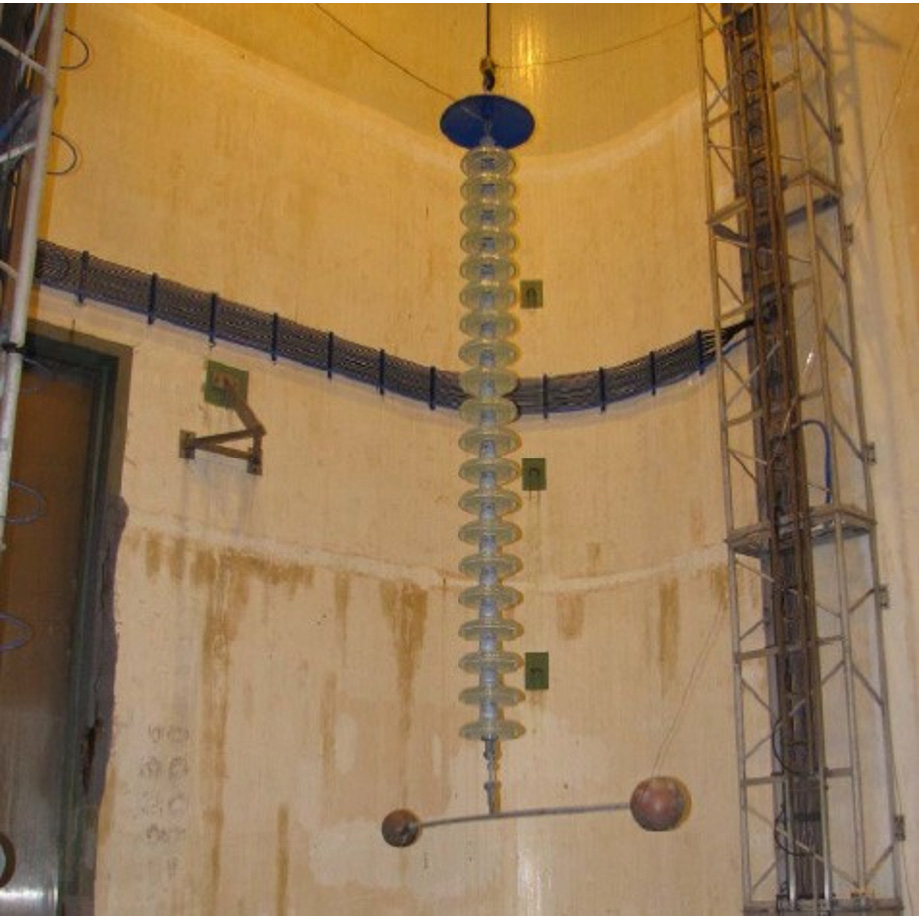
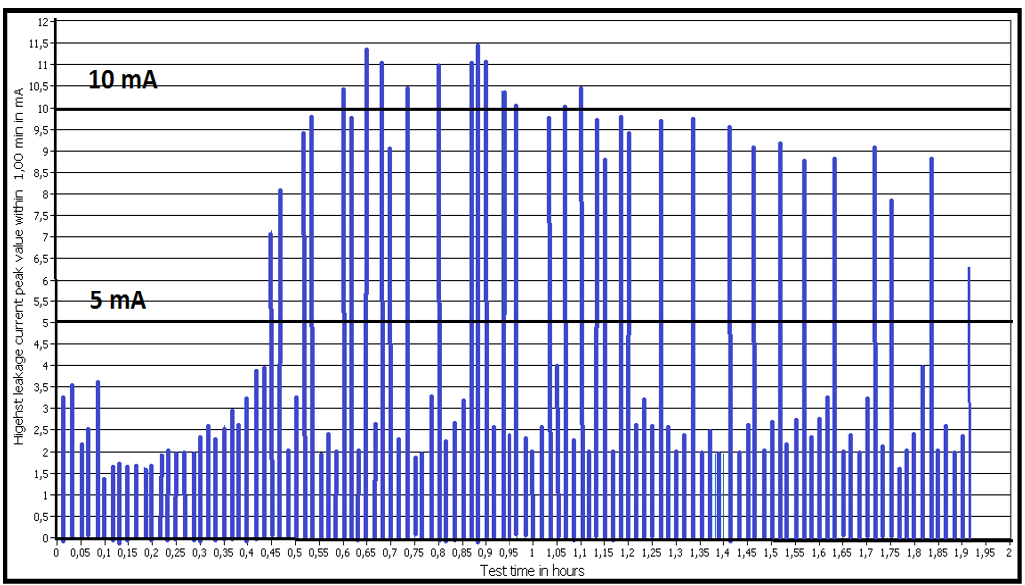
The following example illustrates possible discrepancies between results from the theoretical method and those obtained from laboratory testing. A 300 kV dc string of 20 toughened glass DC units having an individual leakage distance of 550 mm was tested under artificial pollution conditions established at ESDD=0.047mg/cm² and NSDD=0.1mg/cm² (see Fig. 2). This translates into a USCD=36.6 mm/kV. According to [1] and [2], theoretical RUSC for this environment would be 44.8 mm/kV. Performance of the string was excellent with leakage current peaks around 10 mA (see Fig. 3).
The difference of 20% is likely highly conservative given the low currents measured during the test. It therefore seems reasonable to conclude that the model did not accurately describe pollution performance of that DC string. If such a line were to be designed based only on the calculation method, over design of the string would likely generate unnecessary incremental costs. Based on this example, there is already reason to believe that the model needs to be reviewed and challenged against additional such testing and field evaluation.

Field Performance & Laboratory Testing
Several actual DC lines were evaluated and their real pollution levels measured by sampling site ESDD and NSDD levels. This information was then used in the theoretical model to determine expected USCD. Moreover, laboratory tests were then performed on the actual insulator string to determine flashover values.
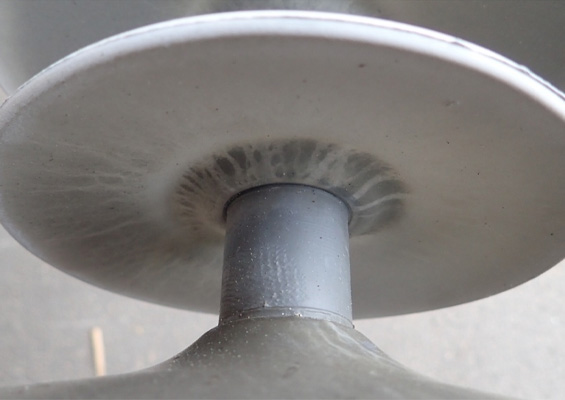
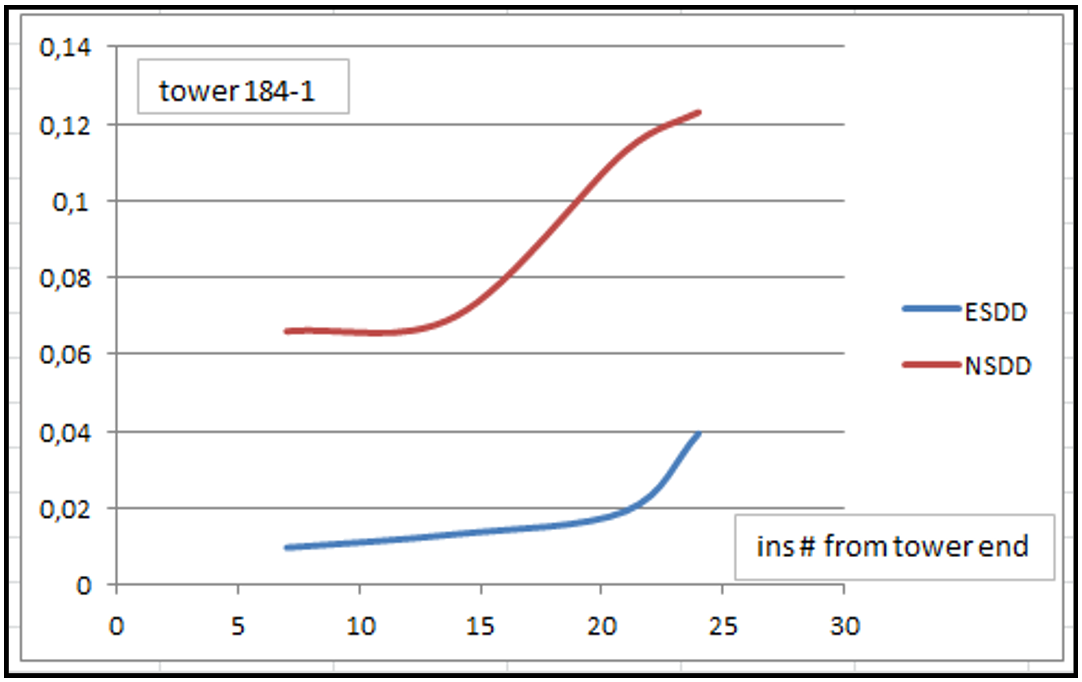
Fig. 4, for example, shows the non-uniform pollution distribution on insulator strings of a 500 kVdc line which did not experience pollution problems over more than 40 years of service in a desert environment. This line was designed with a USCD of 25 mm/kV.
In this case, the theoretical model would recommend using at least 42 mm/kV considering uniform contamination along the string with ESDD=0.04 mg/cm², NSDD=0.1 mg/cm² and CUR=1.
A laboratory artificial pollution test was performed on toughened glass dc insulators selected during a voltage upgrade of this line. The string was set with USCD= 23 mm/kV and tested with the same conditions as used earlier for the theoretical estimation (i.e. ESDD=0.04 mg/cm², NSDD=0.1 mg/cm² and CUR=1). Maximum current during this test sequence was 60 mA.
Another test was conducted with ESDD=0.07 mg/cm² and NSDD=0.1 mg/cm². Now, maximum leakage current recorded was 100 mA but still without flashover. Yet under these same conditions, the theoretical model would recommend a string with USCD= 51 mm/kV, twice what was tested. Even if accounting for possible non-linearity between short and full-length strings (since the test involved short strings), this discrepancy calls results predicted by the model into question.
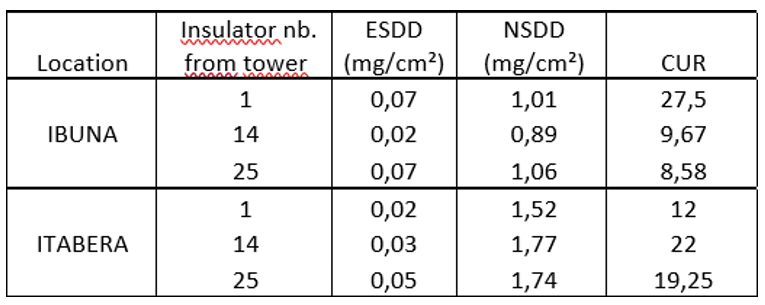
Another example comes from the 600 kVdc Itaipu line in Brazil., where several strings were removed from bipole 2 for evaluation. Actual USCD for this line is 28.5 mm/kV and pollution levels are classified as “heavy” due to agricultural and industrial pollution near the city of São Paolo. (see Fig. 5). Table 1 provides the applicable CUR ratios. While the utility’s Maintenance Department ensured that there were no line interruptions related to regional pollution, the theoretical model would have predicted intense flashovers unless the strings were re-designed with a USCD of at least 47 mm/kV. Although in this case the CUR level is outside the classical range considered in the model’s design (typical CUR range in the model is CUR< 10), this finding again highlights the possible limits and inaccuracies of the mathematical approach.

Mitigation of Severe Pollution
Most dc lines are built in relatively clean environments, although there are exceptions such as lines located in urbanized and industrial areas of China or along coastlines in places such as Italy and New Zealand. Nonetheless, it is clear that, even in clean areas, the electrostatic effect of a dc line will attract more airborne pollution than an AC line in the same location. The challenge for dc lines in higher contamination areas is therefore even more critical.
Application of polymer insulators is sometimes considered under these service conditions, mostly in China and less so elsewhere. This is because of lack of consensus and standards describing maximum stress levels on the silicone housing and seal for dc applications. In fact, several cases have been reported of early degradation of the polymer housing or seals. This suggests a more cautious approach may be required for polymers in DC when comparing pollution performance and accelerated ageing.
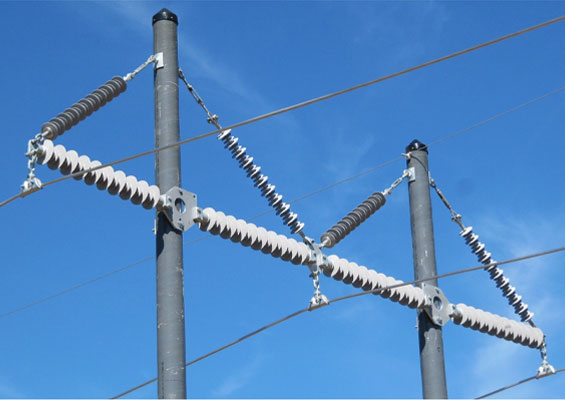
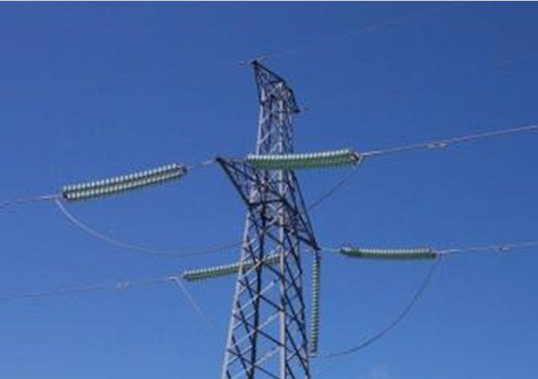
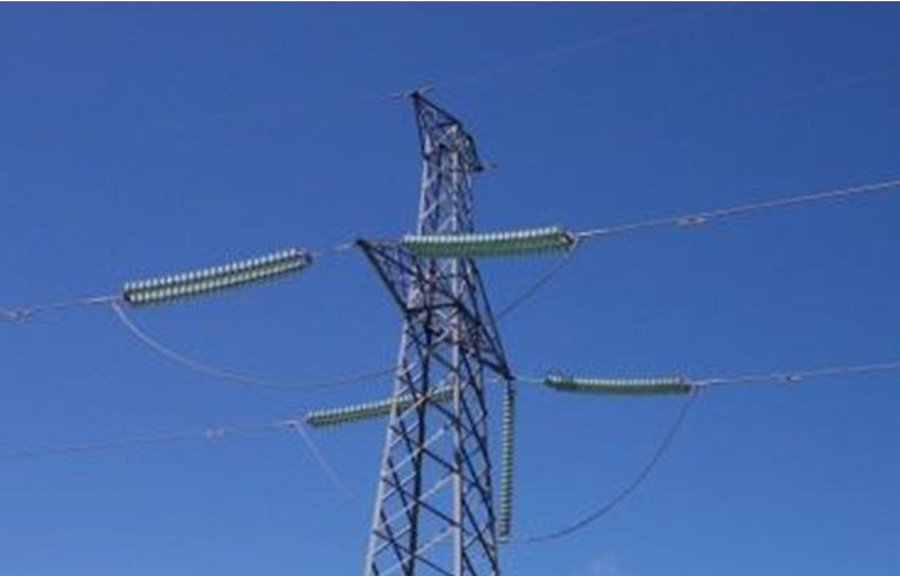
One solution in such cases is specifying a silicone coating applied on the surface of traditional glass or porcelain insulators. China, for example, is now moving in this direction, as illustrated by the Ximeng-Taizhou-Shanghaimiao-Shandong 800 kVdc line currently under construction, where hundreds of thousands of factory pre-coated toughened glass insulators are being applied. There are also other examples of the success of this solution, including by Terna in Italy where such insulators are applied on a 200 kVdc line in Tuscany and Sardinia (see Figs. 7 & 8). This has eliminated need for washing for at least 5 years, even in areas of very heavy pollution, when in the past this was regular practice.
A pollution test aimed to compare pre-coated toughened glass and polymer insulators under salt fog conditions for coastal applications. The results, summarized in Fig. 9, illustrate the benefits of a silicone coated classical glass string versus a composite silicone housed insulator.
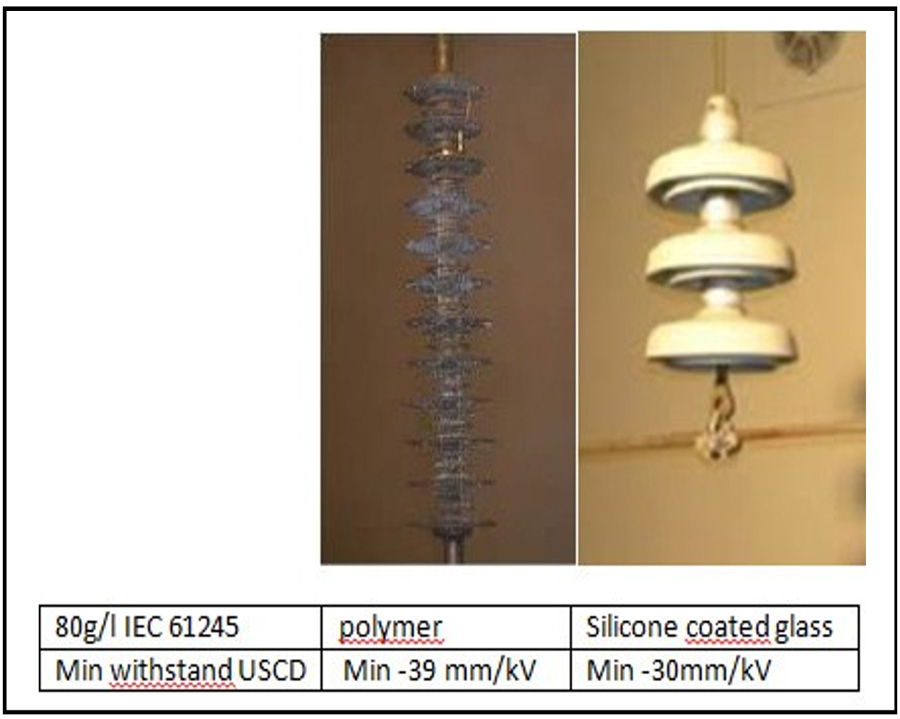
These results illustrate the difficulty in coming up with a general performance statement without actual testing. In this case, both test objects are hydrophobic materials and their respective leakage distances were equivalent during testing. But material and shape matter as well.

Conclusions & Future Direction
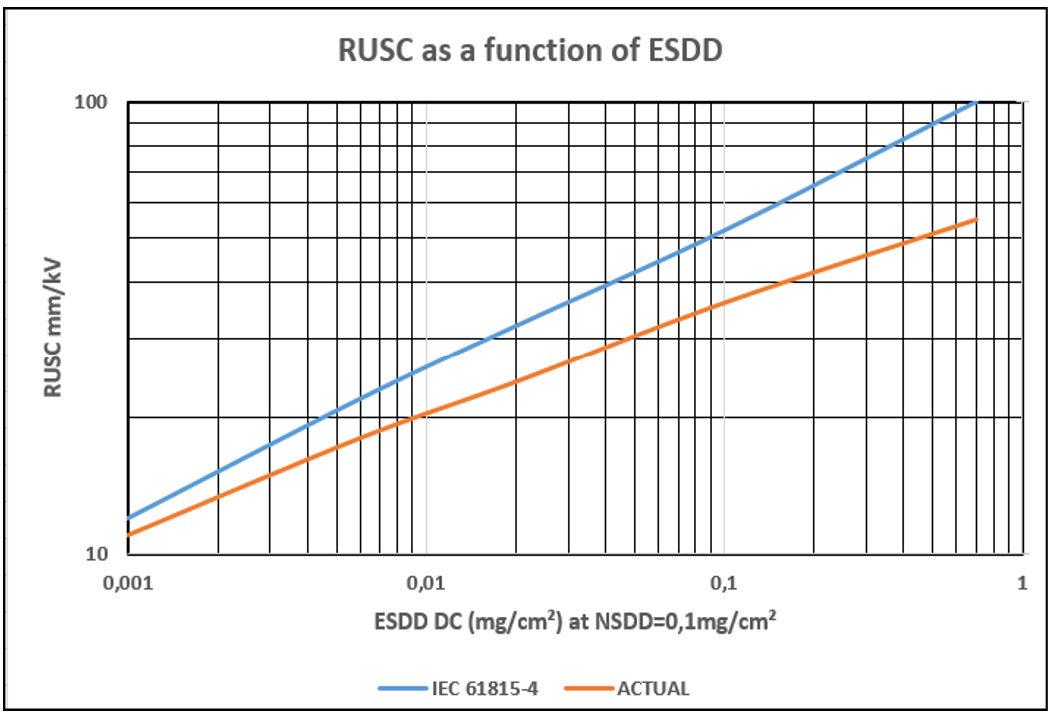
Potentially large inconsistencies between laboratory testing, field performance and theory all highlight the need to produce an actual design test for any given project instead of relying mainly on a theoretical set of equations as now found in various documents. Fig. 10, for example, illustrates possible margin of error in the theoretical evaluation of the RUSCD versus laboratory or field performance. This graph needs further test results to fine tune the reference to an RUSC.
Potential errors using a mathematical model alone can lead to overdesign by 20% to 30% or greater, with such incremental costs as to make a new line design unacceptable to the utility. More pollution tests in dc are required to better document actual performance.
Similarly, most laboratories conduct tests only with CUR=1 whereas, in reality, this parameter can vary between 3 and 5 and sometimes even up to 7. There is a need to better define contamination deposition methods to consistently duplicate such variable CUR levels and better simulate actual field conditions without overreliance on theoretical correction factors.
1. CIGRE C4.303-TB518, Outdoor insulation in polluted conditions. Guidelines for selection and dimensioning. Part 2. The dc case
2. IEC TS 60815-4Edition 1.0 2016-10Selection and dimensioning of high voltage insulators intended for use in pollution conditions. Part : insulators for dc systems
3. INMR2015. JM George HVDC insulators
4. Condition Assessment of Cahora Bassa Insulators Removed during Reinsulation of the Line: Preliminary Results. Nalomo, Ntshani and Mahatho, ESKOM CIGRE South Africa 2015
5. INMR 2015. A Pigini Design and testing of polymeric insulators to verify the pollution performance under dc voltage
6. IEEE International Conference on Solid Dielectrics, Bologna, Italy, 2013. Marzinotto at all. DC-toughened glass insulators pre-coated with RTV silicone rubber- field returns from aged samples installed on HVDC lines
[inline_ad_block]