There are more than 40 million composite insulators currently in service on overhead lines worldwide, proving that this technology has become equally valid to traditional cap & pin strings or porcelain long rods. Still, not all power system operators are fully up-to-date on key issues such as specification, testing and condition assessment.
Findings from earlier projects on behalf of a Consortium of European power utilities promoted improved selection of composite insulators by addressing questions such as:
• How should these insulators be selected?
• How can their manufacturing process be effectively monitored?
• What are best practices for handling during storage and installation?
At the same time, many power system operators across the globe already have composite type insulators in service on their overhead lines and at substations. Several additional questions remain:
• How should service experience be collected and analysed to inform appropriate maintenance actions?
• What types of maintenance are required for composite insulators?
• How can remaining service life be evaluated, and what corresponding actions should be taken?
This edited contribution to INMR by I. Gutman, J. Lundengård (I2G, Sweden) of the Independent Insulation Group in Sweden addresses some of these remaining issues.
Asset Management (AM) refers to structured decision-making and execution of maintenance plans aimed at optimizing utilization of assets that collectively comprise the grid. While the principles of AM are established, a detailed approach—including how performance, effort and risk of failures are balanced—varies by utility according to its values, circumstances and, most important, the particular asset in question.
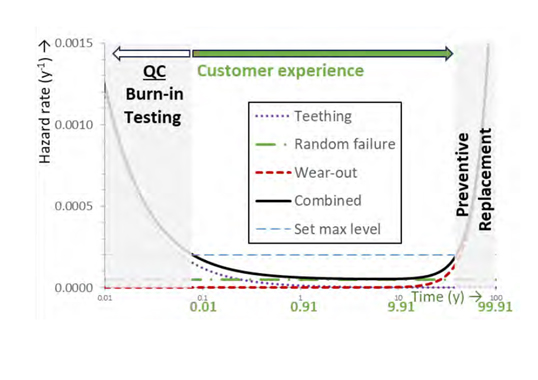
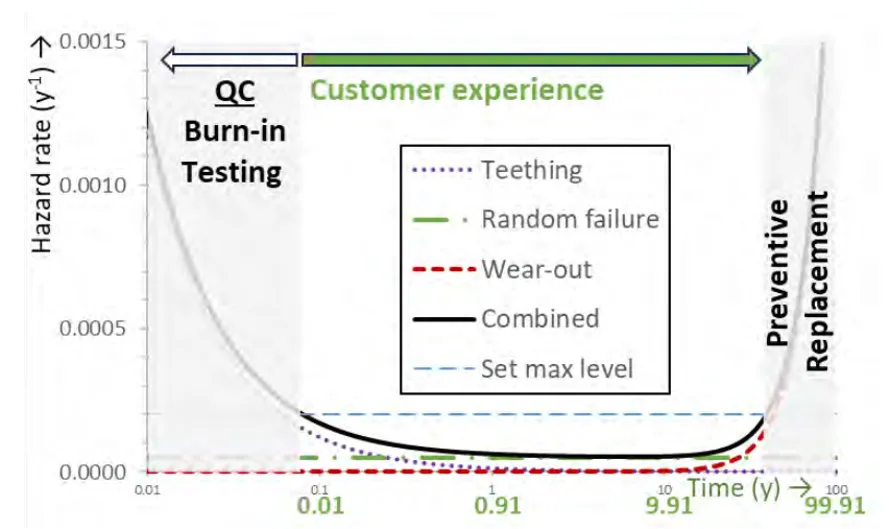
Failures are typically categorized into 3 classes based on the time derivative of their hazard rate (h): teething failures (declining h), random failures (approximately constant h), and wear-out failures (increasing h), as illustrated in Fig. 1.
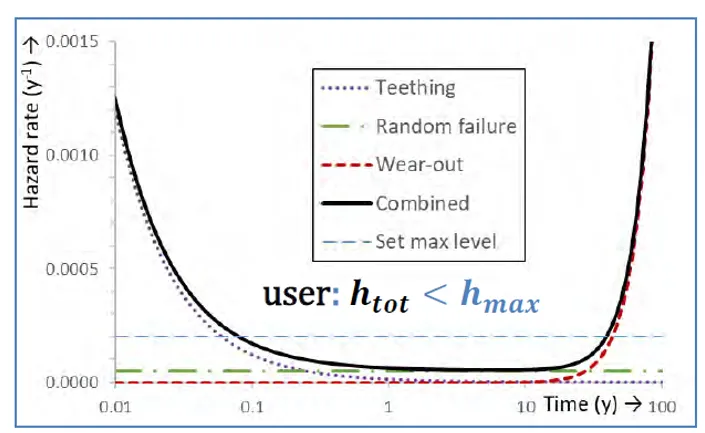
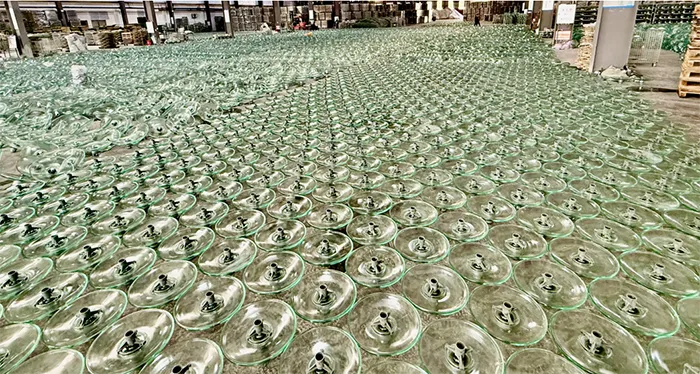
Teething is sometimes referred to as a child disease or mortality. It describes phenomena that are mostly prominent at early stages of operation but diminish over time. A classic example in the context of insulators is the practice of storing glass cap & pin discs prior to delivery. This allows time for self-shattering of the toughened glass caused by minor manufacturing defects before these are put into service.
A good example in the case of composite insulators is stricter quality control via Factory Acceptance Tests and expanded sample testing. These promote reduced teething failure rate also referred to as “burn in testing”.
Random failures are characterized by a steady hazard rate, meaning that failure rate is independent of operational life of equipment. These typically arise from external influences, such as environmental factors or operational conditions, e.g. a salt storm leading to an instantaneous pollution event and flashover or extreme lightning activity. While such failures are considered “bad luck,” they are not entirely beyond the control of the utility. In fact, constant hazard rate can be mitigated by implementing protective countermeasures.
Wear-out is characterized by increasing hazard rate, meaning that failures of surviving components culminate to an end-of-life of the entire batch. Failures start to succeed one another faster and could provoke an overwhelming logistical replacement wave. Often, utilities set hazard rate limits and replace equipment earlier to prevent overloading repair crews and interruption of power supply.
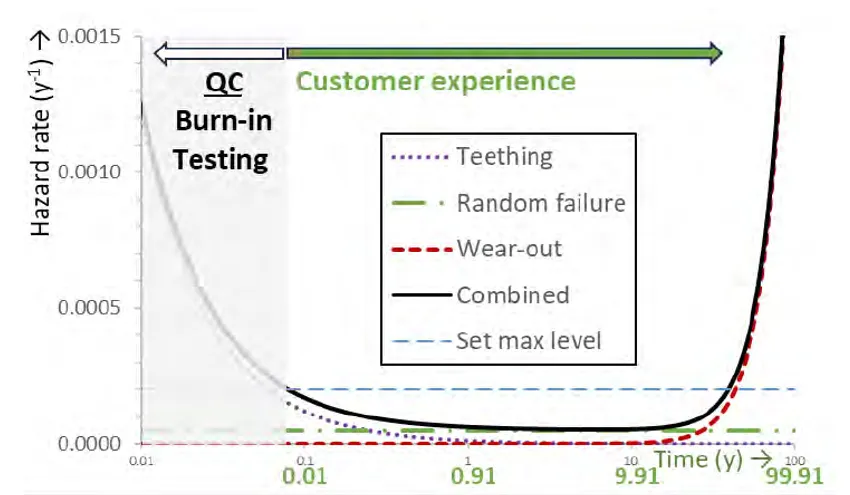
The bathtub curve in Fig. 1 is a general and objective description but does not need to turn into a destiny that every utility must endure. With quality control in place, the bathtub will change, as in Fig. 2. Firstly, inferior products are blocked from delivery and this done by a burn-in or pre-ageing process at the manufacturer’s facilities, followed by testing. A user may have the impression there was no teething when in fact that process is masked by quality control such that only high quality products are delivered.
Wear of composite insulators causes their hazard rate to increase, which may in turn exceed the maximum allowable limit for failures. Two approaches can apply:
1. Run to Failure, which means acceptance that assets will fail. This is the foundation of Corrective Maintenance: once a component fails, it is replaced or repaired which corrects the faulty situation. An argument for this approach can be that failure may not interrupt strategic functionality due to redundancy. Another reason can be that there is no viable alternative. The customer does experience higher wear rate, as in Fig. 2, but this is part of an accepted maintenance strategy.
2. A preferable alternative is Preventive Replacement: before the hazard rate exceeds the limit, the respective assets are replaced (see Fig. 3). Moment for replacement can be determined by pre-set planning (e.g. after some defined number of years) or by assessed condition (Inspection-Based Maintenance). Product life cycle is shortened but failures are prevented. This lowers cost of emergency repair and collateral damage.
To enable timely and effective preventive maintenance, insulators must be either visually inspected or evaluated through condition assessment methods based on after-service testing. These inspections should follow an inspection-based maintenance strategy that prioritizes reliability and operational safety.
To ensure cost-efficiency, the test matrix used for condition assessment should be optimized, balancing cost constraints with the need to gather data critical for informed maintenance decisions.
An optimal test matrix (as part of the preventive maintenance) is proposed that minimizes testing costs while maximizing relevance and usefulness of diagnostic data for practical maintenance planning.

Overview of Test Program
Insulator Test Array
All participating utilities contributed different insulators to an overall number of 33. This test array covered a broad variation of parameters:
• 8 different designs (manufacturers), including standard, alternating and under-rib shed profiles, different design of fittings and sealings, etc.;
• Line suspension insulators, interphase spacers and two station support insulators;
• Different time in service (up to 42 years with the oldest having up to 55 years’ service);
• Different housing materials, i.e., high temperature vulcanized (HTV) silicone rubber, room temperature vulcanized (RTV) silicone rubber, liquid silicone rubber (LSR), and EPDM, as confirmed by data from manufacturers;
• Different voltage classes, i.e., Um 123 kV, 145 kV, 245 kV and 420 kV;
• Different mechanical classes, i.e., SML between 100 kN and 400 kN.
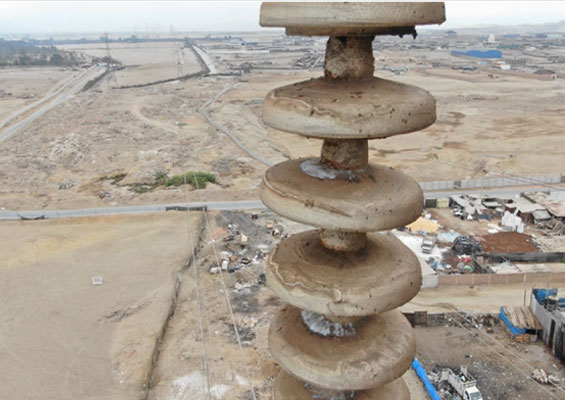
These insulators were removed based on indications from service performance, and as such, likely over-represent insulators of poor quality. Several were delivered in pieces due to brittle fracture or flashunder during service, as in Fig. 4.
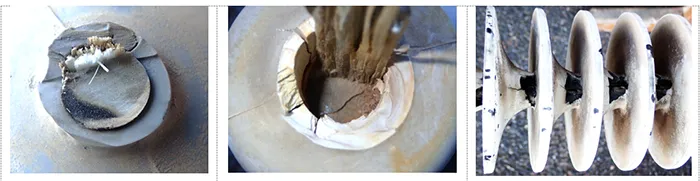
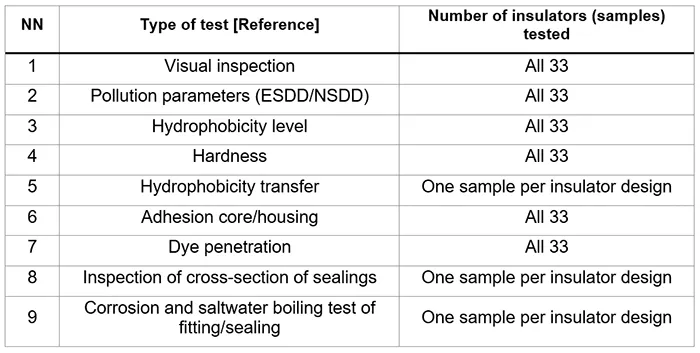
Table 1 presents the test program.

Test Methods & Results
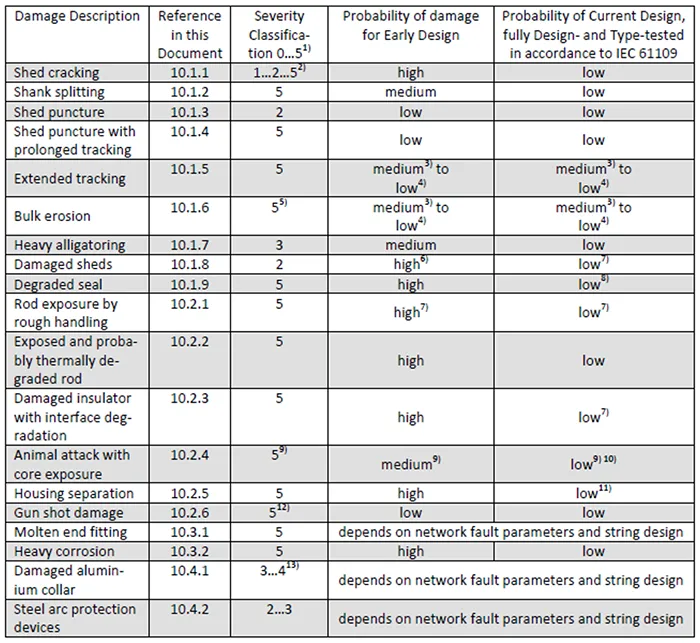
A CIGRE Guide was applied although it is worth noting that this Guide is not a definitive tool for evaluation or classification since it involves subjective judgment and relies on expert interpretation. For example, shed cracking can be classified anywhere from severity Class 1 to 5 depending only on the assessor’s perspective (see Fig. 4).
Most of the degradation observed was superficial in nature and indicated that the housing material had not undergone significant ageing—even after up to 40 years of service. Deteriorations typically included:
• Pollution of varying degree;
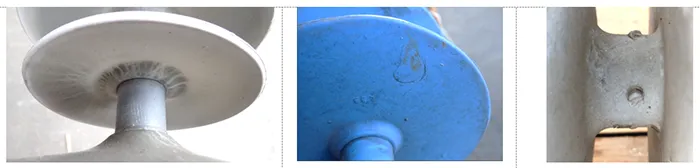
• Indications of surface leakage current activity (see Fig. 6, left);
• Biological growth of varying degree;
• Local shed inhomogeneities (see Fig. 6, middle);
• Paint drops (splatters);
• Evidence of sub-optimal quality concerning mould lines and injection points. These are considered minor quality control issues see Fig. 6, right);
• Potential onset of sealing layer peeling.
By contrast, below are examples serious forms of insulator deterioration observed. These could necessitate their removal during the next planned outage:
• Significant deterioration of sealing of one design. The corresponding utility is already aware and has implemented a special monitoring program using visual and infrared inspection to identify and continually replace the most degraded units;
• Numerous cracks in the housing or water absorption without cracks for the batch of another design. These cracks are a known issue for this design and potentially the reason for its discontinuation;
• One design experienced bird pecking through the silicone housing, exposing the core. Based on experience, if core integrity and adhesion between core and housing remain good, such insulators might still operate reliably for 1 to 2 years, especially in low pollution environments.
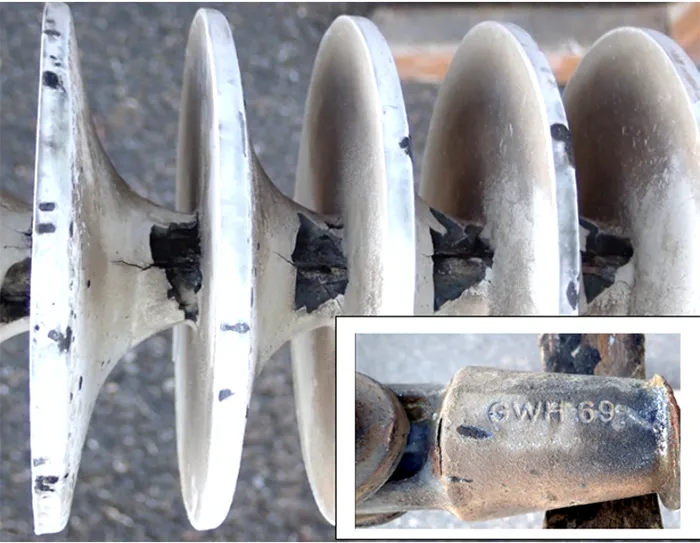
The Rosenthal (now Lapp) insulator, which experienced flashunder after 42 or maybe even 55 years in service. According to experts, such insulators were manufactured before 1975 however, in some cases until 1982. This was a first-generation composite insulator with a highly specific technology and several weaknesses that were resolved in subsequent generations.
A visual inspection is essential as the initial step in any test matrix. If no issues are observed during visual inspections, a basic test matrix should be applied as a preventive measure. Tests included are detailed further below, based on after-service test results from this and previous projects as well as established service experience. If visual observation indicates potential weaknesses, tailored test matrices can be developed to investigate these areas. The purpose of these is to verify any suspected issues and identify the root cause of deterioration or damage.
Pollution Parameters
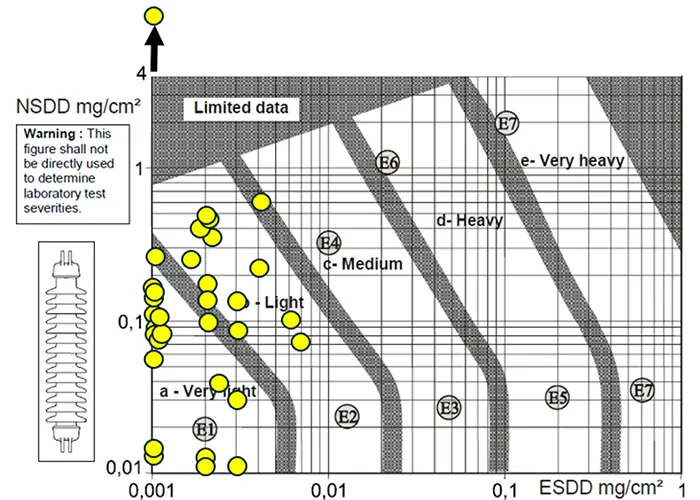
Salt Deposit Density NSDD (non-soluble part of contamination) was measured according to IEC 60815-1, Annex C. ESDD/NSDD measurements were taken conservatively from the complete top and bottom area of a shed close to the HV fitting and then averaged.
Results are plotted in Fig. 8. Adopted from IEC/TS 60815-1, this type of chart is formally for porcelain long rod insulators and can thus be used only as an indication for composite insulators. These did not differ much in terms of design, manufacturer or time in service. Basically, all measurements indicated that these insulators were in “Very Light” to “Light” Site Pollution Severity (SPS) classes (“Light” to “Medium” using conservative approach plus one SPS).
Using their creepage distance, all insulators were dimensioned for “Medium” or even “Heavy” SPS, providing a good margin in performance. It should be noted that IEC 60815-1 requires a minimum of 12 measurements per year to establish SPS. As such, these results are only indicative and represent a ‘snapshot’ of time.
Such a test is not essential for inclusion in the basic test matrix since available service experience with composite insulators indicates that pollution performance is of secondary importance compared to potential manufacturing deficiencies. However, it becomes crucial in a tailored test matrix where insulators operate in heavily contaminated environments or show signs of flashover or leakage current.
In such cases, it provides a valuable baseline to assess the condition of all types of insulator, and enables a preliminary estimation of environmental pollution severity, which is critical for evaluating the external stress factors that can affect them. Comparing an insulator’s geometric characteristics—particularly creepage distance—with estimated pollution severity, allows assessing the electrical stress to which an insulator is subjected during operation.
Hydrophobicity Level
Hydrophobicity Class was evaluated using standard Spray Method C in IEC 62073. Appearance of the insulator surface after mist exposure was assigned to one of 7 Hydrophobicity Classes (HC), whereby a surface with HC1 is the most hydrophobic, and a surface with HC7 the most hydrophilic. It is important to stress that HC evaluation depends on experience of the observer. To an inexperienced observer, typical outputs would be ‘hydrophobic’, ‘hydrophilic’ or ‘somewhere in-between’, which may be enough for rough evaluation of hydrophobicity at the insulator surface.
HC measurements were taken from the top, middle and bottom of sheds (averaged for top/bottom of sheds in each of three locations) along the insulator. Fig. 9 presents a summary of results. This parameter evaluates only the polluted surface of the insulation material and does not indicate what is going on inside the pollution layer or polymeric material (hydrophobicity transfer capability).
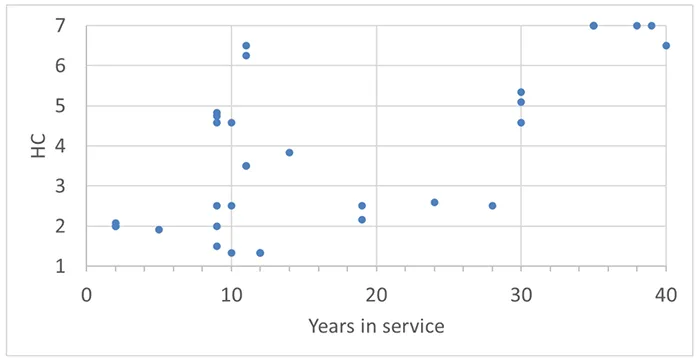
Data presented is purely indicative since reduction of hydrophobicity was neither complete nor uniformly distributed along the full surface of the silicone insulators. Moreover, there was no clear trend observed for hydrophobicity reduction (i.e. increase in HC) over time in service. As discussed, the Hydrophobicity Transfer test is considered more valuable and significant for a tailored test matrix than is HC classification alone.
Hardness
A hardness test was performed on samples according to IEC 62217 before and after 48h immersion in boiling water, i.e. slightly longer than the 42h specified in the standard. Average hardness after boiling must not differ by more than ± 20% from the average for non-boiled samples. For each insulator, 10 measurements were performed, either on top and bottom or middle and bottom, thus covering all different positions along the sample.
Fig. 10 offers a summary of results. All insulators passed by a significant margin, ranging from 0.1% to 12.5% compared to the 20% criterion.
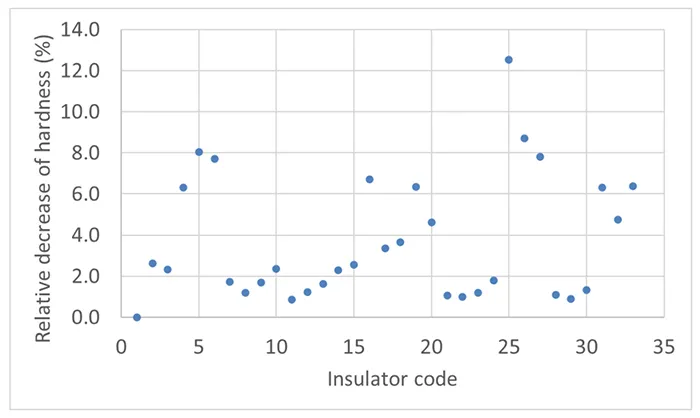
This test can be excluded from the basic test matrix but may be relevant in specific cases for the tailored matrix, e.g., if visual inspection during service indicates that certain insulators have become rigid or brittle. Such changes have been observed in industrial environments and can be identified subjectively by touching the insulator or bending a shed. In these cases, this test can help to quantitatively verify potential surface degradation and will have greater value if compared to a new, unaged sample of the same insulator.
Hydrophobicity Transfer
A Hydrophobicity Transfer HT Test (previously known as the Dynamic Hydrophobicity Test) was also conducted. Compared to testing new samples, the only modification saw gentle cleaning of service-aged samples prior to testing to remove natural pollution. The principle behind the HT test is that Low Molecular Weight (LMW) components—which are key to the hydrophobic properties of a material—migrate into the pollution layer and encapsulate any surface salts. This migration leads to a gradual increase in the electrical resistance of the pollution layer, even if hydrophobicity has not yet fully recovered at the surface. Such behaviour is often observed for insulators operating in contaminated environments and has been corroborated through both visual inspections and electrical measurements. Monitoring the resistance increase of the polluted layer over time allows an insulator’s hydrophobicity transfer ability to be assessed. Fig. 11 illustrates the typical increase of surface resistance for a single test series.
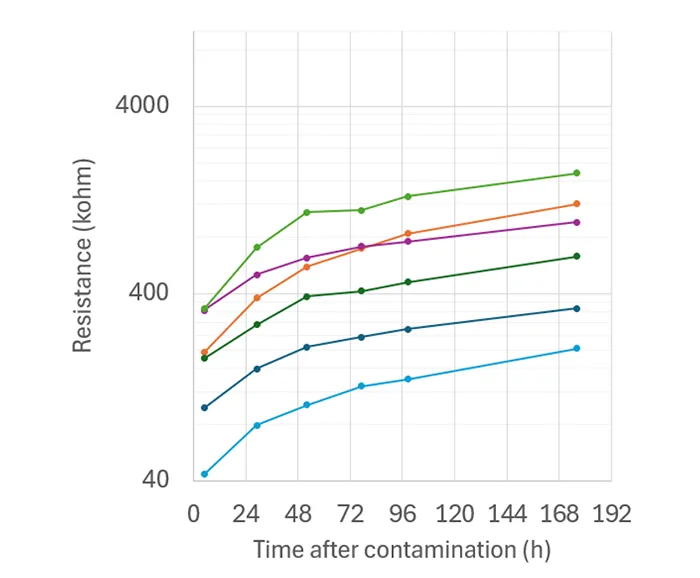
The HT test is evaluated using the R168/R0 ratio, representing the resistance at the end (R168) versus that at the start (R0) of the test. Results are presented in Fig. 12. Results correspond with general insulator knowledge. HTV materials have a slightly lower rate of hydrophobicity transfer over time compared to LSR materials. Also, there is no transfer of hydrophobicity in EPDM or EPDM alloy materials.
It is important to emphasize that many designs of line composite insulators these days have an HTV silicone housing. This preference is based on industry knowledge that highlights that these materials offer two defense mechanisms against deterioration: sustained hydrophobicity and superior resistance to tracking and erosion. By contrast, LSR relies on a single defense mechanism – its ability to retain hydrophobicity.
Results demonstrated that silicones continue to generate LMW components even after 30 to 40 years in service and that there is no definitive end-of-life for their ability to sustain hydrophobicity through their migration. At the same time, variability in results can be significant due to differences in specific material composition. To properly assess possible reduction in hydrophobicity transfer capability, it is preferable to use a new non-aged reference insulator from the same manufacturing batch.
This type of test is particularly useful for customizing a test matrix (i.e., for tailor matrix), e.g. when an insulator shows signs of heavy contamination, evidence of leakage current or pollution flashovers. Another reason to perform this test is extended service duration; evaluating insulators that have been in operation for over 30 years can provide insight into long-term ageing.

Core to Housing Adhesion
This test comprises a water diffusion phase followed by a mechanical pull-off test and the methods and acceptance criteria developed by Consortium participants have become internationally recognized. They are now included in the latest revision of IEC 61109—specifically in Clause 9.2.4 and Annex F—with cross-reference to the upcoming version of IEC 62217 for the water diffusion phase.
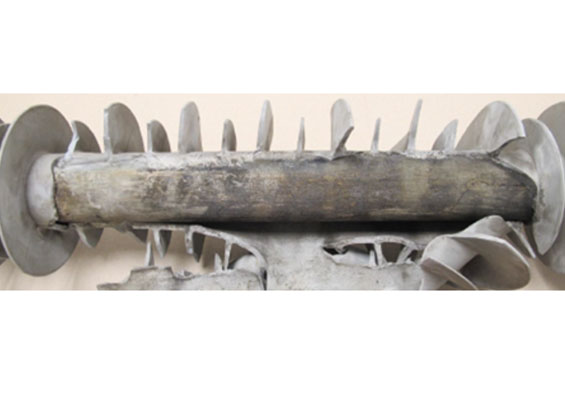
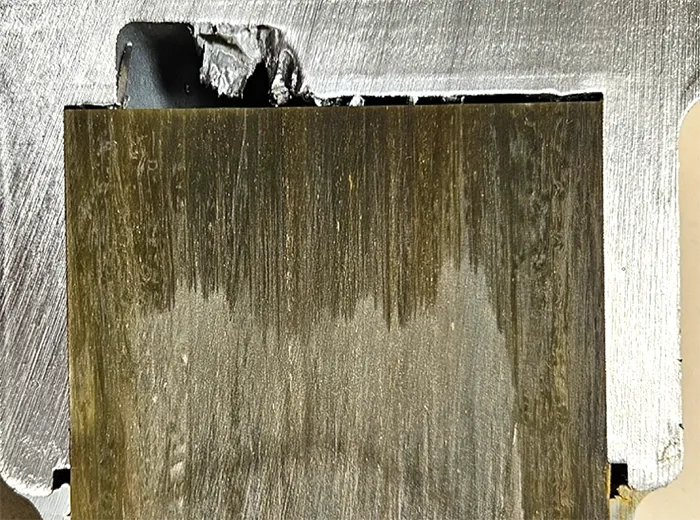
Test specimens are approximately 30 mm in length, consisting of both core and housing, including a single shed. The water diffusion test involves 100h of boiling (pre-stressing), followed by a voltage test with current measurement and concludes with a mechanical pull-off test (as shown in Fig. 13).
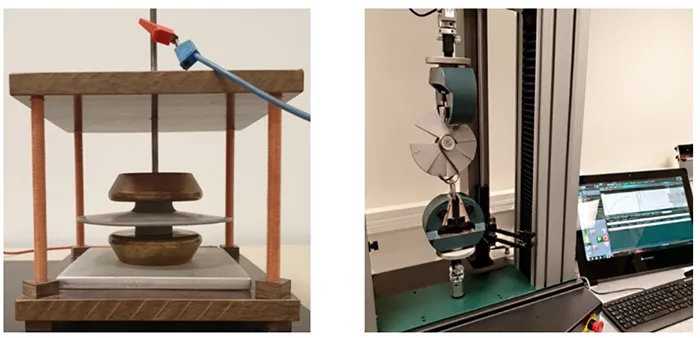
Detailed results have been presented in the literature and reveal weakness in adhesion core/housing on about 50% of insulators tested. This method is currently the only one able to reveal poor adhesion between core and housing and is essential to include in a basic after-service test matrix.
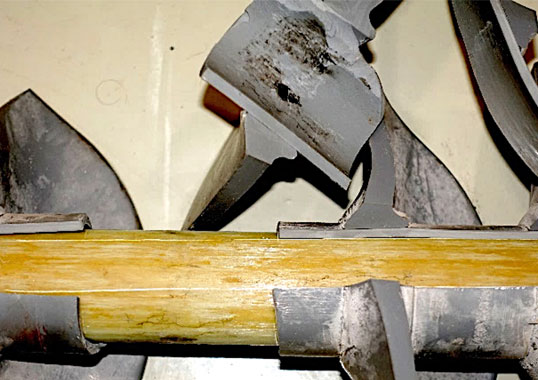
Dye Penetration
The Dye Penetration Test, also referred to as the Porosity Test, was conducted in accordance with IEC 62217 (clause 9.4.1). The procedure involves immersing test samples to a depth of 2-3 mm in a standardized dye penetration liquid for 15 min, followed by visual inspection. According to the standard, passing the test requires that no dye penetration into the core should occur in any sample during the 15 min immersion. Samples with housings were used, as permitted in the standard.
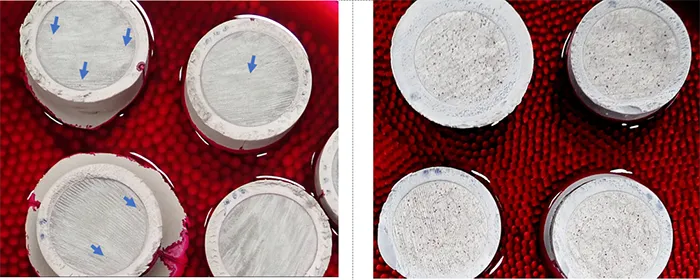
Results showed that about 60% of insulators formally failed in the standard test although extent of dye penetration varied (see examples in Fig. 14). This represents a new finding. Since this test was not included in past investigations comparison with the previous results is not possible. In related research in Australia, one out of 4 designs exhibited poor rod quality. Based on these recent findings, it is recommended that the dye penetration test be incorporated into the basic after-service test matrix. Moreover, considering these results, it might be wise to include this test in sample testing of different batches before installation.

Inspecting Cross-Section of Seals
One end fitting of each type of insulator was cut open using a metal band saw. Visible weakness was revealed on only one insulator design, as illustrated in Fig. 15. This was due to an issue with sealing such that the seal did not entirely cover the internal gap between metal flange and rod, leaving an air opening around the insulator.
It is noteworthy in this regard that insulators installed without grading rings can experience significantly higher electrical stress (e.g. twice as high compared to the current criterion). This can lead to discharge activity in the gap that could affect both the core, the housing and the seal itself.
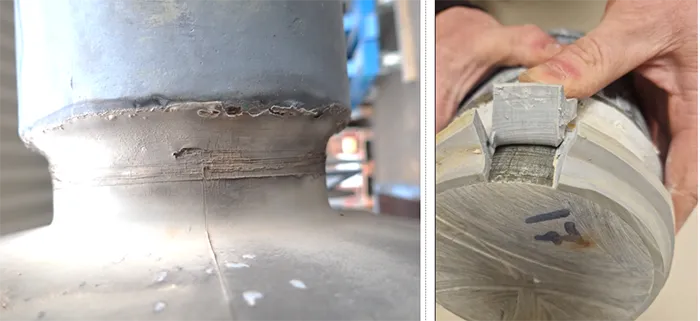
The issue of deterioration in sealing and potential water ingress has been confirmed through visual examination (see Fig. 16, left) and evaluation of adhesion core/housing close to the HV flange (Fig. 16, right). A corrosion test further confirmed deterioration of sealing leading to water ingress.
This analysis identifies potential vulnerability in insulator design, particularly related to the seal and the impact on its long-term performance. Electrical overstress and subsequent deterioration due to inadequate sealing are key concerns.
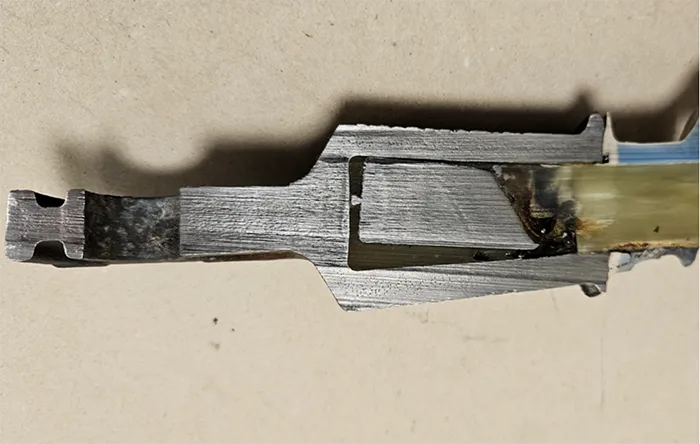
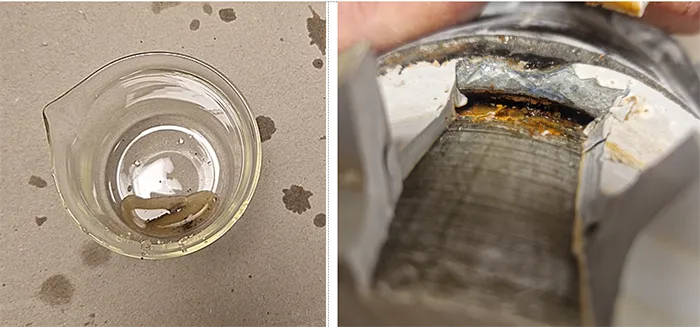
As stated earlier, a Rosenthal/Lapp insulator was oldest composite insulator inspected, representing an early generation due to its outdated wedge-type fitting design (see Fig. 17). The key concern with such an assembly is the potential for microcracks to form in the rod, which could lead to failure or reduced insulator life. All more modern insulators rely on the crimping method for assembly of fittings.
This type of investigation/testing is considered as supplementary (intended for tailor test matrix) and only necessary when there’s a suspicion that the sealing may be compromised.
Corrosion & Salt-Water Boiling Test of Fitting/Seal
There are no reliable standard or non-standard tests to evaluate quality of different sealing methods. This issue became a driving force for a separate research project to summarize knowledge on different designs of fittings/seals and to propose and verify innovative test methods to evaluate their integrity. The corrosion and saltwater boiling test was considered promising for quick evaluation of sealing and was applied in this work.
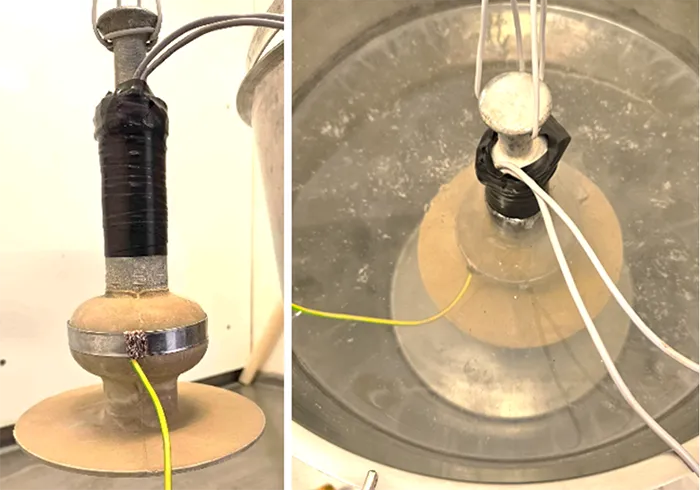
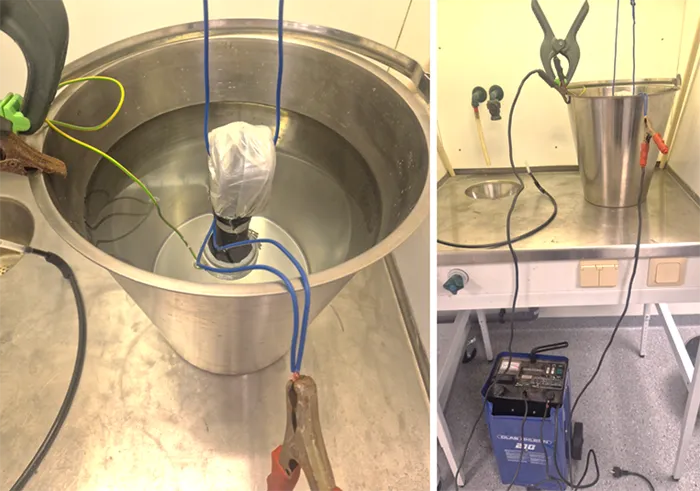
In the first part of this test, galvanic corrosion is intentionally initiated for pre-stressing since corrosion deteriorates impermeability of sealing at the interface between end fitting and housing. The end fitting is put into a metallic container filled with 10l of a mixture of tap water and NaCl, with concentration of 100 g/l. Galvanic corrosion is initiated by applying a DC voltage of about 10V between metal end fitting (positive polarity) and metallic container (negative polarity) for 2h. To concentrate the current at the interface between metal end fitting and sealing/housing, the main part of the end fitting surface is electrically insulated from the surrounding water using plastic foil and insulating tape (see Fig. 18). In this research, the arrangement resulted in a DC current of 10 to 15A.
Fig. 19 shows an example of an end fitting prepared for pre-stressing by accelerated corrosion. Afterwards, the end fitting was cleaned and placed in new salt water and boiled for 24h (i.e. the second part) to test samples pre-stressed by galvanic corrosion. After boiling, the end fitting was allowed to cool to room temperature (in water) before close-up visual inspection for potential water ingress such as signs of trapped water, corrosion, and any other kind of deterioration.
Only one design tested here did not pass. It showed water ingress and considerable water, which also caused traces of rust inside the insulator (Fig. 20).
This type of investigation/testing is considered as supplementary (intended more for the tailor test matrix) and only necessary when there is suspicion that sealing might be compromised.
Summary of Findings
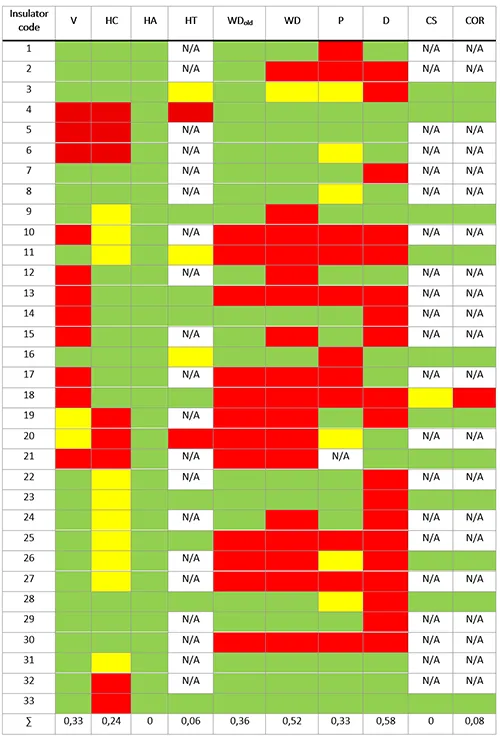
Table 2 offers a summary of the condition assessments for all insulators tested, with the following abbreviations:
• V: Visual inspection.
• HC: Hydrophobicity Class.
• HA: Hardness test.
• HT: Hydrophobicity Transfer test.
• WDold: Water Diffusion test according to the old (current) IEC criterion, i.e. the current is below 1 mA.
• WD: Water Diffusion test according to the soon coming IEC criterion, i.e. the current is below 0,1 mA.
• P: Pull-off test.
• D: Dye penetration test.
• CS (Cross-sections): Visual evaluation of cross-sections of fitting.
• COR: Corrosion and saltwater boiling test.
• ∑: number of “REDs” (failed in testing) for each type of test divided on number of insulators (rough sensitivity analysis of the most important tests).
The following criteria, in some cases subjective, were applied according traffic light principles:
• Visual inspections (V). Severity classes 1-2 are illustrated in GREEN (minor severity); severity classes 3-4 are illustrated in YELLOW (moderate severity) and severity Class 5 is illustrated in RED (severe deterioration).
• Hydrophobicity class of housing (HC). For illustration purposes the following subjective criteria are used: excellent performance HC 1-3 (GREEN); intermediate performance HC 4-5 (YELLOW), and poor performance close to hydrophilic state HC 6-7 (RED).
• Hardness test (HA). All samples passed then standard test; thus, they are marked by GREEN.
• Hydrophobicity Transfer (HT). For HT, results RED is denoted for HT rate < 2.0; YELLOW illustrates HT rate 2-4 and GREEN illustrates HT rate > 4.
• Old water diffusion test (WDold). Criteria for passing the test were: no puncture or surface flashover shall occur, and the current is below < 1.0 mA in any measurement on the same insulator. Pass/fail is marked by GREEN/RED.
• Water diffusion test (WD). Criteria for passing the WD test included: no puncture or surface flashover shall occur, and the current is < 0.1 mA in any measurement on the same insulator. Pass/fail is marked by GREEN/RED.
• Pull-off test (P). Criterion for passing the test was that the average stress per insulator shall be above 1.5 N/mm2. Acceptance is marked by GREEN, borderline cases are marked YELLOW and failure by RED.
• Dye penetration (D). The criterion was strictly according to the IEC standard, i.e., no dye shall rise through any of 10 specimens before the 15 min have elapsed. Pass/fail is marked by GREEN/RED.
• Visual evaluation of cross-sections of fittings/sealings (CS). If no remarks were found, results are marked as GREEN. In this case, air gaps, not filled by the sealing were found on one design, which was marked YELLOW.
• Results of sealing test (COR). If water ingress was found, the test was treated as failed and marked in RED. Otherwise, test results are marked GREEN.
If no tests were performed for any specific type of insulator, this was marked by N/A.
Discussion of Optimal Test Matrix
A key finding from this project was that the IEC standard dye penetration test reveals a relatively large number of insulators with low-quality rods. As a result, inclusion of this test in the basic test program is essential.
To start forming the basic test matrix, the results in Table 2 were analysed as follows:
“∑” represents the number of “REDs” for each type of test (not passed) divided by number of insulators tested. This parameter can be used as a rough sensitivity analysis for the most important tests. With a score > 0.3, these are:
• Visual inspection;
• Adhesion;
• Dye penetration.
Over the past decade, there have been many projects, each implementing slightly different after-service test protocols. These variations were due either to:
• Specific issues observed during service: or
• A broad intent to assess many electrical and mechanical parameters.
The diversity of this approach is summarized in Table 3 and referenced by open sources, although some data is not yet published. Specific types of tests applied in each project are indicated in GREEN.
The abbreviations used are:
• P: Present data
• B: Benchmarking project
• Tr: Transgrid
• Es: Eskom
• A, B, C, D, E, F, G, H: different European TSOs and DSOs
• 1,2,3: different projects for European TSOs and DSOs.
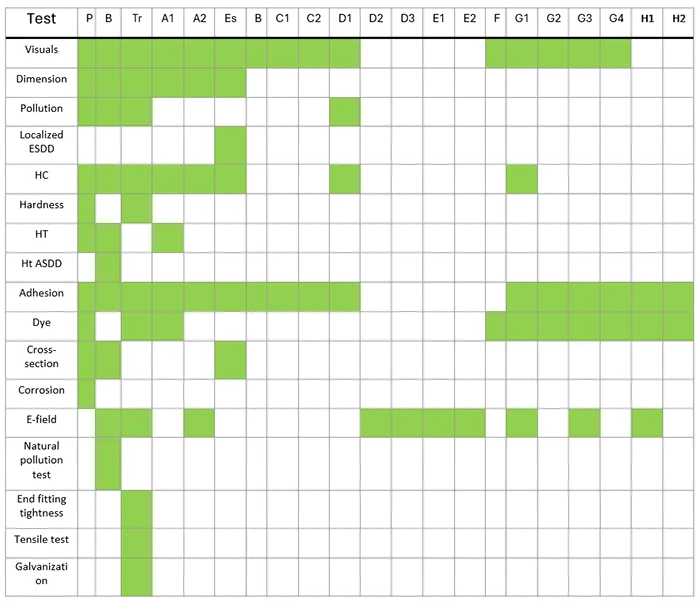
Analysis of data presented in Table 3 (number of GREENs for each test) leads to the following considerations for choosing basic and tailored matrices for after-service tests:
• Visual Inspection
Visual inspection is an essential first step in any failure or investigation of deterioration. As shown in Table 3, the vast majority of after-service test programs—except those involving separate electric field calculations—include this type of evaluation.
Observations gathered during visual inspection offer an initial indication of potential root cause of an issue. These early findings can guide more targeted investigation based on extensive inspection experience. For example, if a puncture is observed in the housing, it would be prudent to further examine adhesion between rod and housing as well as the quality of the rod itself.
• Adhesion Core/Housing (water diffusion & pull-off tests)
These tests are of high importance due to the dominant failure mode observed—flashunder caused by poor adhesion at the core/housing interface. Both water diffusion and pull-off tests are critical to assess this risk.
• Dye Penetration
Results presented above indicate that poor rod quality has become more frequent. Dye penetration testing helps identify such defects and contributes to overall reliability assessment.
Other methods, including electric field calculations, are considered supplemental and need not be included in the basic test matrix. However, these methods should be considered when developing a tailored test matrix.
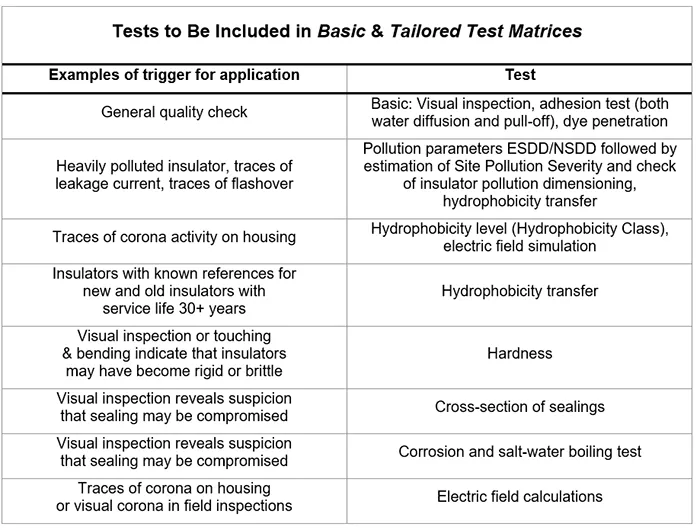
Table 4 provides examples of triggers for application of relevant tests. (Note: These are illustrative examples only).
Summary
This research project reviewed testing procedures and results for a set of 33 insulators sourced from 8 different manufacturers and having a range of service lives from 2 to 42 years (potentially even up to 55 years).
An abnormally large percentage of insulators tested exhibited signs of low-quality fiberglass rod, as detected by the standard IEC dye penetration test. In fact, this finding is so serious that it is now proposed to consider using the dye penetration test as a sample test.
Based on these findings, the report also proposes the concept of a basic test matrix that aims to reduce number of tests while still being effective in identifying poor quality insulators. This matrix, which also allows more efficient maintenance planning, consists of:
• Visual inspection: A standard procedure for identifying visible defects, cracks, or other physical damage to insulators.
• Adhesion core/housing testing: This includes both water diffusion and pull-off tests to check the bond between core and housing, which is critical for an insulator’s structural integrity.
• Dye penetration test: This test helps identify defects in fiberglass core material that could lead to failure.
This research also proposes the concept of a tailored test matrix. Other methods, including electric field calculation, should be considered when developing a tailored test matrix. Illustrative examples of triggers for its application as well as the relevant tests are provided.
Acknowledgment
The authors would also like to kindly acknowledge the group of individuals from companies, who participated in this work, and contributed to the results and discussions: Peter Sidenvall and Andreas Dernfalk (I2G); Jean-François Goffinet (Elia Group); Philipp Bader and Christoph Braunisch (APG); Martin Pedersen (Energinet); Matthias Meißner (Bayernwerk); Juha Keränen (Fingrid); Guillaume Cayzelle (RTE); Javier Lopez Osuna (Red Electrica); Adrian Hilde (Statnett); Armin Taheri (Svk).
References
[1] I. Gutman, A. Deckwerth, K. Halsan, M. Leonhardsberger, P. Meyer, L. Diaz, M. Radosavljevic, P. Trenz, K. Varli, K. Välimaa: “Application of Composite Insulators: Perceptions vs. Service Experience”, 2022 INMR World Congress, Berlin, Germany, 16-19 October 2022
[2] K. Varli, A. Deckwerth, L. Diaz, I. Gutman, K. Halsan, M. Jalonen, F. Lehretz, M. Leonhardsberger, L. Rasmussen, P. Rodriguez, T. Schiml, D. Windmar: “Optimizing Maintenance of Composite insulators: Results from European Initiative”, 2025 INMR World Congress, Panama City, Panama, 19-22 October 2025
[3] M. Jalonen, K. Välimaa, I. Gutman, A. Deckwerth, K. Halsan, M. Leonhardsberger, L. Diaz, P. Trenz, K. Varli: “Benchmarking Composite Insulators: Utility Perspective & European Initiative”, 2023 INMR World Congress, Bangkok, Thailand, 12-15 November 2023
[4] R. Ross: ”Strategic Role of Diagnostics in Asset Management Under Ageing, Climate Change & Earthquake”, INMR World Congress, Bangkok, Thailand, 12-15 November 2023
[5] I. Gutman, J. Lundengård, M. Heath, C. Kurniawan: “Evaluation of reliability of OHL through inspection-based maintenance of composite insulators”, CIGRE Colloquium, Sendai, Japan, 2023, paper 5287958
[6] I. Gutman, J. Lundengård, P. Sidenvall, A. Deckwerth, L. Diaz, J.-F. Goffinet, K. Halsan, M. Leonhardsberger, M. Radosavljevic, P. Trenz, K. Varli, K. Välimaa, M. Heath, R. Davey, W. Vosloo: “Condition assessment of line composite insulators: after-service test programs and their practical application”, CSE, March 2023, N. 28
[7] CIGRE TB 481: “Guide for the Assessment of Composite Insulators in the Laboratory After their Removal from Service”, 2011
[8] IEC TS 60815-1: “Selection and dimensioning of high-voltage insulators for polluted conditions – Part 1: Definitions, information and general principles”, 2008
[9] IEC TS 62073: “Guidance on the measurement of hydrophobicity of insulator surfaces”, 2016
[10] IEC 62217: “Polymeric HV insulators for indoor and outdoor use – General definitions, test methods and acceptance criteria”, 2012
[11] I. Gutman, A. Dernfalk, A. Deckwerth, L. Diaz, M. Jalonen, M. Leonhardsberger, P. Trenz: “Test Method for Evaluation of Ability for Recovery of Hydrophobicity of Composite Insulators”, ISH-2023, Glasgow, UK, 2023, paper 23
[12] I. Gutman, J. Lundengård, F.A. Machuca, D. Lepley, N. Kita, H. Homma, K. Kondo, T. Nakachi, S. Slimani, W. Manzke, P. Carlsson, Y. Wang, B. Robben, G. Lassu: “Evaluation of repeatability and reproducibility of the new-developed hydrophobicity transfer test for polymeric insulators”, ISH-2025, Karuizawa, Nagano, Japan, 24-29 August 2025, paper C3_1_30
[13] P. Sidenvall, J. Lundengård, I. Gutman, L. Diaz, A. Deckwerth, K. Halsan, M. Jalonen, F. Lehretz, M. Leonhardsberger, L. Rasmussen, P. Rodriguez, T. Schiml, K. Varli, D. Windmar: “Application of New Test to Evaluate a Key Parameter of Composite Insulators Hydrophobicity Transfer”, CIGRE Symposium, Montreal, Canada, 29 September – 2 October 2025, paper 10612
[14] I. Gutman, C. Ahlrot, P. Aparicio, A. Berlin, T. Condon, A. Dernfalk, J.-F. Goffinet, K. Halsan, K. Kleinekorte, J. Lundengård, M. Radosavljevic, P. Sidenvall, S. Steevens, K. Varli, K. Välimaa: ”Development of Innovative Test Procedure for Evaluation of Adhesion of Core-Housing of Composite Insulators: from Root Cause of Failures in Service to Reproducible Test Procedure,” CSE, N.20, pp. 171-182, February 2021
[15] IEC 61109: “Insulators for overhead lines – Composite suspension and tension insulators with AC voltage greater than 1 000 V and DC voltage greater than 1 500 V – Definitions, test methods and acceptance criteria”, 2025
[16] K. Varli, S. Steevens, J. Unterfinger, A. Dernfalk, I. Gutman, J. Lundengård, P. Sidenvall: “Benchmarking of sealing systems of composite insulators: ideas for innovative test methods” CSE, N. 25, pp. 108-131, June 2022
[17] F. Lehretz: ”Private communications” (former Lapp specialist), April 2025
[18] “Polymeric HV insulators for indoor and outdoor use – General definitions, test methods and acceptance criteria”, IEC FDIS 62217, 2025
[19] M. Radosavljevic, I. Gutman, C. Ahlholm, P. Sidenvall: “Ageing and deterioration of composite post insulators exposed to high electric field in 220 kV and 400 kV switchyards of Swedish network”, CIGRE SC B3 Colloquium, Recife, Brazil, 2017