Demand for reliable operation of power systems has driven adoption of online monitoring technologies for critical equipment such as surge arresters. This edited contribution to INMR by Mario Augusto Caetano dos Santos and other experts at Itaipu Binacional in Brazil assesses different arrester monitoring devices deployed as part of the utility’s predictive maintenance strategy.
Laboratory evaluations were conducted to compare total and resistive leakage current measurements against an offline reference under controlled conditions. In addition, a pilot study explored application of one of the monitoring devices on a 444 kV GIS surge arrester. Results from this work provide valuable insight into the challenges when implementing condition-based monitoring in complex substation environments.
Station-class surge arresters play a fundamental role in ensuring the reliability and safety of high voltage installations. By limiting overvoltages caused by lightning or switching operations, these devices protect critical equipment such as transformers, circuit breakers, and instrument transformers from insulation failures and damage. According to IEEE Std C62.11, proper selection, installation and maintenance of surge arresters is essential to prolonging equipment life and preserving system stability.
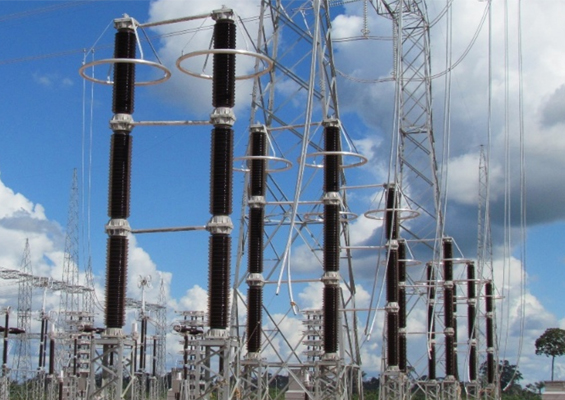
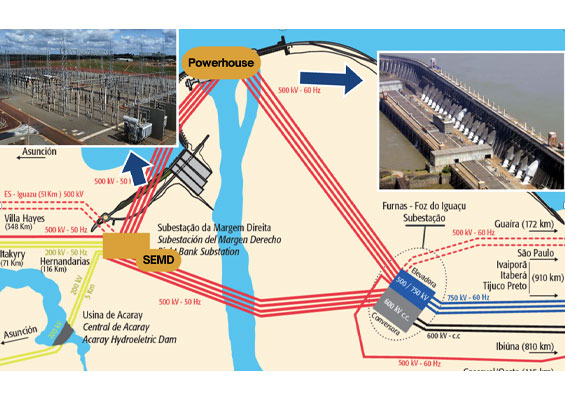
Itaipu Binacional’s hydroelectric plant, located on the Paraná River along the border between Brazil and Paraguay, is one of the world’s largest and has installed capacity of 14,000 MW. The facility includes approximately 300 surge arresters installed in both outdoor and gas-insulated substation configurations, applied across systems operating at 66/69 kV, 220 kV, and 500 kV.
Itaipu has implemented a predictive maintenance strategy for surge arresters for several years now. This includes infrared thermographic inspections, with extraction of temperature differentials (delta T) across arrester housings, and measurement of resistive leakage current according to Method B2 of IEC 60099-5, performed every 6 months.
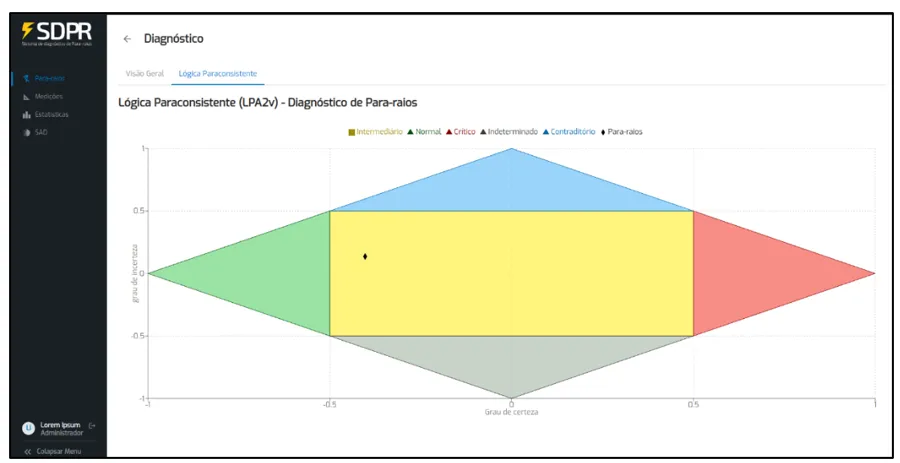
In recent years, both diagnostic techniques have been integrated into the Surge Arrester Diagnostic System (SDPR), which employs the Paraconsistent Annotated Logic with Two Values (LPA2v) to deliver a combined, intelligent diagnostic output (see Fig. 1). This approach enhances decision-making by providing a more robust assessment of arrester condition (as presented at the 2023 INMR WORLD CONGRESS in Bangkok).

Surge Arrester Replacement Plan
As part of its ongoing asset renewal strategy and commitment to operational safety, Itaipu Binacional initiated a comprehensive replacement plan for high voltage surge arresters at its main generation and transmission facilities. The objective was to modernize ageing equipment, enhance personnel safety, and integrate advanced monitoring capabilities to support predictive maintenance practices.
This plan encompasses replacement of 54 outdoor ZnO surge arresters rated at 420 kV, originally installed in the early 1980s, and currently in service across 8 transmission line bays and two auxiliary transformer banks (500 kV, 50 and 60 Hz) at ITAIPU’s Powerhouse. Existing porcelain-housed arresters are being replaced with new units featuring polymeric housings, which offer reduced risk of fragmentation on failure as well as superior resilience in contaminated or high humidity environments.
In addition, 30 outdoor ZnO surge arresters rated at 240 kV, also with porcelain housings and installed in power transformers and line bays of the 220 kV Right Margin Substation, are being replaced with polymer-housed units. As for the case of the 420 kV replacements, these devices date back over four decades and are being upgraded as a preventive measure aligned with ITAIPU’s risk mitigation policies.
Beyond replacement of equipment, this project includes a significant technological upgrade through specification of surge arrester monitoring systems. As part of procurement specifications, all new arresters must be supplied with dedicated monitoring devices capable of measuring and/or recording the following parameters:
• Total leakage current;
• Resistive leakage current component;
• Ambient temperature;
• Discharge events, including timestamp, peak current, and/or energy values.
These monitoring capabilities are essential to support Itaipu’s transition toward condition-based maintenance and improved diagnostic practices for high voltage equipment.
The procurement processes for surge arresters took place in 2019 for the 420 kV units and in 2022 for the 240 kV units. This resulted in contracts with different manufacturers for each voltage class. As a result, the monitoring systems supplied differ in technology as well as data acquisition methods.
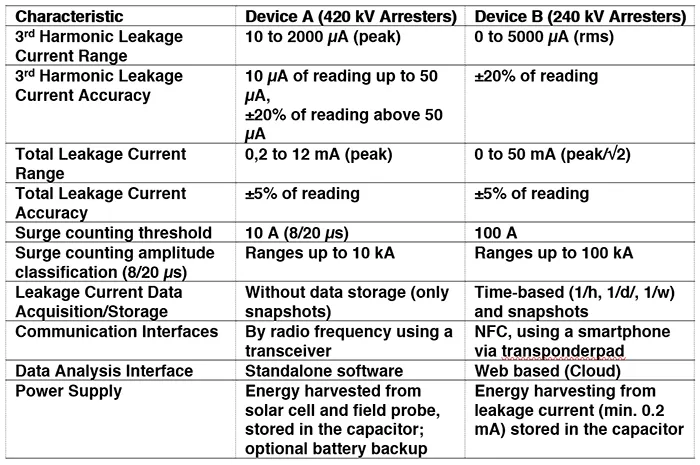
It is important to note that, in face of ongoing technological developments by manufacturers, the technical specifications of these systems were slightly different, specifically in terms of means of communication. The technology used in the 420 kV arresters (referred to hereafter as Device A) and in the 240 kV arresters (Device B), differ from one other as shown in the Table 1.
Initial Tests at Itaipu High Voltage Laboratory
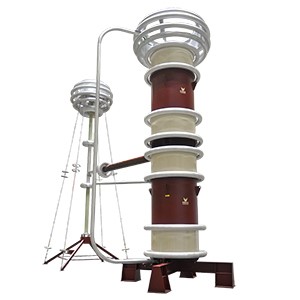
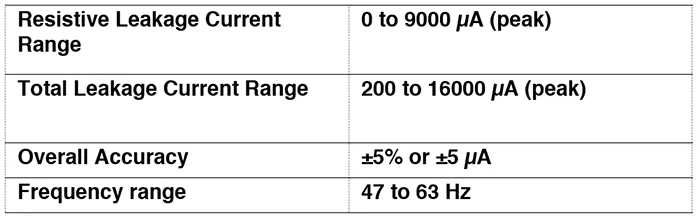
To evaluate performance of the monitoring devices prior to their installation, Itaipu conducted a series of tests at its HV Laboratory. This also aimed to verify agreement of the measurements with the traditional instrument used to measure resistive leakage current in the field, hereafter referred to as Instrument X. Table 2 shows the main specifications of the instrument. Both devices (A and B), as well as Instrument X use the B2 method of IEC 60099-5.
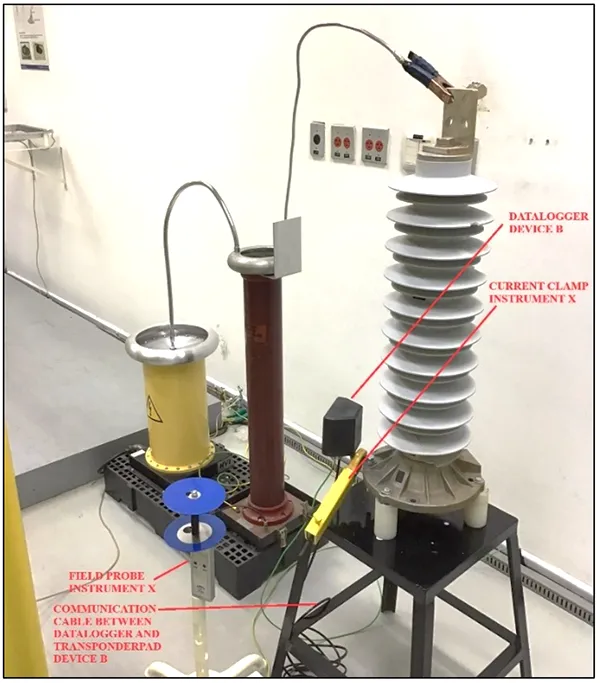
Device B was tested with its complete configuration (datalogger unit, transponderpad and smartphone) and installed on the surge arrester (Ur = 60 kV, Uc = 48 kV, class 10 kA) as per Fig. 2.
Two main functionalities were evaluated:
1. Impulse Detection
The device successfully detected and logged impulse events applied by a pulse generator. Data uploaded to the cloud platform showed most impulses in the 100 A to 1000 A range, consistent with oscilloscope measurements.
2. Leakage Current Measurement
Multiple instruments were used to compare total (oscilloscope and multimeter) and resistive leakage currents (oscilloscope and Instrument X) during application of a 40 kV / 60 Hz phase-to-ground voltage test.
Total RMS leakage current values were consistent across methods, with the following results:
Device B = 486 µA,
oscilloscope = 493 µA,
multimeter = 490 µA and
Instrument X = 496 µA (peak, converted to RMS).
However, discrepancies were observed in resistive current readings: Device B showed values in the 9 to 15 μA range, whereas Instrument X reported values around 37 μA (peak, converted to RMS). Further analysis using voltage-current phase comparison and harmonic content by oscilloscope suggested RMS resistive current values between 11 and 17 μA, corroborating the Device B data.
Overall, Device B’s system demonstrated reliable performance in both impulse registration and leakage current measurement, including integration with NFC technology and cloud-based analytics.
Tests of Device A were performed using the same surge arrester, impulse generator and voltage source as previous tests on Device B. Several impulses were applied, and the device registered all correctly (current range and timestamp). Related to total and resistive leakage current, the following values were obtained, respectively: 800 µA (peak) and 45 µA (peak). Fig. 3 shows Device A under impulse test.
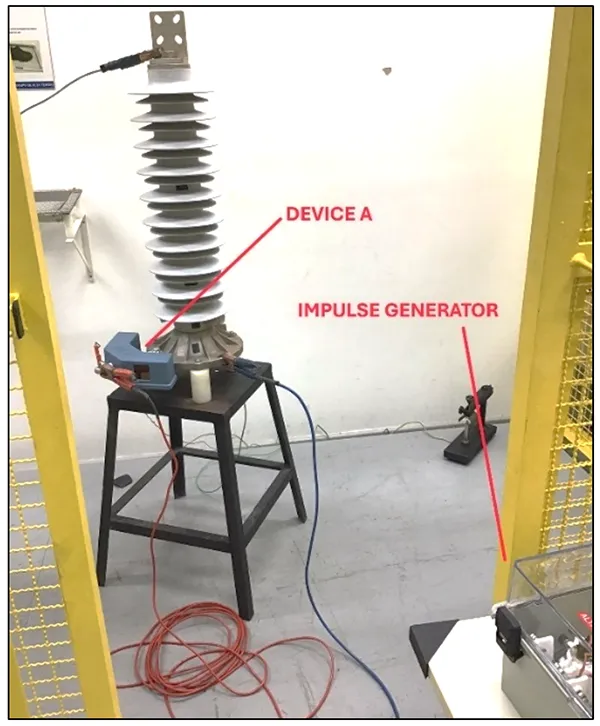
Comparing results from Device A with Instrument X, it became possible to see proximity between the values (peak), respectively, 800 µA versus 701 µA (total leakage current) and 45 µA versus 52 µA (resistive leakage current). Moreover, communication between Device A and the transceiver occurred correctly, as did upload and analysis of data in the manufacturer’s software.

Surge Arrester Monitoring Devices: Post-Installation Performance Assessment
Following the laboratory validation phase and the replacement plan as outlined above, ITAIPU initiated phased installation of surge arrester monitoring devices in operational substations starting in early 2024. The objective of the deployment was not only to enhance equipment reliability through continuous condition monitoring but also to evaluate performance of the devices over time and under real service conditions.
Field measurements began in Sept. 2024, with a targeted monthly frequency wherever operational and logistical conditions permitted. During these inspections, the data stored in the monitoring devices were collected, and parallel measurements were performed using Instrument X, to compare the recorded values.
Field performance data are presented for 3 representative groups of surge arresters, which vary in application, rated voltage, and monitoring device type:
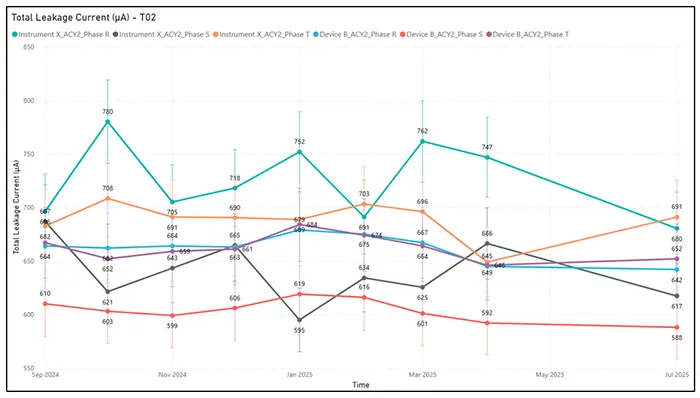
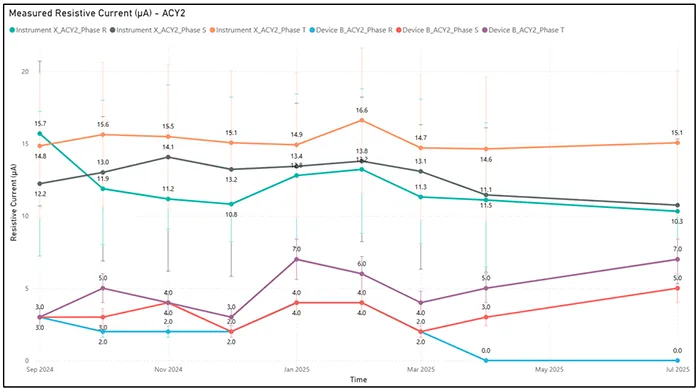
ACY2: A set of 240 kV surge arresters equipped with Device B, installed at a transmission line bay (see Fig. 4);
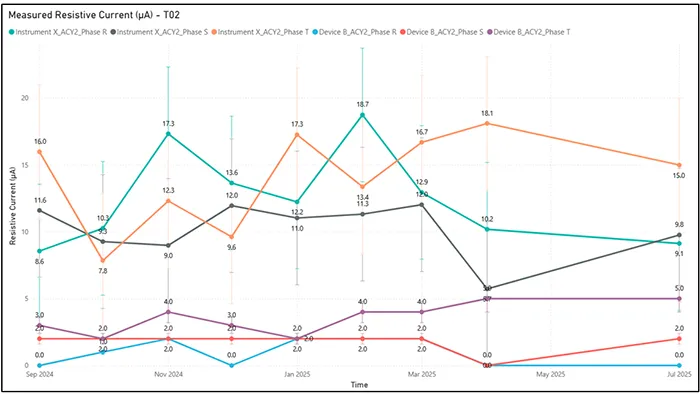
T02: A group of 240 kV surge arresters, also equipped with Device B, installed at a 500/220 kV, 470 MVA three-phase power transformer (see Fig. 4);
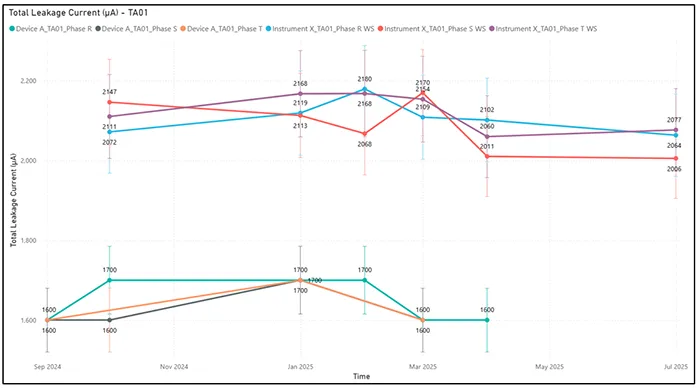
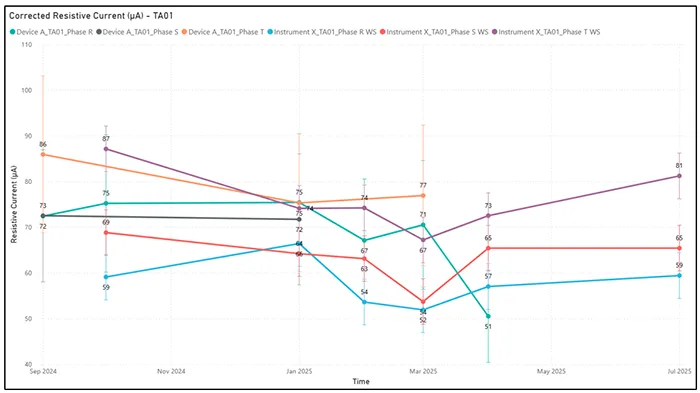
TA01: A set of 420 kV surge arresters equipped with Device A, installed at a bank of single-phase transformers 500/13.8 kV, 15 MVA each (see Fig. 6).
The comparative analysis includes total and resistive leakage current (without corrections) values obtained from both the monitoring devices and Instrument X, considering the accuracy ranges, as well as surge event records where applicable. Again, it should be considered that the values from Instrument X, when compared with Device B, were converted from peak to RMS values.
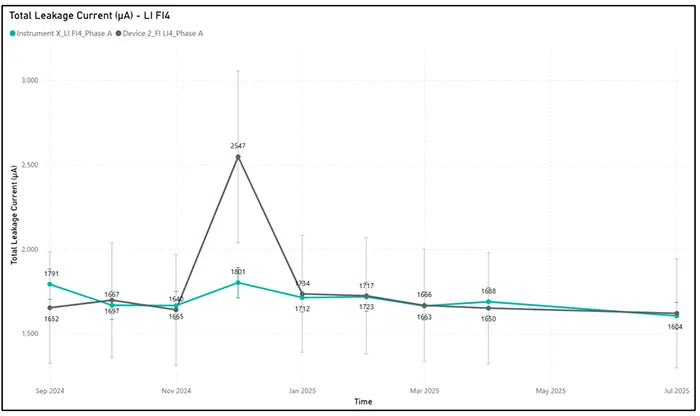
Figs. 6, 7 and 8 show the results of total leakage current, per phase, from monitoring devices and Instrument X at the ACY2, T02 and TA01, respectively.


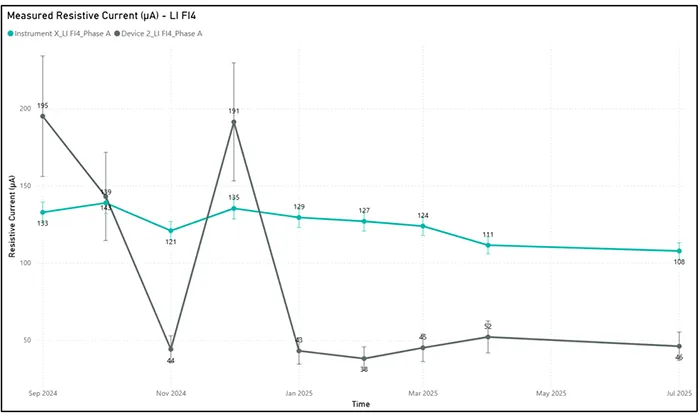
Figs. 9, 10 and 11 show the results of resistive leakage current, per phase, from monitoring devices and Instrument X at the ACY2, T02 and TA01, respectively. For the latter, the measurements presented were corrected by the temperature and system voltage factors, since Device A and Instrument X have the characteristic correction tables available in the software for the specific 420 kV surge arrester model. Device B allows to use the correction tables for the specific 240 kV surge arrester model, but it was not possible to add new correction tables in Instrument X. For this reason, the comparative measurements between them are not corrected.
In general, for total leakage current, Device B exhibited good agreement with Instrument X across all applications, particularly in the ACY2 line bay installation. The measured values were consistently within the accuracy ranges reported for both equipment, demonstrating reliable field performance and validating the laboratory findings that supported Device B’s deployment.
However, this favorable correlation was not observed with Device A. Significant discrepancies were noted between Device A and Instrument X measurements of total leakage current, with no clear technical explanation identified so far. This divergence had already been detected during high-voltage laboratory testing and remains an open issue under investigation. The inconsistency appears to be independent of environmental or operational conditions, and further studies are needed to determine whether it is related to hardware limitations, calibration drift, or other factors intrinsic to Device A.
For resistive leakage current, some differences were observed between Device B and Instrument X. Nevertheless, considering the very low magnitude of current involved – often in the order of a few tens of microamperes, which is typical for new surge arresters – and the ±5 μA margin of error for Instrument X, these deviations are deemed acceptable. This behavior was also consistent with the trends seen during the laboratory evaluation, where Device B measurements closely tracked expected values within measurement tolerance.
In turn, Device A demonstrated better alignment with Instrument X in measuring resistive leakage current. Although not perfect, the values generally overlapped within the combined error margins of both devices. This indicates that, for this specific parameter, Device A shows a reliable behavior.
Two additional observations merit considering when interpreting field data:
1. Measurements performed using Instrument X showed greater variability over time. This is understood to be an inherent feature of the measurement process itself, especially due to the variable positioning of the current clamp and electric field probe during each site visit. Despite the field team’s efforts to ensure consistency and repeatability, minor deviations in setup can influence readings, particularly at low current levels;
2. A significant limitation encountered during the monitoring period was the intermittent unavailability of monthly data from Device A. The primary issue has been the difficulty in establishing reliable communication with the transceiver unit. Despite several in-field attempts, including repositioning and use of an auxiliary antenna, the problem persists. As a result, gaps in the time series limit the continuity of the performance evaluation for this device.
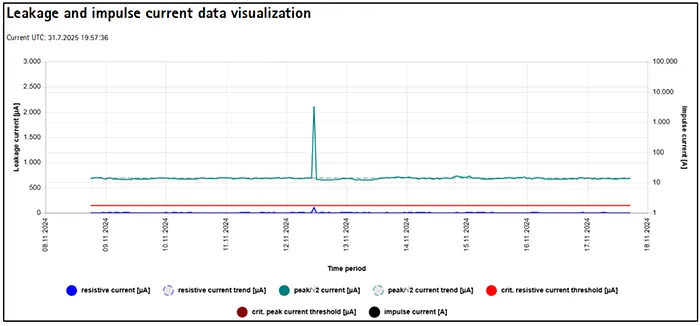
To conclude this chapter, screenshots of the software on Device A and the web cloud solution on Device B are shown (see Figures 12 and 13, respectively). In both cases, it is possible to track leakage current trends over time. The major difference is the automatic time-based acquisition on Device B, which allows for detailed tracking of the arrester’s behaviour, including the detection of sudden changes, as shown in Fig. 13, which were later confirmed as a switching overvoltage.


Pilot Testing of Device B on 444 kV SF6-Encapsulated Surge Arrester
As part of Itaipu’s efforts to expand application of online monitoring to different surge arrester configurations, a specific test campaign was conducted to evaluate the feasibility of using monitoring devices on SF₆-encapsulated surge arresters.
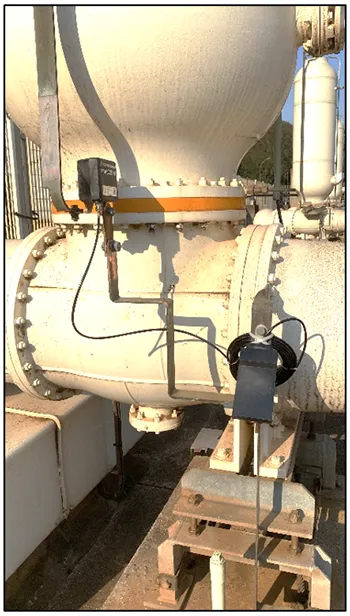
The pilot installation was carried out on a 444 kV surge arrester, encapsulated in SF₆ and exposed to outdoor conditions, installed on one of ITAIPU’s 500 kV / 60 Hz line bays (see Figure 12). This application was selected to represent the typical operating conditions of GIS surge arresters in the plant’s infrastructure.
The underlying motivation for this evaluation stems from the large number of GIS surge arresters in service at ITAIPU – 114 units distributed across the 50 Hz and 60 Hz GIS systems – for which semi-annual manual measurements of resistive leakage current are currently performed using Instrument X.
Device B was considered a strong candidate for this application because of a key technical advantage: it is self-powered by the leakage current of the surge arrester itself. This feature is particularly beneficial in indoor GIS environments, where sunlight and electric field are not present.
Initial observations from the test (see Figs. 13 and 14) showed that Device B presented an excellent agreement of the total leakage current with respect to Instrument X. The same did not occur for resistive leakage current, with a variance in the initial measurements and representative difference between the values.
The pilot project is ongoing, and extended operation will help validate long-term performance and data stability under the specific conditions.

Conclusions
Evaluation of online surge arrester monitoring systems at Itaipu Binacional revealed significant differences in performance between two tested devices. Laboratory tests confirmed that Device B delivers reliable measurements of both total and resistive leakage currents, with values closely aligned to those obtained from the reference equipment, Instrument X. By contrast, Device A showed acceptable agreement only in resistive current measurements, while notable deviations were observed in total leakage current values.
Field data supported laboratory findings, particularly for Device B, which demonstrated robust performance across different substation environments. Its ability to consistently acquire and transmit data combined with its intuitive cloud-based interface and NFC integration proved advantageous for condition-based maintenance strategies.
Despite some minor deviations in resistive current values, these were within acceptable limits given the very low magnitudes involved and the uncertainty inherent in field measurements. Device A, while effective in capturing resistive current trends, faced issues with communication stability and occasional data loss, which affected continuity of long-term monitoring.
A notable outcome of this study was pilot application of Device B to a 444 kV GIS surge arrester. This test case confirmed the device’s ability to operate effectively thanks to its self-powering capability via leakage current. Although differences in resistive current values were observed in comparison to Instrument X, total leakage current readings matched closely, indicating a promising path forward for monitoring GIS configurations without major modifications to infrastructure.
Overall, findings highlight the value of combining laboratory validation and field testing for deployment of monitoring technologies in high voltage environments. While Device B appears better suited for broader implementation, especially in locations where continuous data acquisition are essential, further refinement and investigation are warranted for Device A.
In parallel, Itaipu initiated a joint effort with Itaipu Parquetec, a local R&D centre, to explore development of an automated data collection system for Device A. However, due to lack of cooperation and technical support from its manufacturer, the initiative never progressed beyond the initial stage.
Integration of online monitoring, particularly in GIS systems, holds significant potential for enhancing diagnostic capability and operational safety of critical power infrastructure.
Ongoing Developments
As part of a continuous effort to enhance condition-based monitoring of surge arresters, Itaipu Binacional has initiated new developments in collaboration with a manufacturer and research partner. A key initiative involves field testing a new version of Device B, which incorporates LoRa communication via a gateway. This advancement eliminates need for on-site visits to retrieve monitoring data, significantly improving operational efficiency and enabling near real-time data access.
Six upgraded Device B units have been under evaluation. Three of these are installed on 240 kV surge arresters connected to a power transformer, while the remaining units are applied to 60 kV surge arresters installed on a transmission line bay. The goal has been to validate long-term stability, communication reliability and improve capability for data analysis.
In parallel, with technical support from Itaipu Parquetec and in partnership with the original Device B manufacturer, a new solution is being developed to automate data collection from the existing fleet of Device B units. This initiative aims to create a scalable interface capable of periodically aggregating data without manual intervention, further strengthening digitalization of high voltage equipment diagnostics.
References
[1] IEEE Std C62.11-2020, IEEE Standard for Metal-Oxide Surge Arresters for AC Power Circuits (>1 kV), Institute of Electrical and Electronics Engineers, 2020.
[2] IEC 60099-5 Ed.2.0, Surge Arresters – Part 5: Selection and Application Recommendations, International Electrotechnical Commission, 2013.
[3] Santos, M. A. C. dos, Diagnosis of High Voltage Zinc Oxide Surge Arresters Using Paraconsistent Annotated Logic, Master’s Thesis, Institute of Technology for Development – LACTEC, Curitiba, 2022. (Document available in Portuguese only). Available at: https://repositorio.lactec.org.br
[4] Hitachi Energy, Excount-II – Surge Arrester Monitoring System: User Manual, Hitachi Energy, 2020. Available at: https://www.hitachienergy.com
[5] Tridelta Meidensha GmbH, smartCOUNT – Online Monitoring System for Surge Arresters: Operating Instructions, Tridelta Meidensha GmbH, 2021. Available at em: https://www.tridelta-meidensha.com
[6] Doble Engineering Company, LCM-500 Leakage Current Monitor: User Guide, Doble Engineering, 2019. Available at: https://www.doble.com
[7] Raschke, P.; Fotsing, S., Arresters with Brains: New Era IoT-Enabled Condition Monitoring Enhanced by Artificial Intelligence, INMR World Congress 2023, Bangkok, Thailand.