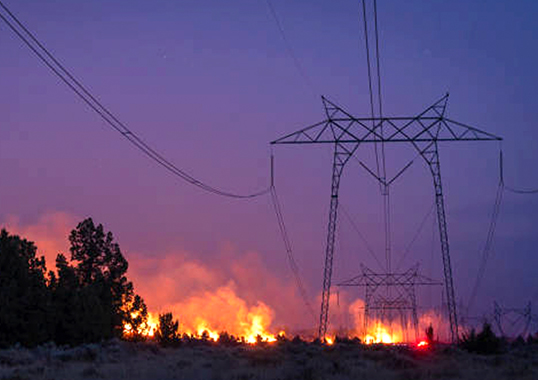
Failures of insulators due to pollution flashover can lead to potentially long outages and require costly and time-consuming remedial maintenance. Among the leading causes of these types of failures is application of insulator designs that cannot cope with the actual stresses imposed by pollution. It is therefore vital to correctly assess the pollution characteristics of the environment into which insulators will be placed into service.
This edited past contribution to INMR by Dr. Igor Gutman at Independent Insulation Group in Sweden and Dr. Wallace Vosloo, retired from Eskom in South Africa, reviewed practical field and laboratory experience with different pollution monitoring techniques and explained principles to convert from one parameter to another. It also discussed applying these parameters for dimensioning insulators.


The process of selecting and dimensioning insulators for use under polluted conditions requires a site severity evaluation. Ideally, this should be performed over a minimum of a year in order to best choose the maximum stress level and corresponding site pollution severity (SPS) class. Such a monitoring process is normally done by conducting equivalent and non-soluble salt deposit density (ESDD/NSDD) measurements on reference insulators as well as using data from a directional dust deposit gauge (DDDG). For coastal areas, there may also be a need to estimate site equivalent salinity (SES). Once the correct SPS class is obtained, the specific creepage distance of the selected insulator in terms of phase-to-ground voltage is chosen. However, optimal insulation dimensioning can only be achieved through application of statistical methods, as long used for switching overvoltages but now also firmly established for insulator dimensioning under polluted conditions.
While this might appear straightforward, it must be kept in mind that input data for insulator selection based on pollution monitoring has to be reliable.

Pollution Monitoring Techniques
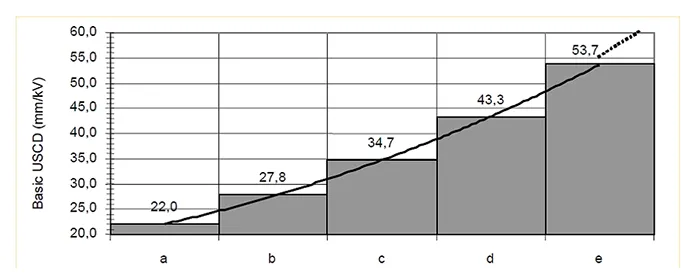
IEC 60815 has recommended several parameters to define pollution severity for the selection and dimensioning of outdoor insulators:
• Equivalent salt deposit density (ESDD)
• Non-soluble salt deposit density (NSDD)
• Directional dust deposit gauge (DDDG) conductivity
• Surface conductivity (SC)
• Site equivalent salinity (SES)
ESDD and NSDD are well known and not specifically discussed here. Moreover, SES is an impractical parameter. The other useful parameters include:
1. Directional Dust Deposit Gauge (DDDG)
A DDDG consists of four collecting tubes, each with a vertical slot on the side into which rain and any airborne pollution are blown. The slots are arranged to face north, south, east and west while removable containers are attached to the bottom of each tube to collect the deposits.
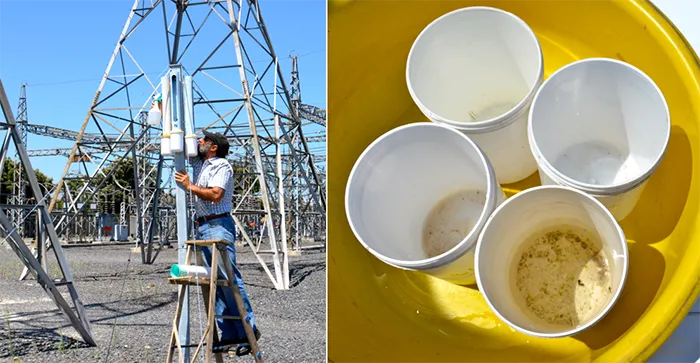
The containers are taken out at regular intervals and their contents mixed with given amounts of distilled water to determine resulting solution conductivity. The pollution index (PI) is then defined as the average conductivity of the four directions expressed in mS/cm and normalized over a 30-day collection period. Moreover, in addition to the pollution index, the amount of non-soluble deposits is sometimes also of interest since it can influence insulator performance. If considered useful, the amounts of these deposits in the solution should be measured using the same procedure applied for standard NSDD measurements.
If weather data at the site under study is available, the pollution index can be modified to also take influence of climate into account. This is done by multiplying the pollution index (PI) with the climatic factor (Cf), calculated as follows:
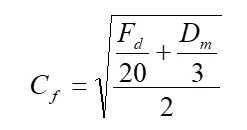
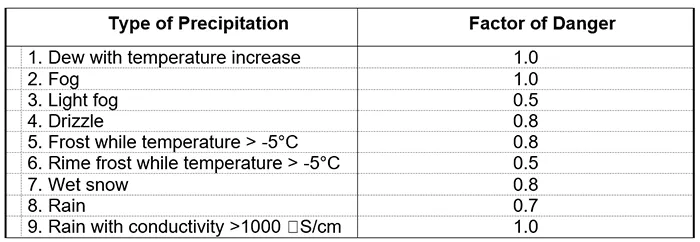
where Fd is the number of foggy days/year (i.e. < 1000 m of horizontal visibility) and Dm is the number of dry months/yr (i.e. < 20 mm of precipitation). Note that this equation is based mainly on South African experience and should be used with caution in much different types of climates. In particular, other types of precipitation factors could also be taken into account in moderate climates. For example, Table 1 (taken from a past Russian Guide) illustrates that differing types of precipitation are related to different ‘danger factors’ from the viewpoint of insulator pollution performance.
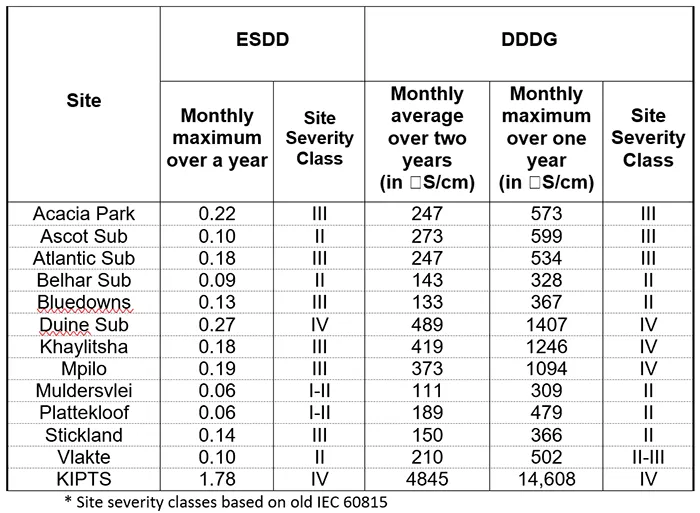
DDDG measurements can be highly sensitive to the immediate environment. An important question that arises in this regard is whether knowing DDDG measurements would enable converting this into standard ESDD data. The answer can be seen from Table 2 where site severity classes at 12 South African locations are presented in the range from I to IV (according to the old version of IEC 60815). Results obtained utilizing ESDD and DDDG values correspond well and confirm that using DDDG data for site severity evaluation is indeed feasible.
2. Surface Conductivity (SC)
Theoretically, measurements of insulator resistance with further conversion using a ’form factor’ into surface conductivity (in mS) offers some advantages. For example, it allows automatically taking into account the impact of any non-uniformity in pollution layer or combining the effect of pollution and wettability parameters in the case of composite insulators. However, to use this parameter as an alternative to standard ESDD/NSDD measurements, it should be applied and standardized in a laboratory environment, from in-service measurements and also in any guide materials.
For example, this has reportedly been achieved in the past in Russia where outdoor insulation is selected based on direct artificial pollution tests at about 1.7 x maximum operating voltage as well as at 2, 5, 10 and 20 mS for site severities from I to IV respectively (according to the former version of IEC 60815).
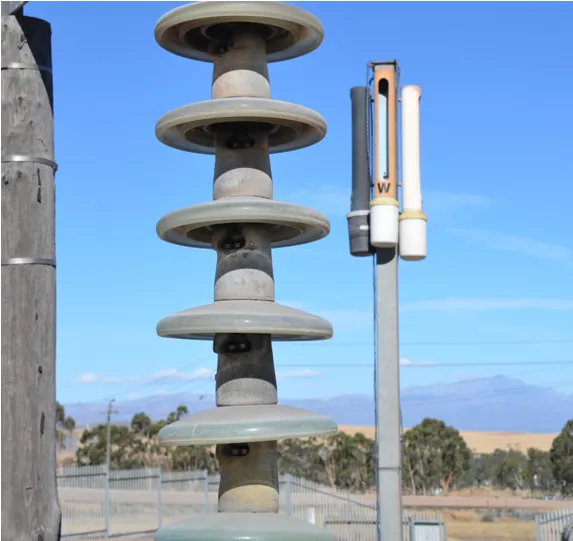
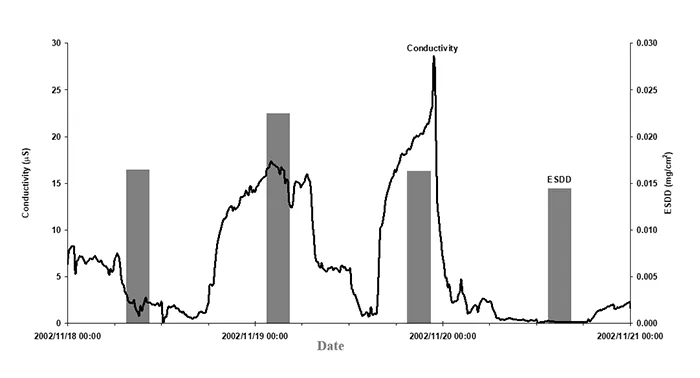
In South Africa, by contrast, a practical monitor called the Insulator Pollution Monitoring Device (IPMD) as well as similar devices whose primary diagnostic parameter is surface conductivity have been developed. These allow for more detailed and frequent assessment of site conditions by automatically determining severity of pre-deposited pollution at selected intervals and recording any instantaneous pollution events. Some also allow monitoring leakage current amplitudes on in-service insulators. Typical measurements performed by such devices include:
• Insulator surface conductivity under natural pollution and wetting;
• Insulator surface conductivity under natural pollution but with artificial wetting;
• The leakage current amplitude on in-service insulators.
Fig. 2 shows examples of findings obtained from an in-service IPMD. Since both pre-deposited and instantaneous pollution levels are recorded daily, natural pollution and wetting events are not averaged out over a month. This eliminates risk of missing any singular severe pollution events, as is the case with both the surface pollution deposit and directional dust deposit gauge methods.
Leakage Current Measurement
Leakage current flowing on an insulator depends mainly on the characteristics of the pollution on its surface as well as its geometry and material. For this reason, measuring and analyzing leakage current can be useful to estimate pollution severity and risk of flashover. Leakage current is usually measured by collecting the current at the ground end of energized insulators. There are three common methods for this purpose:
1. Surge counting
The number of leakage current pulses (or surges) exceeding some threshold level can be recorded during a period of time. This is important since the numbers of pulses as well as their amplitudes increase when approaching the last stage of the pollution flashover process.
2. Measuring peak current
Information about pollution severity on an insulator can be obtained by recording the highest peak current over a given time interval. This parameter can then be related to risk of pollution flashover.
3. Measuring accumulated charge
Accumulated charge measurement is performed in the same way as leakage current measurement. However, instead of focusing on the values of the highest peaks, the signal is integrated to represent accumulated charge – a parameter more related to the ageing process on the insulator surface.
Over the years, a number of different pollution monitors to measure leakage current have been developed. Products have ranged from simple surge counters to advanced multi-channel devices that even incoporate integrated meteorological stations.
A standard such system now typically includes an integrated weather station to record wind speeds and direction, humidity, rainfall, temperature and UV-B radiation. All sampled values are then saved at some user-defined interval, typically every 30 minutes. Recorded data is retrieved using a serial port, which also serves to configure the instrument. Using such advanced devices, researchers have been able to obtain a large volume of leakage current and corresponding weather data. These have helped better understand the physics of the pollution flashover process on different types of insulators.
Sophisticated mathematical approaches have also sometimes been necessary. For example, multivariate analysis (MVA) methods has been used since they are appropriate to study and analyze data structured on many interrelated variables. MVA software was successfully tested in an ageing and pollution performance study performed on seven insulators exposed to pollution at the Kelso Test Station (on the Indian Ocean coast of South Africa) and at the Dungeness Test Station (on the southern coast of the United Kingdom. An example of applying MVA is shown in Fig. 3.
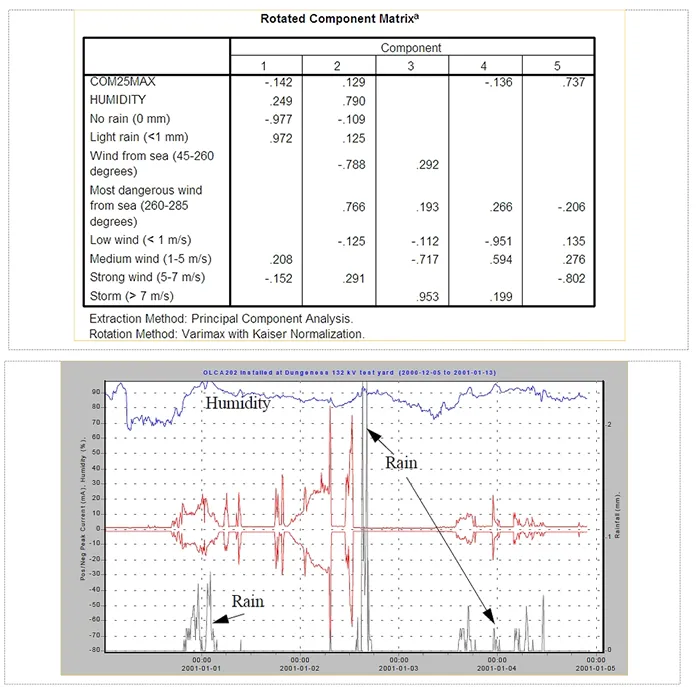
A classical coastal pollution event is characterized by strong wind from the sea followed by some kind of wetting. However, in the case of a silicone rubber insulator, high humidity alone is usually not sufficient to lead to high current. Therefore additional wetting in the form of light rain is usually needed.
This conclusion is supported by recording a typical pollution event on a silicone rubber insulator.
Sensitivity of MVA can be very high. For example, during the pre-pollution phase of the pollution event at the Dungeness Test Station, salt is transported inland by strong winds. The most dangerous wind direction (associated with the four most severe pollution events and leading to the highest currents) has an angle of between 0 and 20° to the shore. This is due to a wall of sand that protects the site from the perpendicular (90°) direction.
The description of the pollution event at the Kelso Test Station on South Africa’s Indian Ocean coast is slightly different. During the pre-pollution phase at Kelso, salt comes in not only from the sea but also from the land since wind direction is almost parallel to the coast.
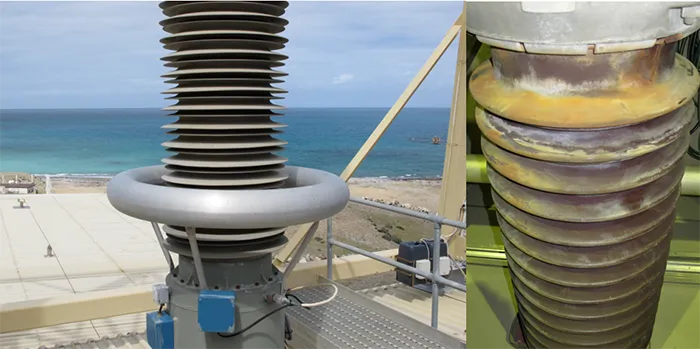
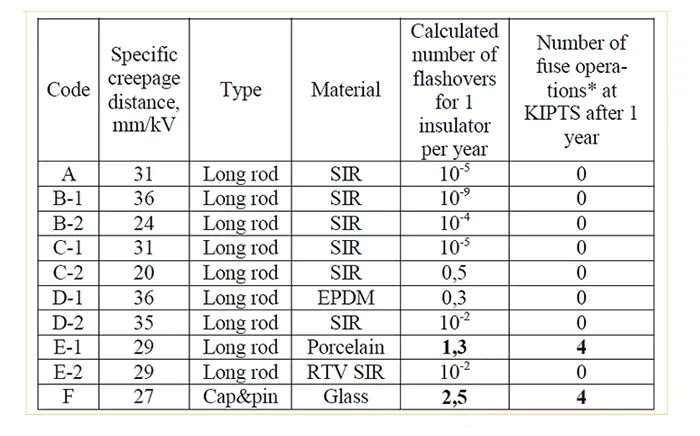
Another practical application of leakage current data would be to convert it into pollution flashover performance curves. This approach was tested by applying STRI’s IST program (discussed in Part 1 of this article) to 10 uniquely different insulators at Eskom’s Koeberg Insulator Pollution Test Station (KIPTS) on the Atlantic coast near Cape Town. Results proved quite reasonable in predicting outage rate compared to actual experience, i.e. number of blown fuses, (see Fig. 4).
Results of such field station testing can be used practically well beyond simply assigning a ‘pass/fail’ grade to each insulator tested. For example, they can help estimate the pollution flashover performance of a complete overhead line located in the same area and equipped with these same insulators (geometry and material).
These days, however, many power supply companies are looking for simple and robust systems for pollution monitoring and warning in place of complicated ‘research-type’ systems for measuring leakage current. This is because uprating/upgrading existing overhead lines requires accurate evaluation of pollution levels.
Indeed, attempts to use the systems described above for this purpose have not always been successful because they are expensive and need maintenance at least once a year. Moreover, there were communication problems in many applications.
Therefore, single-channel systems (for peak current only) applicable to both overhead lines and substations are now most in demand and under active development. The goal is to have relatively inexpensive and reliable devices cover large areas and allow data collection and transfer via the Internet.

Specific Techniques Applying to Composite Insulators
Specific diagnostic techniques for composite insulators (along with practical examples from field and laboratory investigation) include:
• Hydrophobicity measurement;
• Hydrophobicity transfer (localized ESDD);
• Rapid flashover procedure to obtain dielectric strength of naturally polluted insulators.
1. Hydrophobicity
Hydrophobicity measurements are performed according to IEC TS 62073 and comparatively simple.
2. Hydrophobicity Transfer (localized ESDD)
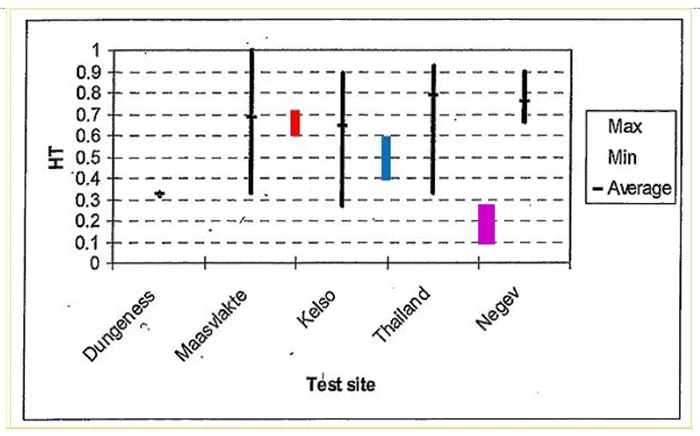
Hydrophobicity transfer (HT) is a measure of a material’s ability to recover hydrophobicity. This process is due to diffusion of low molecular weight species (LMW) in the silicone rubber bulk material through the pollution layer to the surface. These then encapsulate any pollution particles, including salt.
Even if the polluted surface appears hydrophilic, part of the pollution layer is penetrated by LMW silicones and effective resistance increases. HT is defined as:

where ASDD is Apparent Salt Deposit Density (or localized ESDD). Both ESDD and ASDD are measured with a small cell filled with deionized water where the bottom is the surface of the polluted insulator. ASDD is measured initially as current through the cell when the encapsulated pollution has not yet dissolved. After 5 minutes, or when current has stabilized, the bottom surface of the cell is scraped with a glass rod to set any encapsulated pollution free. This is then the measure of ESDD.
This parameter provides a good indication of the ability of a composite insulator to recover under different environments. A compilation of HT values and their spread for different AC and DC silicone insulators is presented in Fig. 5 (high HT is considered > 0.5).

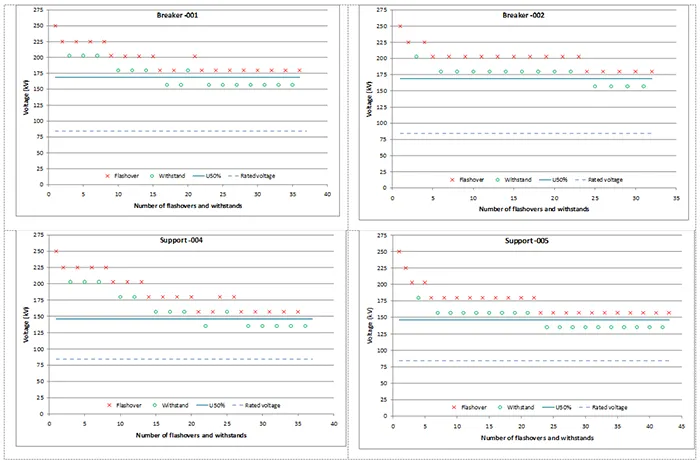
3. Rapid Flashover Procedure (to obtain dielectric strength of naturally polluted insulators)
Because relatively few insulators with natural contamination are normally available from service, it would be time consuming to use the standard ‘up-and-down’ testing procedure to obtain flashover voltage. The rapid clean fog test method can then be used instead with the advantage that it is directly applicable to both naturally and artificially polluted insulators
The insulator is tested by consecutive application of voltage until the minimum withstand voltage of the U-shaped curve is obtained. Flashover levels generally decrease before resistance of the insulator starts to increase due to the washing effect. The minimum voltage level obtained is then considered to represent U50%. As a result, only one test is required per insulator, level of pollution and degree of hydrophobicity.
This method, for example, has been successfully applied at STRI for testing:
• AC porcelain support insulators with industrial pollution;
• DC glass cap & pin insulators with light inland pollution;
• DC composite insulators with light marine pollution;
• DC composite insulators with light inland pollution;
• AC composite circuit breaker housings with heavy industrial/marine pollution.

This method can be applied to create pollution performance curves to be used in the STRI IST program, as was done for insulators replaced from the Skagerrak and Cabora Bassa DC overhead lines. It can also be used to quantify the ability of a composite insulator to recover hydrophobicity. Such methods are presently under review by a new CIGRE working group D1.44 ‘Testing of naturally polluted insulators’. The test’s excellent repeatability is illustrated by the results from two different naturally polluted insulators (see Fig. 6).

Summary
IEC 60815-1 has required accurate site severity evaluation performed over a minimum period of one year to identify the maximum stress level and corresponding site pollution severity (SPS) class. Such a process can then be defined as pollution monitoring and is the starting point in the process of selecting and dimensioning outdoor insulators for service in polluted areas.
Among the trends in pollution monitoring to generate such inputs are:
• Expanded application of simple, robust and reliable devices (e.g. dust deposit gauges and single-channel leakage current sensors);
• Novel as yet not standardized methods that take into account specific features of insulators (e.g. hydrophobicity transfer / localized ESDD in the case of composite insulators);
• ‘Smart’ (time and cost-effective) methods to obtain flashover voltage of naturally polluted insulators, e.g. when only a few test objects are available (rapid procedures).
• Further development of specialized software programs for ultimate application by power companies (e.g. combining technical and economic issues into one program).