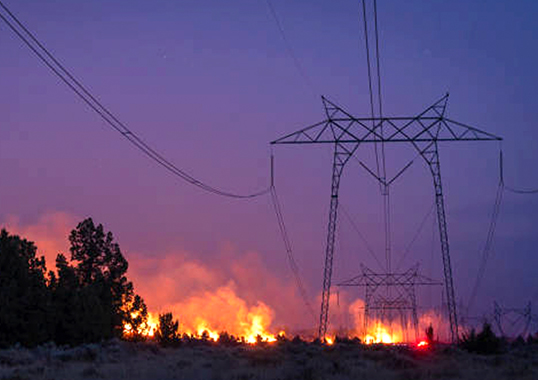
Galloping and ice shedding of overhead transmission lines is a problem that has been receiving growing attention across the globe. Related insulator flashover only serves to make icing an even greater threat to reliability. For example, during the winter of 2008/9, southern China experienced the most serious snow and freezing weather in half a century. The chain of events began when a large dome of cold air enveloped most of the country. The power system was severely affected and 17 of 31 provinces and autonomous regions forced to endure reduced power supply. Hunan and Jiangxi were particularly hard hit, with about 37% of all 500 kV towers in these provinces toppled by icing or galloping. One city alone, Chenzhou, had no power or water for nearly two weeks while Fuzhou reportedly lost power for 3 weeks. The number of power lines that suffered outages reached 36,740, the number of transformer shutdowns was 2018 and the number of collapsed 110 kV to 500 kV towers was 8,381.
This edited past contribution to INMR by Prof. JIA Zhidong of the Graduate School at Shenzhen, Tsinghua University discussed anti-icing and de-icing methods for insulators as investigated in China. Particular reference is made to application of semi-conductive silicone rubber coatings on insulators.
Anti-Icing of Suspension Insulators
Among the mitigation methods used to improve icing performance of insulators are increasing leakage distance using profiles with greater shed-to-shed distance or changing insulator orientation, which decreases risk of ice bridging. Both methods have been used with success not only for porcelain and glass insulators but also when designing lines with composite insulators. Ice accretion on insulators can greatly reduce effectiveness of insulation, leading to flashovers and outages. Since the irregular shape of insulators makes it difficult to develop devices for automatic de-icing, efforts to eliminate ice on insulator strings have been focused mostly on passive methods such as modification of surface characteristics. Use of hydrophobic materials on insulators, for example, can reduce adhesion between ice and substrate surface, although it cannot completely prevent ice formation. Ice will then tend to slide off. An alternative approach is developing ‘super-hydrophobic’ coatings or surfaces where the contact angle of water is greater than 150°. In this case, water droplets easily roll or slide off the surface and are unlikely to stay long enough to freeze or to adhere to the surface even if they do freeze. Great effort has therefore been devoted to improving hydrophobicity of surfaces. Conventionally, there are two approaches to produce such super-hydrophobic surfaces: one is to create a rough surface on top of one that is already hydrophobic, i.e. contact angle > 90°; the other is to modify the surface of materials already having low values of surface free energy. Yet another approach is to develop semi-conductive coatings.

Anti-Icing of Insulators Using Semi-Conductive Coatings
Thermal methods have been considered to be an effective measure for de-icing and the idea was firstly tested in order to generate de-icing on conductors or ground wires. Heating conductors by the Joule heat generated by electric current has proven to be a practical method for preventing ice accretion. Ice coverage will also be significantly reduced when the surface temperature of the insulator maintains above 0°C.
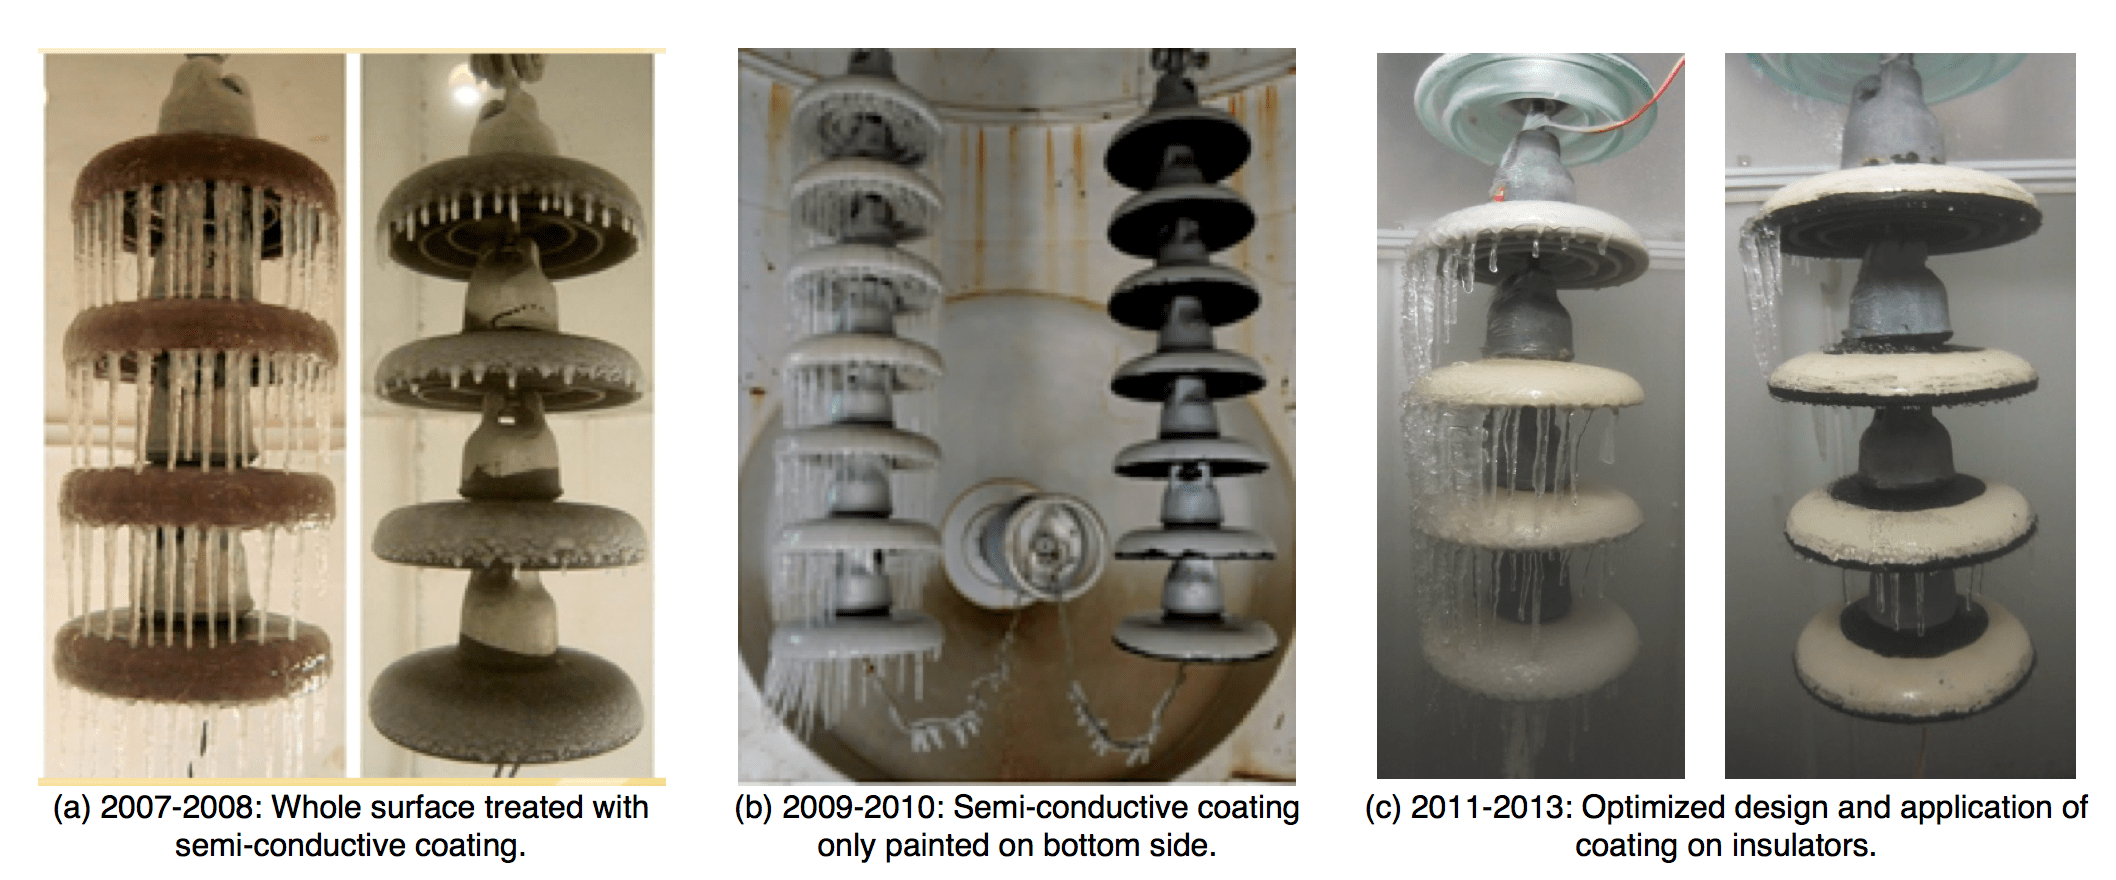
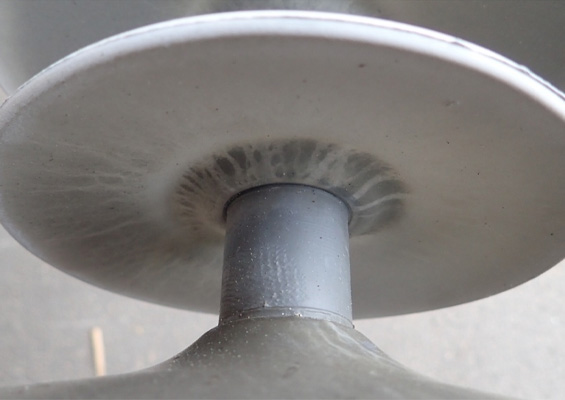
Back in 2007, a type of semi-conducting silicone rubber coating, developed by stirring conductive fillers into normal RTV, was successfully applied to insulators. Here, hydrophobicity and hydrophobicity transfer of the ice-covered surface prevent the formation of glaze and decrease the adhesion force between the ice layer and the material surface (Fig. 2a). Joule heating generated by the semi-conductive coating delays formation of ice. Conductive filler particles such as carbon black and carbon fibers were mixed into the RTV silicone rubber to reduce the electrical resistance of the rubber and make the material semi-conductive.
The semi-conductive silicone rubber was applied to the bottom side of the insulator to configure the surface resistance of the insulator in order to eliminate power loss and accelerated aging due to continuous thermal consumption when there is no precipitation. In this case, a conductive path forms when the top side of the insulator is wetted by moisture or precipitation under certain conditions. Leakage current and electric discharge occurring between water droplets can generate enough heat to delay ice accretion. With this method, good anti-icing performance of test insulators was obtained under certain laboratory conditions (see Fig. 2b). However, effective anti-icing behavior depends on the heating generated by leakage current across the insulator surface. Apart from atmospheric conditions, coating resistance and coated area covering the insulator surface are the two important factors and can both be adequately controlled. Therefore, optimization of the coating applied onto the insulator was subsequently carried out (see Fig. 2c) and a series of icing tests were conducted aimed at finding the optimal design for preventing ice accretion on insulators.

Design of Semi-Conductive Insulator Coatings
Basic Process & Simplified Model
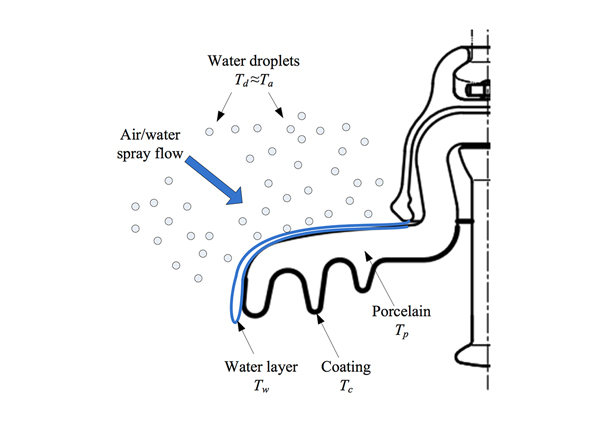
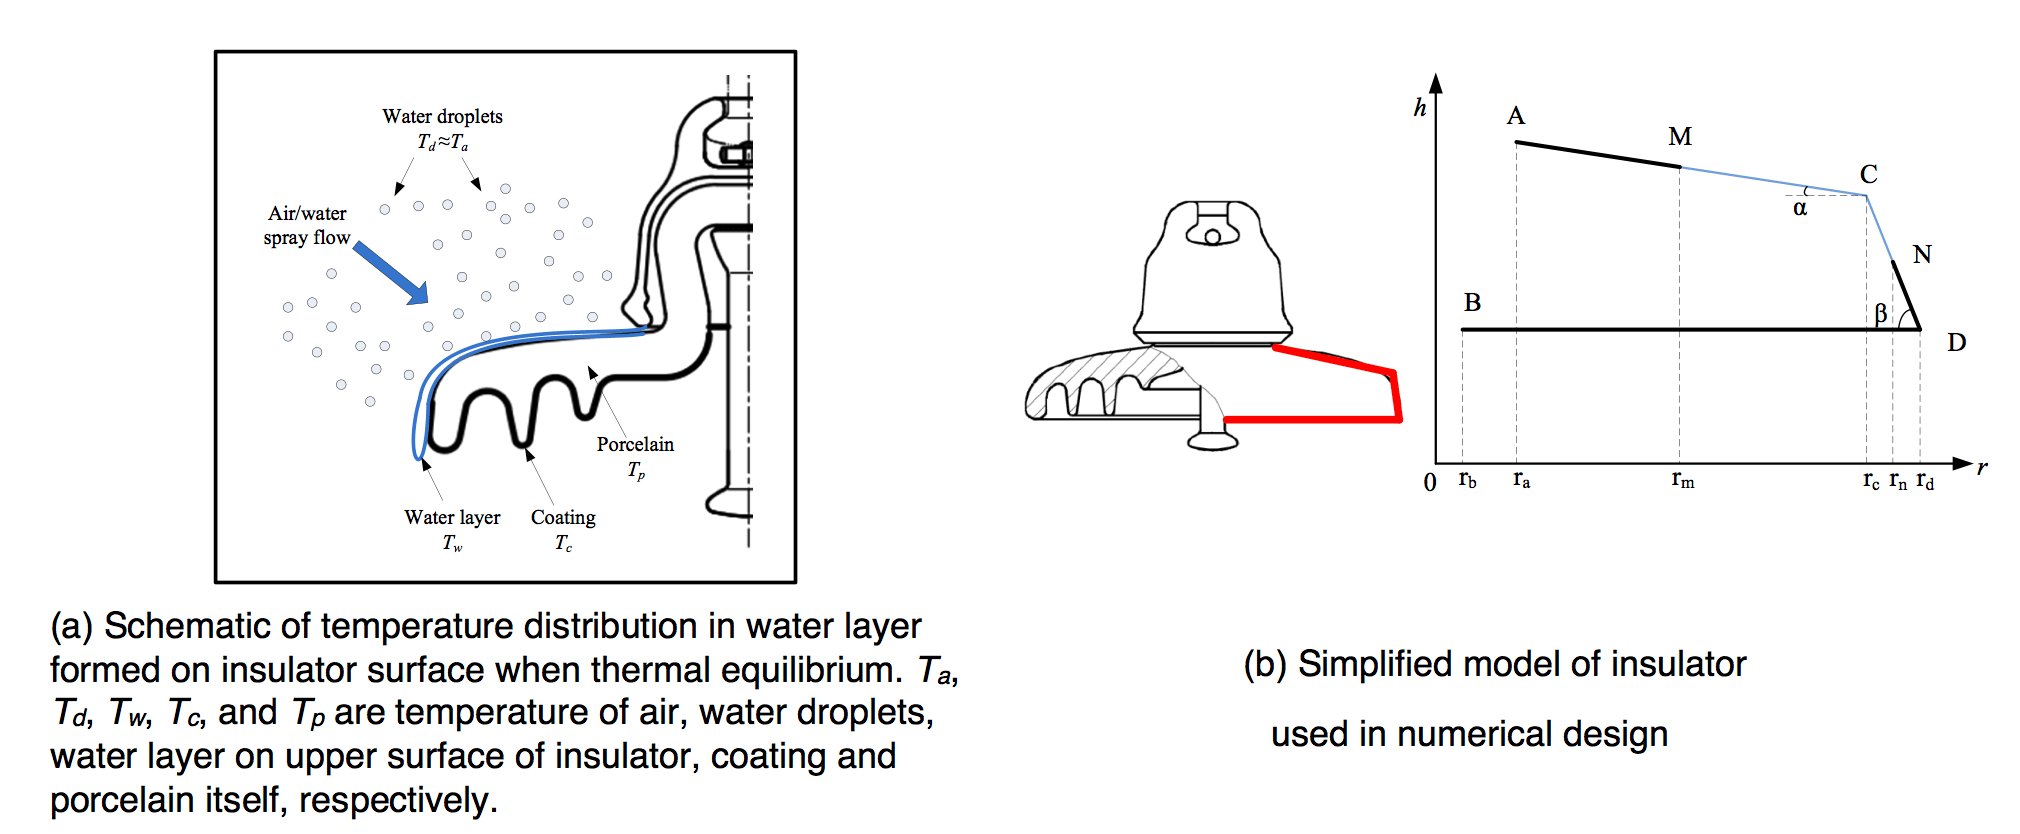
There are three stages in icing performance of insulator strings whose bottoms have been coated with a semi-conductive silicone rubber coating. When the whole insulator maintains a surface temperature higher than freezing, the insulator reaches thermal equilibrium, during which a liquid layer covers the non-coated area (as in Fig. 2a). The function of the water film is like a heat source that conducts the heat toward the water film and the porcelain part of the insulator and heat transfer with the air. Droplets ‘captured’ by the insulator are heated to above freezing and most then join the original water film to form a new liquid layer. In the meantime, some parts of the original water film drop off the edge of the insulator to maintain a water film of some thickness.
As a part of the circuit, the coating plays an important role in raising surface temperature. In essence, it is a thermodynamics problem expressed by the energy conservation equation. The energy was mainly divided into two parts, the energy loss due to the heat conduction, convection, radiation, and the evaporation of the water, and the heating power generated by the applied voltage and the leakage current. Therefore, it is not hard to calculate the surface temperature by using energy equation. Normally, the temperature can be used to evaluate the icing status of the insulator surface. In particular, temperature of the upper surface is a direct symbol of whether there is or is not ice accretion.
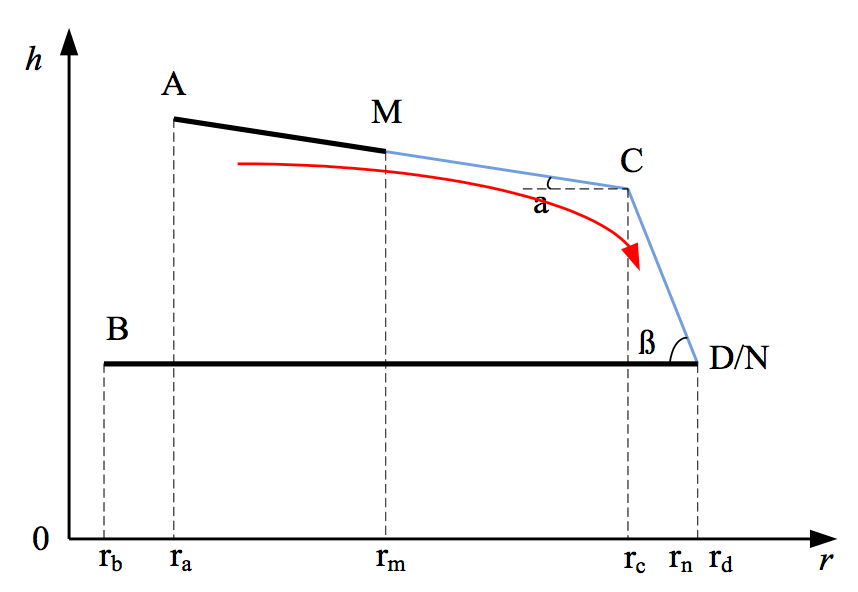
As stated, temperature of the insulator can be determined by the energy conversation. In order to determine surface temperature, a simplified model of the insulator was created as in Fig. 3b. For a normal cap & pin insulator, there is a gentler angle at most of the area on the upper surface, about 5°~10°, but 70°~90° near the edge. For cap & pin insulators, the angle between the upper surface and the horizontal line can be approximated by a two-angle surface, as per the red line shown in Fig. 3. Since the primary research area is the upper surface, the bottom surface was therefore assumed to be a horizontal plane surface, from edge of the insulator to pin connection. Meanwhile, since geometry of the insulator is an axis symmetric property, the simplified model can be represented by a two-dimensional object, as in Fig. 2. Simply put, in Fig. 3 the two-dimensional model included AC, CD and BD. The angle α and β denote the angle between the surfaces AC, CD and the horizontal surface. In addition, AM, ND and BD were treated with a semi-conductive coating, i.e. MC and CN remain the porcelain or glass surface. Based on this simplified model, heat generation can easily be formulated. It is also possible to evaluate the heat balance and temperature status of the upper surface. When leakage current flows on the insulator surface under applied voltage, Joule heating is generated. Heat dissipation by conduction, convection and by radiation also occurs. The temperature of the insulator increases and finally reaches thermal equilibrium when the generated heat equals that being dissipated. The temperature of the insulator coated with semiconductive coating under icing condition at the thermal equilibrium follows the equation:
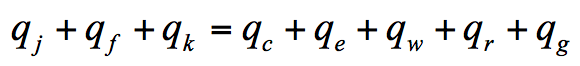
where qj (W): the heating power rate generated by the leakage current flowing through the insulator surface; qf (W): the aerodynamic heating; qk (W): the kinetic energy of impinging water droplets; qc (W): heat loss rate due to the heat convection form the water surface; qe (W): evaporative heat flux from the water surface; qw(W): heat loss rate due to the temperature rise of the water droplets impacting on the uncoated area; qr (W): energy loss from radiation; qg (W): heat flux flow through the glass plate.

Thermal Equilibrium Analysis
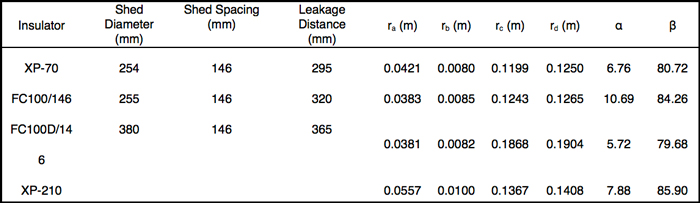
Normally, the only judgment to clarify whether there is successful anti-icing or not is that the surface temperature of the cap & pin insulator is over 0°C, i.e. the amount of the Joule heat generated is larger than the required energy to keep the surface over 0°C. As such, the first condition that needs to be satisfied is the overall heat energy is larger than the required energy. As the radial structure of the insulator, ice accretion are easily to cumulate at the edge of the insulator. In order to support enough heat to melt the ice layer or icicles at the edge, the power rate density at the edge of the insulator or at the edge of the uncoated area should be over than the required power density. The required power rate density is obtained by the energy conversation. We can calculate the coating resistivity and coating configuration subject to different icing conditions. For various kinds of cap & pin insulators, the structures are different, especially the diameter of the insulator which means the larger power rate density at the edge of the insulator. The parameters of the insulators and the responding model are shown in Table 1. It was found that the less coating area at the edge of the insulator the better since the power density of the uncoated area is larger than the coating area. Therefore, only Point M moved along the surface but Point N is fixed at Point D, which is shown in Fig. 4.
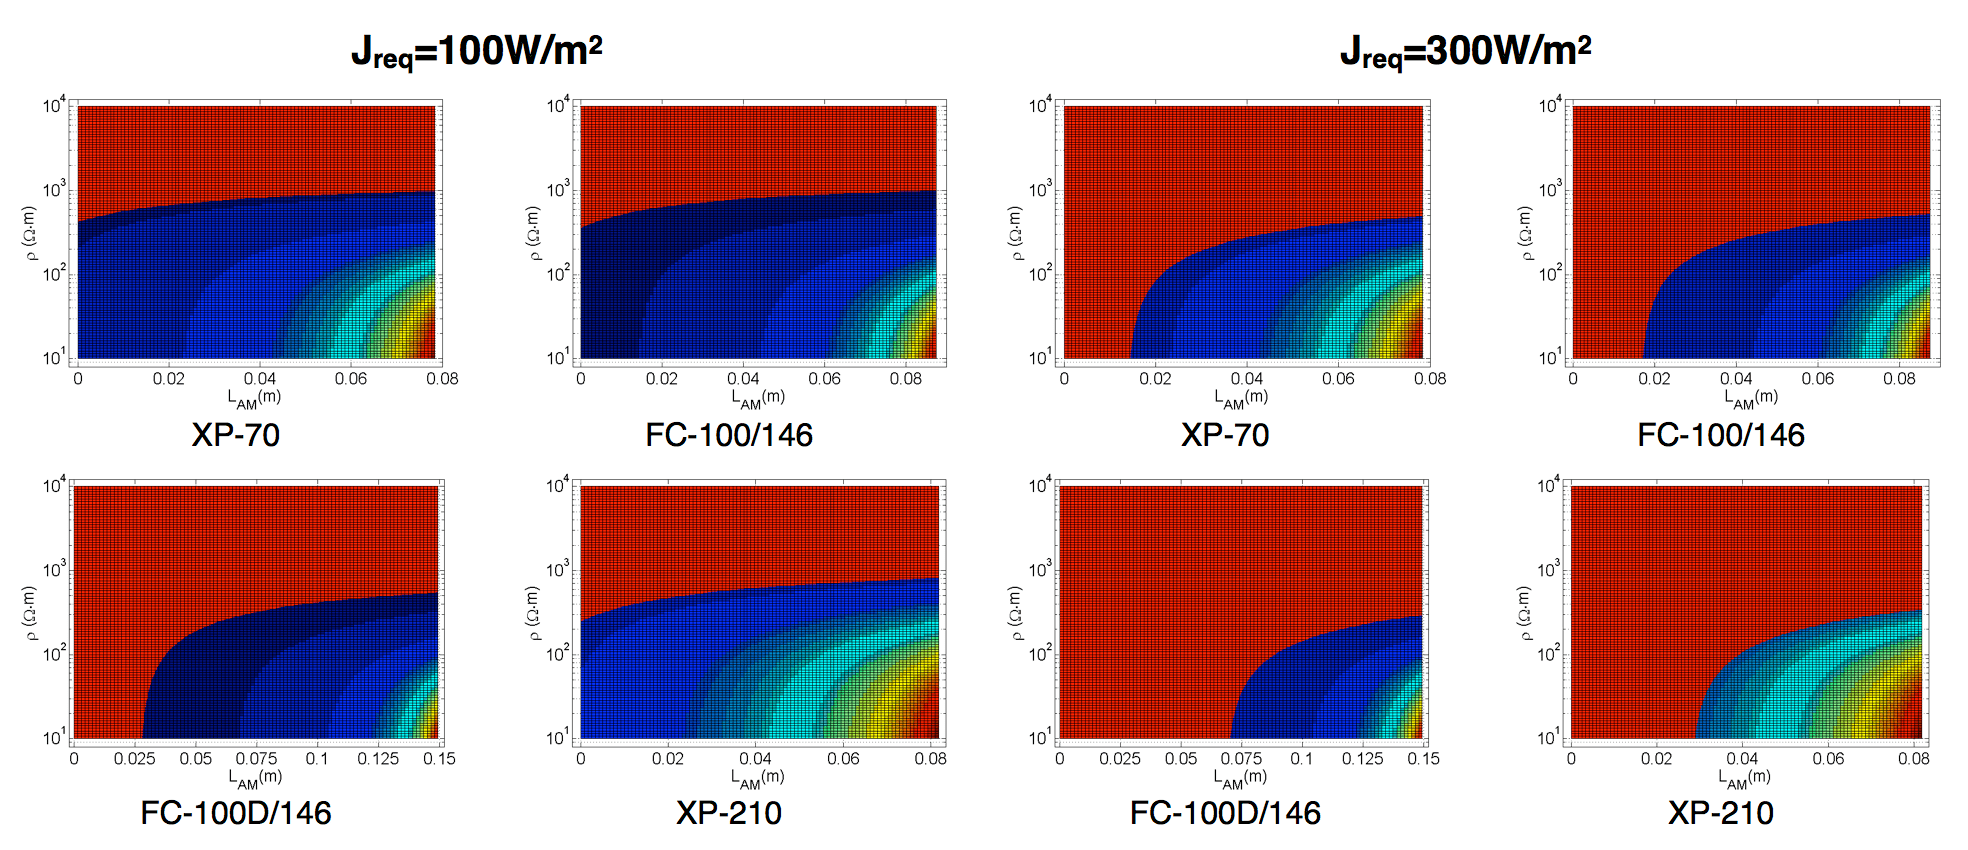
For various environmental conditions, the power density required can be calculated by the energy conversation equation. The numerical results are shown in Fig. 5. When the required power density is known, for example 100 or 300 W/m2, the scopes of the coating resistivity and configuration are shown in the figures. In each figure shown in Fig. 5, the red area determines area that below the required power density, which means the area below the red area is the satisfying area for anti-icing.
In Fig. 5, the suitable coating resistivity was below 103 Ω∙m, and it should decrease as shed diameter increases. In addition, the required length of AM also became shorter when required power density increased. For XP-70 and FC-100/146, the suitable area is the nearly the same because of the similar structure on the upper surface. For XP-210 and FC-100D/146, the diameters are 280 mm and 380 mm respectively. As can be seen, the suitable area for FC-100D/146 is smaller.
Coating Resistivity & Configuration
Coating resistance is an important factor in anti-icing performance under freezing conditions. The conductivity of the semi-conducting coating is sensitive to volume fraction of carbon black and to temperature. As such, coating resistance can be changed by adjusting concentration of carbon black in the preparation. The scope of volume resistivity used in the tests varied from 104 to 107 Ω∙cm. In order to evaluate the effect of the coating resistivity to anti-icing performance of the insulator during the cold condition, tests were carried out.
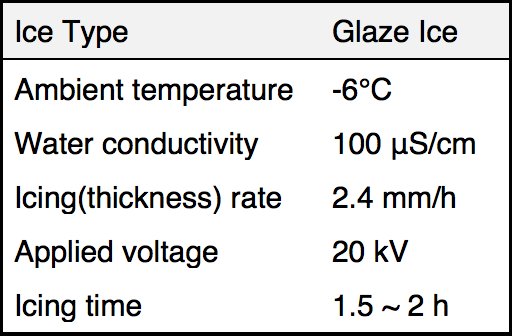
Experiments on icing performance for partially coated insulator strings were carried out in a climate chamber whose inner size is 1.8 m × 1.8 m × 2.8 m (length × width × height). Air temperature inside this chamber can be reduced to -20°C. This study focused on the wet regime of ice growth and the conditions summarized in Table 2 were chosen to mimic freezing rain. The experiments were performed by the following procedures. Weight of the ice accretion on the insulators was measured using a weight sensor.
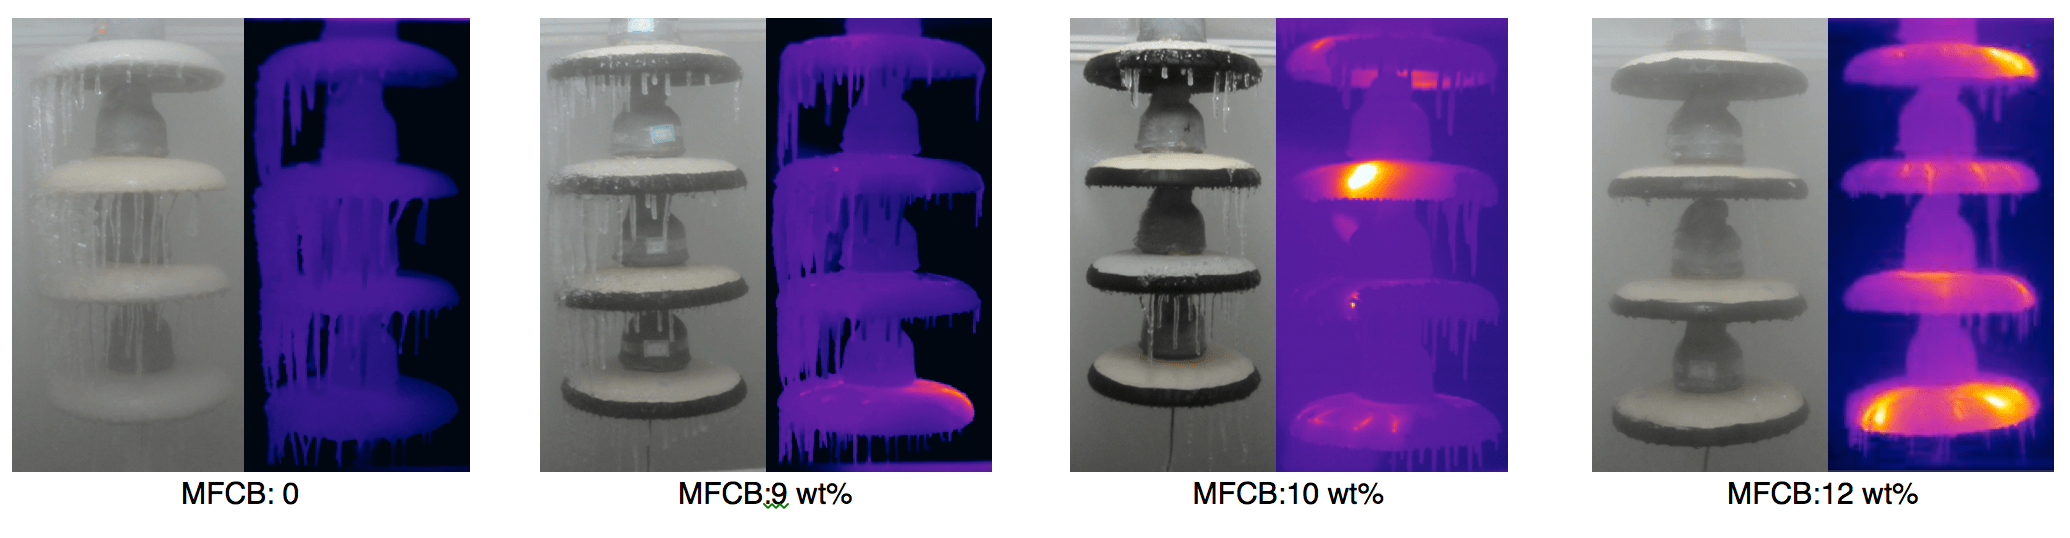
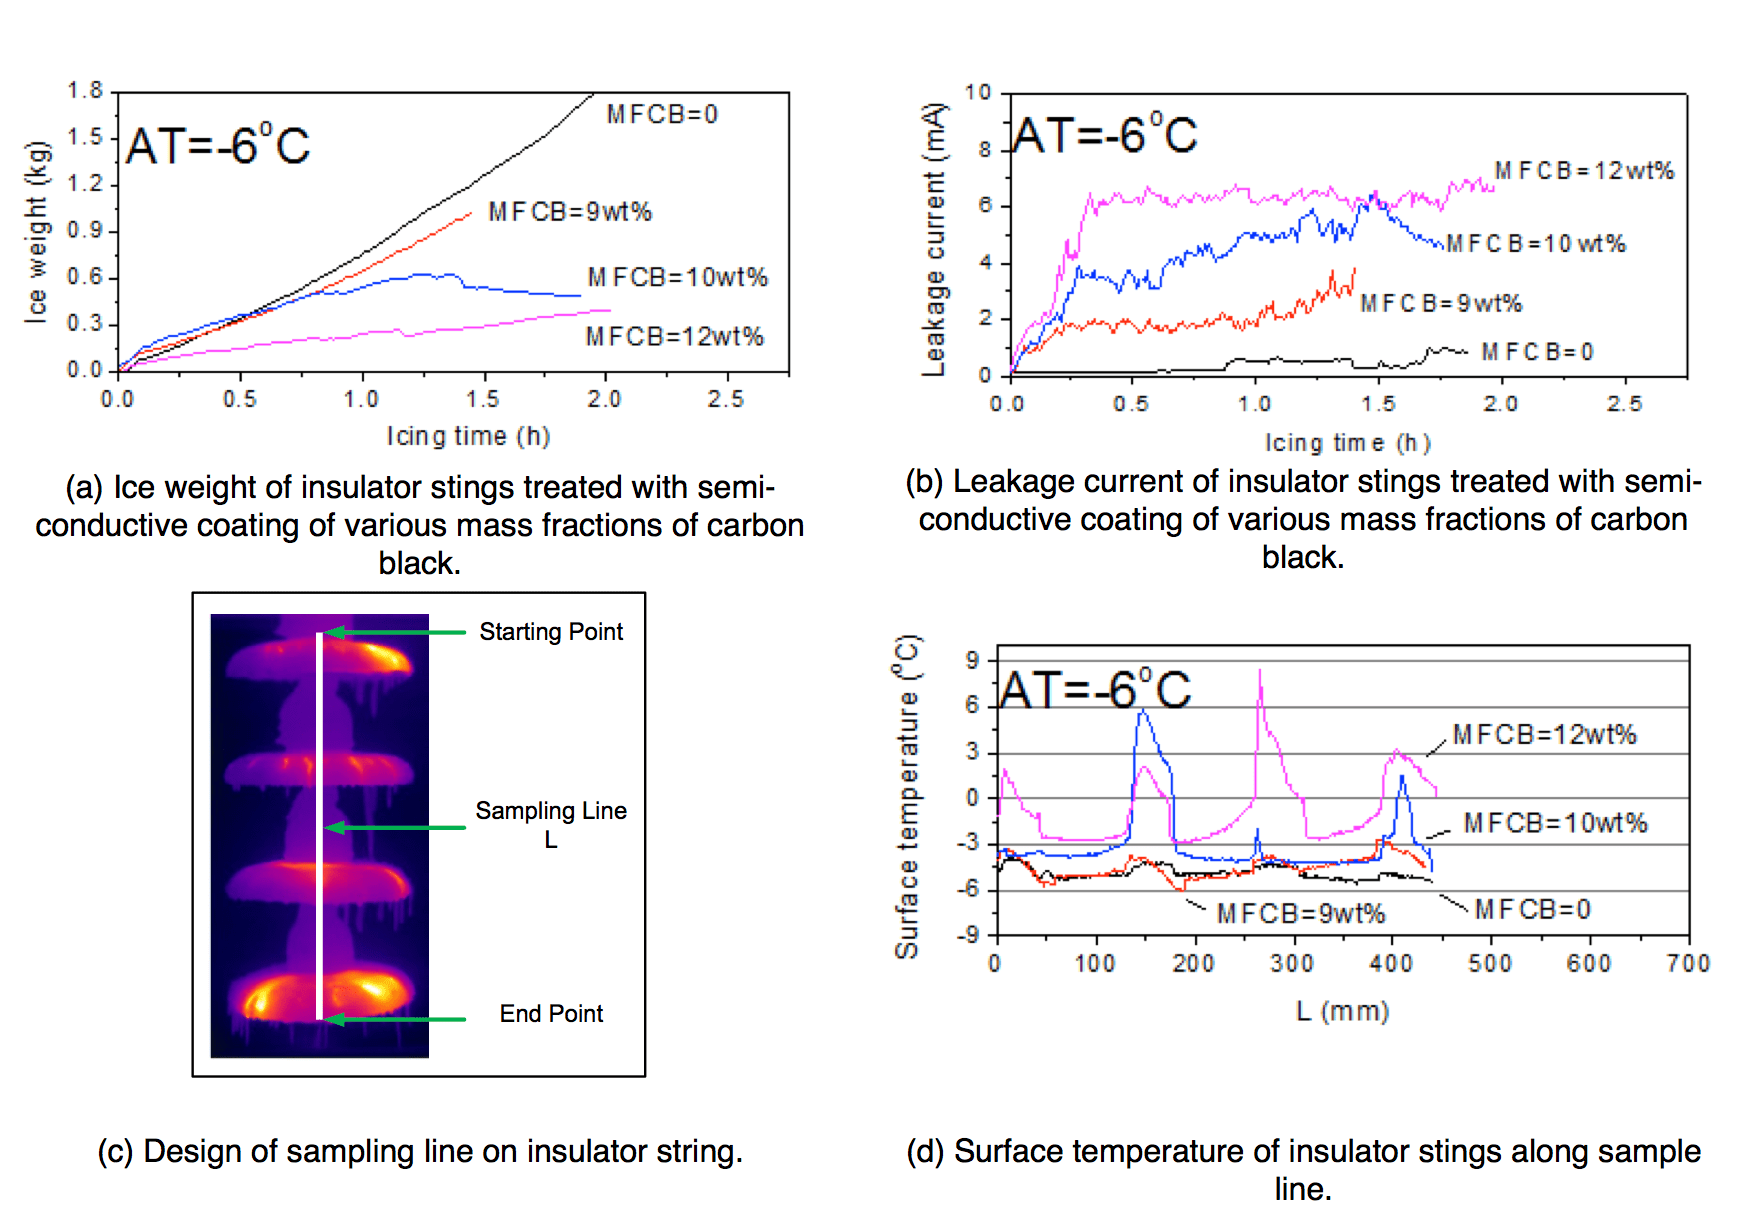
Figs. 6 & 7 shows the results. MFCB in these figures means the mass fraction of carbon black. Average icing rates of the insulators when MFCB=0 and MFCB=9wt% was enhanced to 0.18 kg/(h·unit) and 0.12 kg/(h·unit) respectively at -6 ºC, as shown in Fig. 7a. Icicles of the insulator string were bridged when the icing time was 1.5 hours. In the case of MFCB=10wt%, however, the ice accretion weight first increased and then decreased, with a largest icing rate of 0.077 kg/(h·unit). After a 2-hour icing test, the average icing rate of the insulator decreased to 0.019 kg/(h·unit), and most of the icicles fell off from the edge of the insulators. With a further lower of the volume resistivity, the icing rate dropped strikingly to 0.0039 kg/(h·unit) in the condition of MFCB=12wt%, which showed a surprising anti-icing performance.
Even though the temperature distribution of the insulator string was not uniform, for a rough comparison, a sampling line L was created to simply quantify the surface temperature (see Fig. 7c), which was coincided roughly with central axis of the insulator string in the thermograph. The sampling line started from the contact area of the cap and the porcelain body and ended at the edge of the upper surface of the insulator energized. Fig. 7d shows the temperature distribution along the sampling line of each insulator string, plotted by the actual length of the insulator string after conversion on the horizontal axis, and temperature along the sampling line L on the vertical. When the ambient temperature continued to reduce to -6°C, the requiring heat to compete with the main heat loss due to the convection and conduction was greatly increased. Though the leakage current was also 3 mA when MFCB=9wt%, the heat generated was not able to improve the surface temperature above 0°C, just as shown in Fig. 7b, the surface temperature was not very different from the no coating one. Then under the case of MFCB=10wt%, the leakage current could increase to 5 mA, and temperature of part of the insulator surfaces was over 0°C at the end of the test, leading to a good anti-icing performance. As the volume resistivity of the coating continued to reduce and the mass fraction of the carbon black was 12%, the leakage current stabilized at more than 6 mA.
Coating Configuration
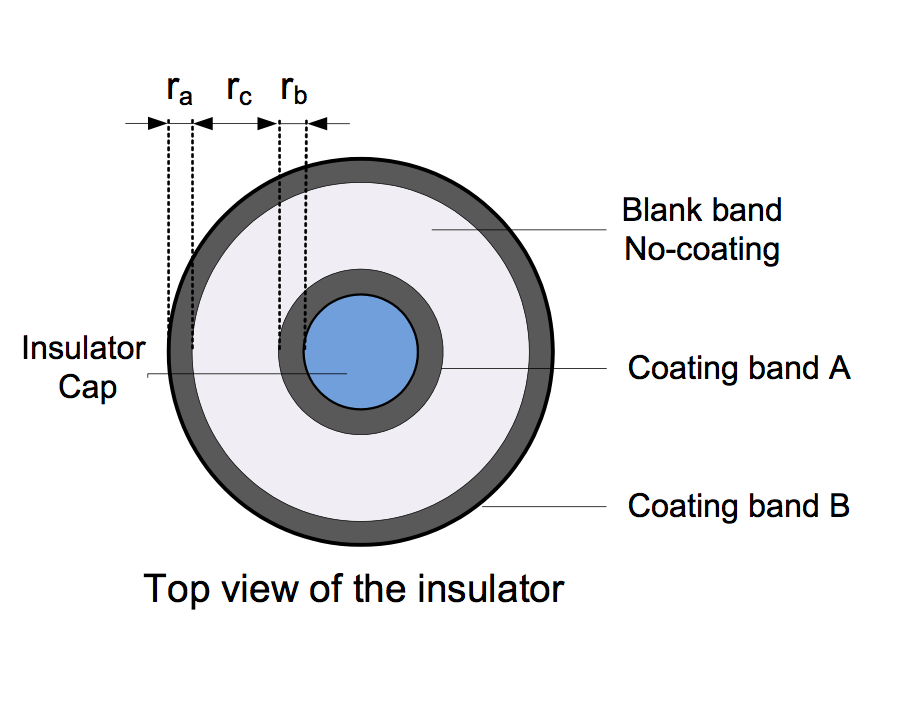
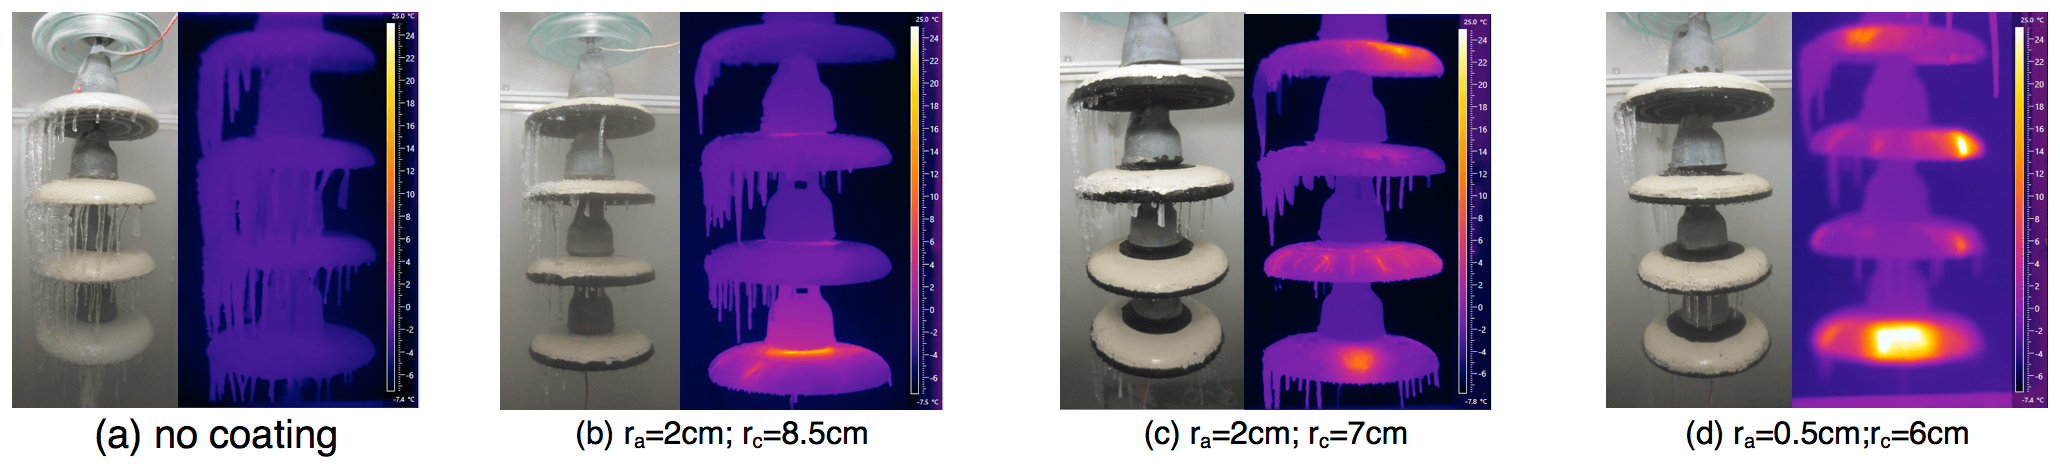
Actually, coating can also be applied on the top surface of the insulator rather than on the bottom surface only. The novel design is sketched in Fig. 8, which represents in the top view of the insulator partially treated with the coating. On the top surface, however, the whole porcelain or glass area is divided into three ring-shape bands: coating band A, coating band B and a blank band without any coating. The widths of the three bands are expressed as ra, rb, and rc, respectively. Three different configurations were tested by using the same conditions in Table 2. Figure 9 shows the icing appearance and infrared images of the short insulator strings after an icing process of 1.5 h. Fig. 10 presents the change in the weight of ice accretion during the icing process.
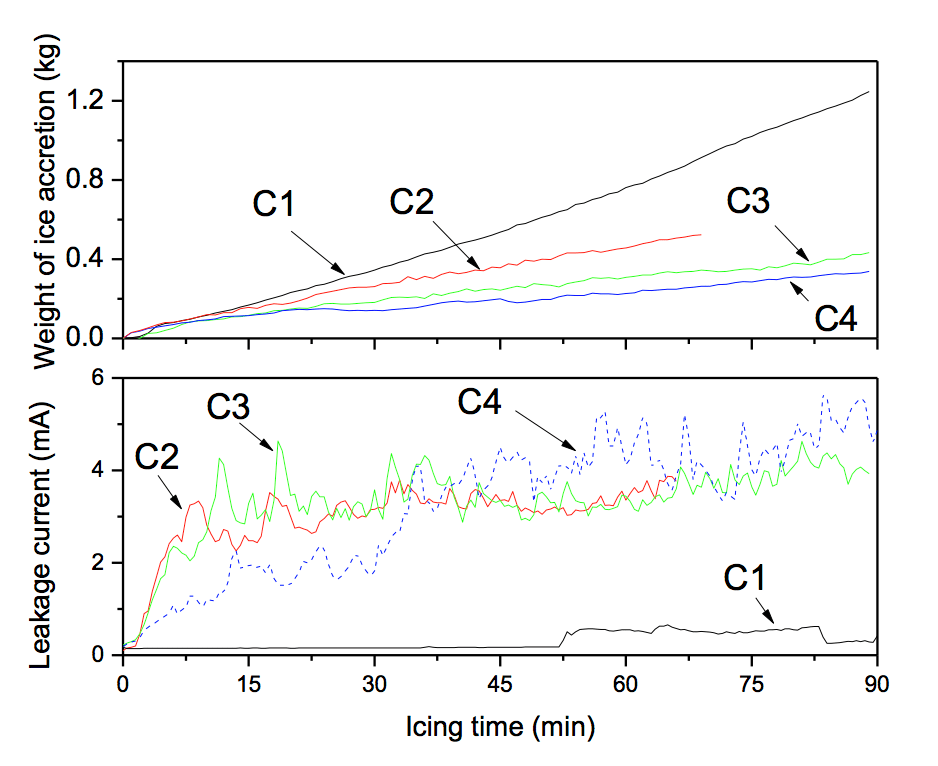
Compared to the uncoated insulator string, the three coating ones with the same volume resistivity can greatly prevent ice buildup during the icing tests at different levels, even with increasing units and more gaps. The temperature of most of the top surface of these three samples increased to above 0°C. In the last 5 minutes of the test when the leakage current was more stable, the leakage current of coated samples were measured to be 3.82 mA, 4.01 mA and 4.28 mA, respectively. The heating power rate was somewhat like of that of sample A3, but much lower than 0.03 MΩ. Therefore, the anti-icing capability will decline for long insulator strings.
For the latter two samples, with the same width of the coating at the edge of the insulator, the narrowing blank band increased the heating power rate. But for sample in Fig. 10c, the main heating area shifted to the external side from the adjacent area of the cap. The case is more obvious for sample in Figure 10(d), where the area with higher heating is closer to the edge of the insulator, in which case most of the ice layer can melt with more icicles dropping off.

Past Field Trial
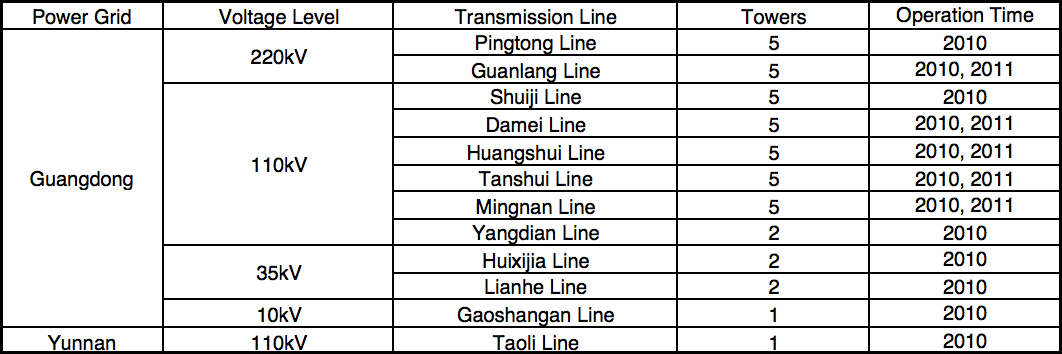
The semi-conductive silicone rubber coating was used on lines belonging to the Guangdong and Yunnan Grids. All lines selected in this trial were located at high altitude, in valleys and with smog and high air humidity. Icing disaster of transmission line in Yunnan and North Guangdong usually occur during the winter, which becomes the most important reason to select test lines in these areas. Table.1 shows the selected areas and lines (10 lines in Guangdong Grid and 1 in Yunnan Grid).
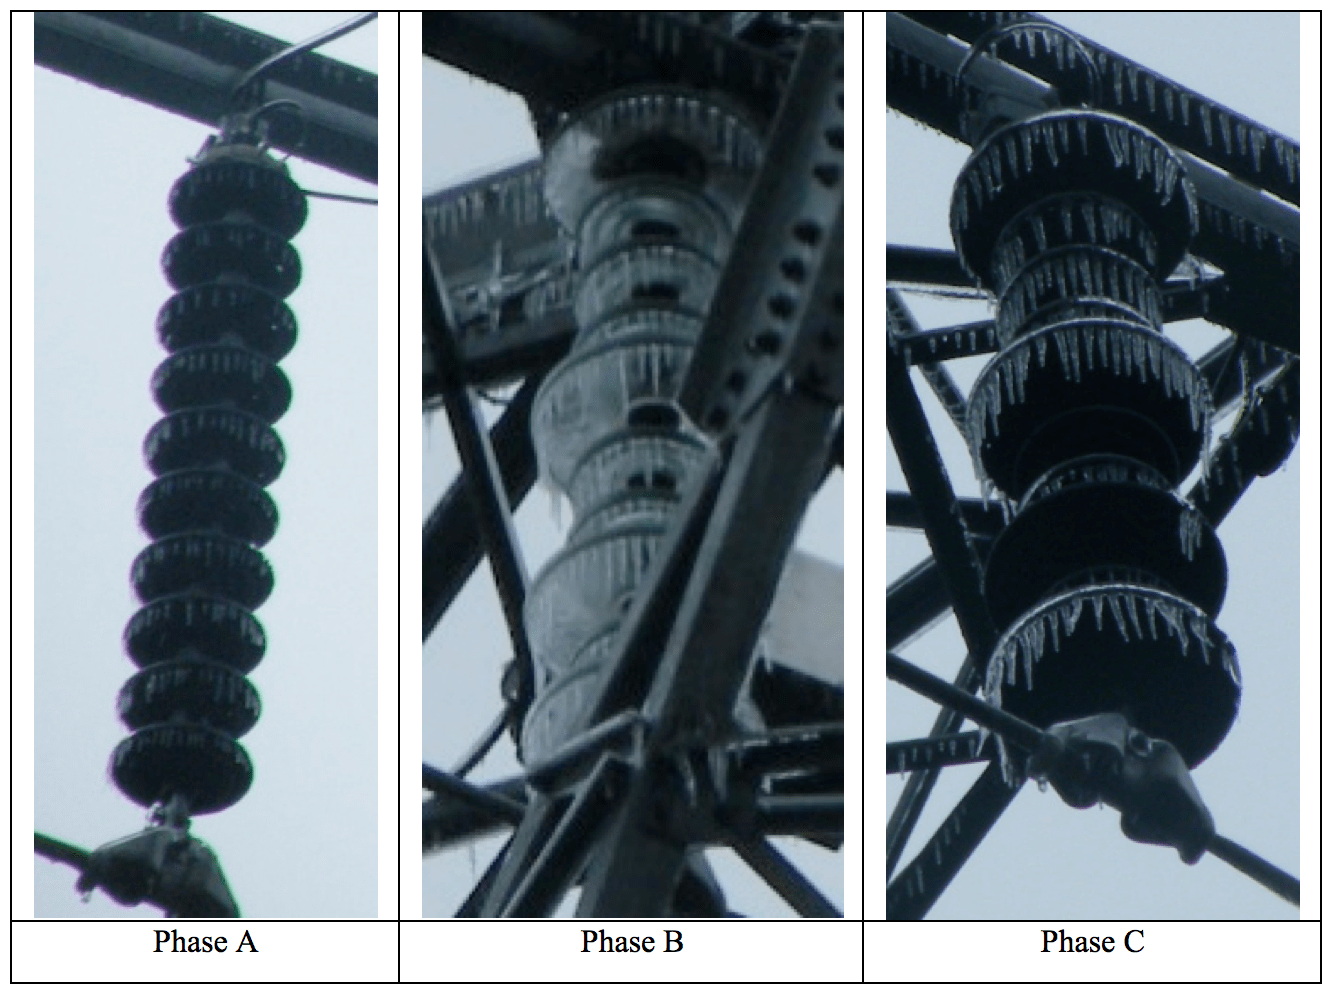
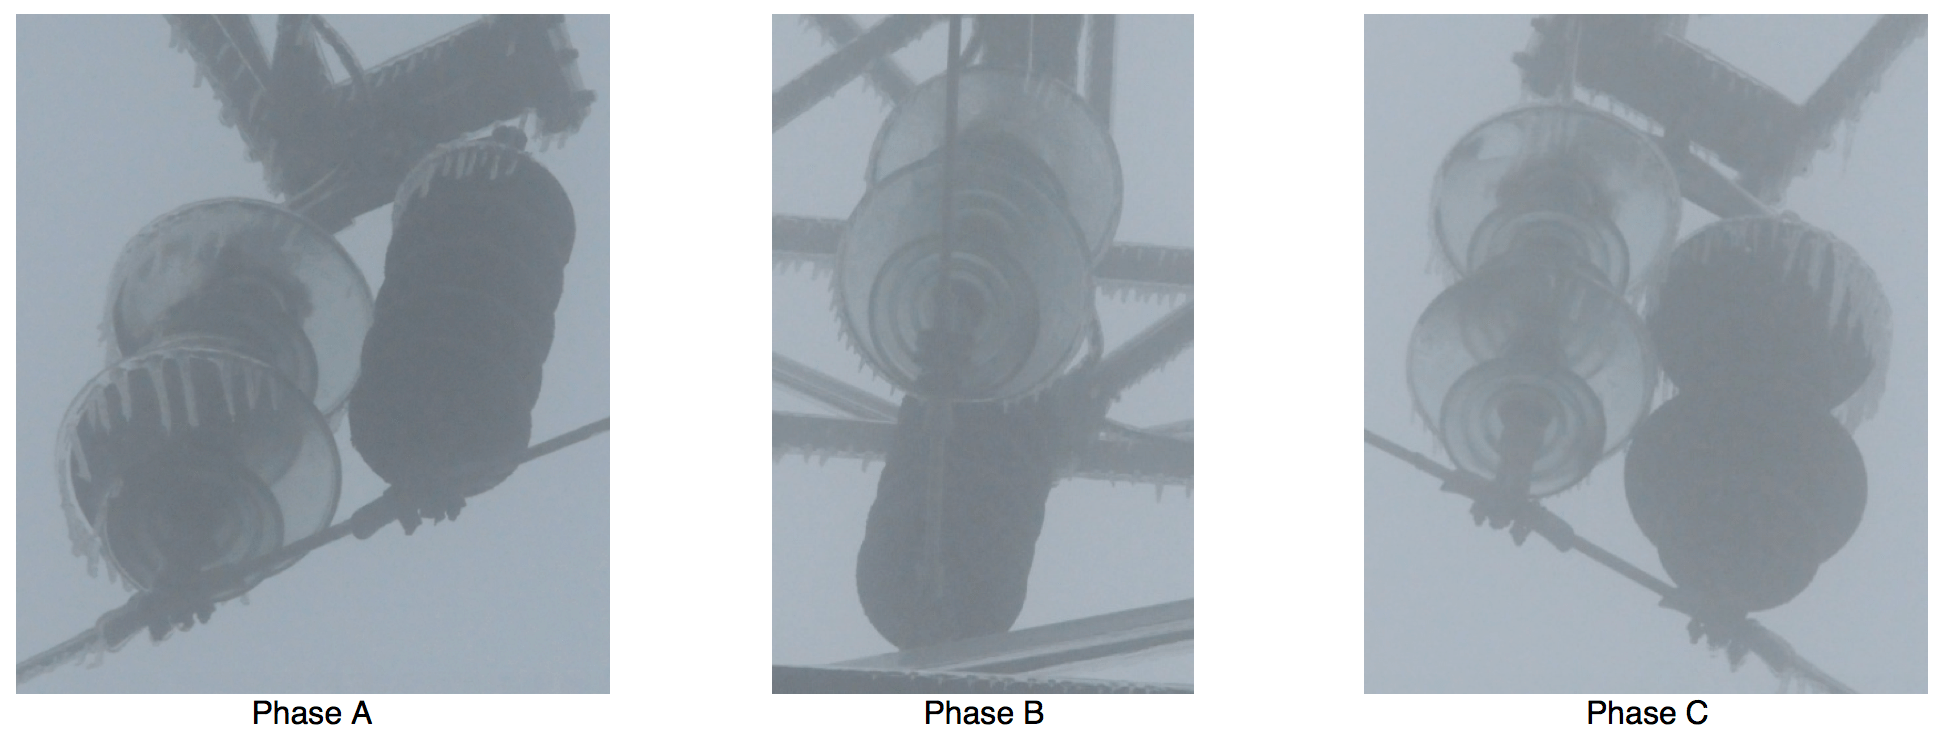
In Fig. 11, all these insulators are on the same tower of 35 kV Lianhe Line in Guangdong. The black ones are coated with semi-conductive silicone rubber. There are two strings in one phase. Before replacing the insulator strings, there are two strings with greater shed. In order to verify the anti-icing performance, one of the two insulator strings on Phase A and B is replaced with the coated insulator string without greater shed insulator, left the same on Phase C. From the picture, there was only very little ice on the coated insulator strings, in comparison to the pure one on the same phase. That shows that the conductive silicone rubber coating is really performing as a heater during freezing conditions and that the ice accretion on insulators is reduced to some extent. It is worthwhile to note that the amount of the ice on the one with greater shed was more than the string of the same insulators, just as shown in Phase A and B. This phenomenon was even more pronounced in Fig. 12, which shows the appearance of the ice accretion on the 100 kV lines. However, according to the test result in the climate room, the weight of the ice accreted on the insulator string on Phase C was also less than the pure one on Phase B.
Conclusions
• Use of semiconductive silicone rubber bottom coated on insulators can reduce the ice accretion while controlling power loss. Better anti-icing performance can be obtained by optimization of material and configuration;
• Appropriate coating resistance and configuration are necessary conditions for effective anti-icing but not the sufficient condition. The necessary maximum order of magnitude of the coating resistivity of the single insulator is below 103 Ωm in the recommended icing condition by IEEE Std 1783;
• The coating is better applied not only on the bottom side of the insulator but also on the upper surface. Under the condition presented, maximum distance of the uncoated area is about 5 to 7 cm;
• Anti-icing performance is affected by atmospheric parameters, including ambient temperature, freezing rain intensity and water conductivity;
• Conductivity of the coating is affected by ambient temperature and surface temperature caused by the heat effect. The conductivity decreases when placing in a high humidity environment. The trend can slow down by increasing the viscosity of the silicone rubber;
• Additional lines of research and development would focus on long-term ageing effects, optimal and repeatable application of the silicone rubber coating on selected surfaces and durability of the semi-conductive silicone rubber coating under continuous high voltage and outdoor insulator stress.