Deposition of wet dust and other contaminants on insulator surfaces significantly reduces insulation strength, particularly under heavy rain, salt fog and industrial pollution. Leakage current can increase, leading to arc discharges and eventually pollution flashovers.
Different techniques have been used to mitigate such risk including periodic insulator cleaning as well as measures to enhance insulation strength such as by applying RTV coatings or booster sheds. However, these tend to be labor-intensive and often limited by operational constraints of an energized transmission line. Performance of insulators under pollution will therefore depend on the intrinsic properties of their housing material.
Compared to ceramic insulators, composite polymeric insulators—particularly those made with silicone rubber—offer superior resistance to pollution flashover. Silicone insulators combine excellent hydrophobicity, resistance to chemical degradation, and excellent insulation properties, which makes them ideally suited for contaminated environments.
But a key element in the long-term performance of silicone insulators relates to their ability to regain their initial water-repellency should this property be temporarily suppressed or lost due to repeated exposure to contaminants and moisture. The recovery mechanism is essential to maintaining long-term performance in outdoor applications.
This edited contribution to INMR by experts at K-Line Insulators in Canada reports on findings of a study undertaken to compare hydrophobic recovery of silicone insulators supplied by different manufacturers after exposure to repetitive contamination cycles.
One of the most widely used and well-established methods to assess water repellency of polymeric materials is contact angle (CA) measurement between water droplet and polymer surface. Contact angle is defined as the angle at the intersection of the liquid–solid and liquid–vapor interfaces. The point where the solid, liquid, and vapor phases meet is known as the “three-phase contact line.” Generally, a small CA (<90°) indicates high wettability (hydrophilicity), while a large CA (>90°) indicates low wettability (hydrophobicity).
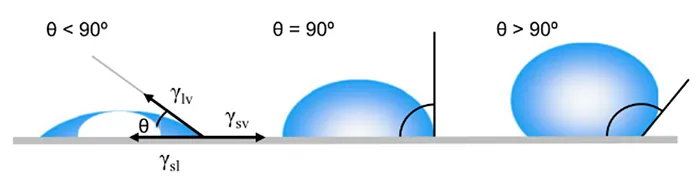
Interfacial tension between a solid and liquid (γsl) is governed by the surface tension of the liquid (γlv) and the surface energy of the solid (γsv). The surface tension of a liquid reflects the cohesive forces between its molecules, whereas the surface energy of a solid represents the strength of intermolecular attractions at its surface.
Assuming water is the liquid of interest, the CA between a water droplet and a solid surface is primarily determined by the solid’s surface energy, which is influenced by its chemical composition. Consequently, factors such as surface treatments, cleanliness, and contamination can significantly alter the solid’s surface energy and, thus, the CA.
Contaminants such as soluble dust and salts tend to exhibit high surface energy and hydrophilic behavior, leading to a shift in surface wettability from hydrophobic to hydrophilic once these accumulate on insulator surfaces. Silicone rubber is intrinsically hydrophobic, a critical property, given that presence of water can degrade electrical performance by reducing surface resistance. Hydrophobicity helps maintain insulation integrity by repelling moisture.
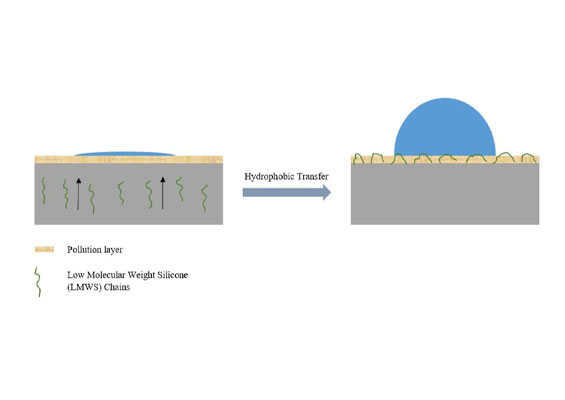
However, loss of hydrophobicity can diminish electrical insulation and pollution withstand as well as accelerate ageing of silicone insulators. Notably, rate of hydrophobicity recovery, which mitigates ageing effects, depends largely on presence and migration of low molecular weight siloxane (LMWS) chains within the material.

Low Molecular Weight Silicone Chains
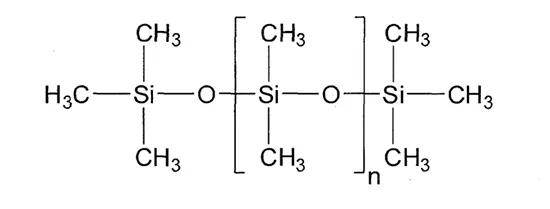
Surface hydrophobicity of high-temperature vulcanized (HTV) silicone rubber insulators plays a critical role in their superior performance. Compared to other organic polymeric insulation materials such as ethylene propylene diene monomer (EPDM), silicone insulators exhibit better suppression of leakage current and partial discharges under heavily contaminated conditions. This hydrophobicity arises from the material’s low surface energy (16 – 21 mN.m-1), which is attributed to the presence of methyl groups (-CH3) in its chemical structure.
Fig. 2 illustrates the chemical structure of polydimethylsiloxane (PDMS). PDMS chains are structured with siloxane bonds (Si-O) as the backbone and methyl groups (-CH3), as functional substituents. Among common organic substituents, the methyl group has the second-lowest critical surface tension—surpassed only by the fluoroethylene group (-CF3). As a result, hydrophobicity of silicone rubber is comparable to that of fluorinated polymers such as polytetrafluoroethylene (PTFE).
Surface hydrophobicity of HTV silicone rubber insulators can degrade over time due to factors such as corona discharge, dry band arcing, and the accumulation of dust or contaminants. The hydrophobic recovery of PDMS is attributed primarily to 3 mechanisms:
1. reorientation of methyl groups through conformational changes;
2. condensation of silanol groups during the crosslinking process; and
3. diffusion of LMWS to the surface.
Among these, presence and migration of LMWS from the bulk to the surface play a critical role in hydrophobic recovery of HTV silicone insulators (see Fig. 3). Notably, LMWS can migrate through the bulk material and form a hydrophobic film over surface contaminants—even under heavily polluted conditions—significantly enhancing long-term performance and stability of silicone insulators.
A deeper examination of silicone rubber’s molecular structure reveals that its broad molecular weight distribution of siloxane components underpins this unique property. Siloxane molecular weights can range from less than 25,000 g/mol for oil-like silicone fluids to over 500,000 g/mol for fully polymerized silicone chains. This range allows the smaller LMWS molecules to migrate more easily through the bulk material, provided they are evenly distributed. Migration to the surface reduces surface free energy, thereby restoring hydrophobicity.
Therefore, evaluating mobility of LMWS and hydrophobic recovery capability is essential to the long-term reliability of high voltage silicone insulators. To avoid need for costly maintenance procedures such as manual cleaning, the hydrophobicity transfer property becomes a critical operational characteristic for housing materials designed to maintain surface hydrophobicity under polluted conditions.
Efficiency of this migration depends on several factors:
1. LMWS concentration & molecular structure
More mobile, low-viscosity LMWS tend to migrate more quickly and uniformly.
2. Crosslink density & network architecture
Tightly cross-linked systems hinder LMWS mobility, thereby reducing recovery rates.
3. Filler content & type (e.g. ATH)
This can facilitate or obstruct LMWS diffusion, depending on dispersion and interfacial interactions.

Past research by K-Line Insulators used the method outlined in IEC 62217 ED3 to evaluate and compare the hydrophobic recovery of silicone insulators from different material manufacturers. In the present study, this work was extended to investigate the long-term hydrophobic recovery performance of the same 3 silicone rubber insulator manufacturer materials.
Several factors influence rate and effectiveness of hydrophobic recovery of silicone rubber insulators:
1. Temperature and Humidity
Elevated temperature and humidity levels can accelerate recovery by enhancing the mobility of LMWS.
2. Exposure Time & Contaminant Type
Duration of exposure and the nature of the contaminant impact the degree of recovery. Certain contaminants, such as salts or oils, may require prolonged exposure or higher temperatures for effective recovery.
3. Surface Roughness
Surface texture of the silicone rubber can influence hydrophobic recovery. Smoother surfaces generally show improved recovery characteristics.
4. Material Composition
Specific formulation of the silicone rubber inclu
Here, the focus was on exposure time and material composition as primary factors influencing long-term hydrophobic recovery of silicone rubber. Exposure time was evaluated through multiple contamination /recovery cycles. Each sample underwent repeated surface contamination until it could no longer regain its hydrophobic properties.
Methodology
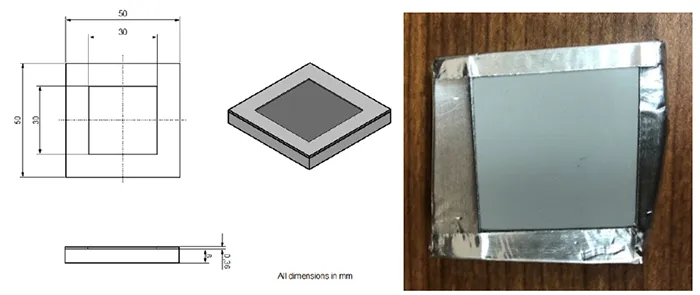
The Hydrophobicity Transfer Test was conducted in accordance with IEC 62217 ED 3 (Clause 9.3.5). Test samples were extracted from the sheds of the silicone insulator housings. Prior to testing, the samples were thoroughly cleaned using isopropyl alcohol to remove any mold release residues, followed by rinsing with deionized water. After cleaning, the samples were allowed to dry for at least 24h under standard laboratory conditions. To define the test area, the samples were covered with adhesive aluminum foil, leaving a 30 mm × 30 mm window exposed (see Fig. 4).
The pollution layer thickness for this test was determined by thickness of the foil. To achieve the required thickness of 0.36 mm, three layers of 0.12 mm aluminum foil were stacked on top of one another. A contamination slurry was then prepared and applied to the exposed window to simulate polluted conditions and evaluate hydrophobicity transfer behavior.

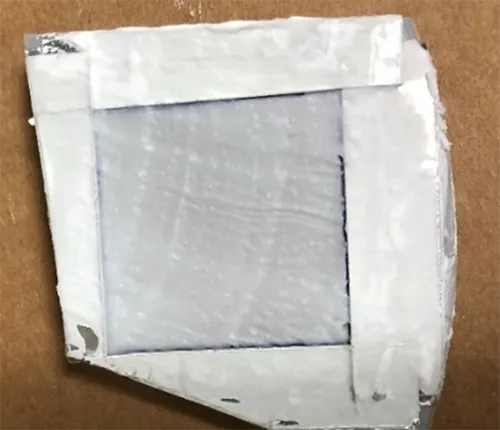
The slurry was prepared by mixing 7.5 g of untreated medium-grain silica powder (average particle size of 3 µm; CABOT, USA) with 3.5 mL of a water-isopropanol solution (65 vol% water, 35 vol% isopropanol). The mixture was stirred to ensure homogeneity. To minimize isopropanol evaporation, the slurry was applied to the surface immediately after preparation. Excess slurry was removed using a plastic stick to produce a smooth and uniform coating (see Fig. 5).
Contact angle (CA) measurements were performed using freely available software developed by the Biomedical Imaging Group, based at EPFL (École Polytechnique Fédérale de Lausanne). This research group has published two peer-reviewed studies presenting advanced methods for high-accuracy CA measurements. In this investigation, the Low Bond Axisymmetric Drop Shape Analysis (LB-ADSA) method was employed, which is based on fitting the Young–Laplace equation to droplet shape profiles extracted from image data. To ensure accuracy and reproducibility, water CA measurements were conducted at multiple locations on each sample. Average CA values and corresponding standard deviations were reported for all samples in this study.
Fourier Transform Infrared Spectroscopy (FTIR) was used to evaluate surface chemical composition during the hydrophobic recovery process. The analyses were carried out using a Cary 630 FTIR Spectrometer (Agilent, USA) in Attenuated Total Reflection (ATR) mode. Spectra were recorded across the infrared range of 400 to 4000 cm⁻¹ to capture relevant chemical functional groups present on the silicone rubber surfaces.
Results & Discussions
The surface wettability of the contaminated silicone surfaces of insulator manufacturers #1, #2, and #3 was monitored at specific intervals by measuring CA values (see Table 1). While the objective of the previous study was to determine rate of hydrophobic recovery after a single contamination cycle, the focus now was to evaluate the hydrophobic recovery rate over 5 consecutive contamination cycles.
All samples were initially hydrophobic, as expected, since the housing material was silicone rubber, which possesses intrinsic hydrophobicity. Following contamination, all samples became superhydrophilic (i.e., CA = 0°) due to the slurry covering the surface and masking the methyl groups responsible for the hydrophobic properties of the silicone rubber.
However, each sample exhibited different rates of hydrophobic recovery. On the first day after applying the contaminant slurry, Insulator Manufacturer #1 reached a CA of 38°, while Manufacturer #2 and Manufacturer #3 showed CAs of 22° and 18°, respectively. By the second day, the CAs had increased to 68° for Manufacturer #1, 38° for Manufacturer #2, and 22° for Manufacturer #3, indicating a faster recovery rate for Manufacturer #1. By the fourth day, Manufacturer #1 had regained its defined hydrophobic property level, whereas the other two samples had not yet recovered to the same extent.
To further evaluate the hydrophobic recovery of the other manufacturers, the samples were monitored over an extended period until their CAs approached a near-plateau. Manufacturer #2 eventually reached a nearly hydrophobic level, with a CA of 88 ± 2°. By contrast, Manufacturer #3 showed no significant change in CA, even after 32 days.
At this stage (i.e. 32 days after applying the first layer), the second layer of contamination was applied using the same procedure as the first, on top of the first layer. Overall, the hydrophobic recovery rate was slower compared to the first contamination cycle. After four days, only Manufacturer #1 approached a near-hydrophobic CA (85 ± 3°). By day eight, Manufacturer #1 had reached a fully hydrophobic CA of 94 ± 2°, while Manufacturer #2 had only reached 80 ± 4°. Manufacturer #2 eventually reached a near-hydrophobic CA of 88 ± 1° after 16 days. Manufacturer #3 recovered to approximately the same CA level it had reached after the first contamination cycle, showing limited improvement.
The experiments proceeded with the third layer of contamination (i.e. 16 days after applying the second layer). At this stage, there was a longer delay in the hydrophobic recovery across all manufacturers’ materials. It took 10 days for Manufacturer #1 to reach a hydrophobic CA level. However, even after 16 days, neither of the other two manufacturers’ materials were able to reach full recovery.
The decline in hydrophobic recovery continued with the application of the fourth contamination layer. It took 20 days for Manufacturer #1 to regain its hydrophobicity, while Manufacturer #2 and #3 reached a CA of 84 ± 2° and 19 ± 3° by that time, respectively. In the fifth contamination cycle, it took 22 days for Manufacturer #1 to regain its hydrophobicity. Manufacturer #2 recovered to nearly the same level as in the fourth cycle, reaching a CA of 83 ± 2°. Manufacturer #3, however, completely lost its ability to recover hydrophobicity.
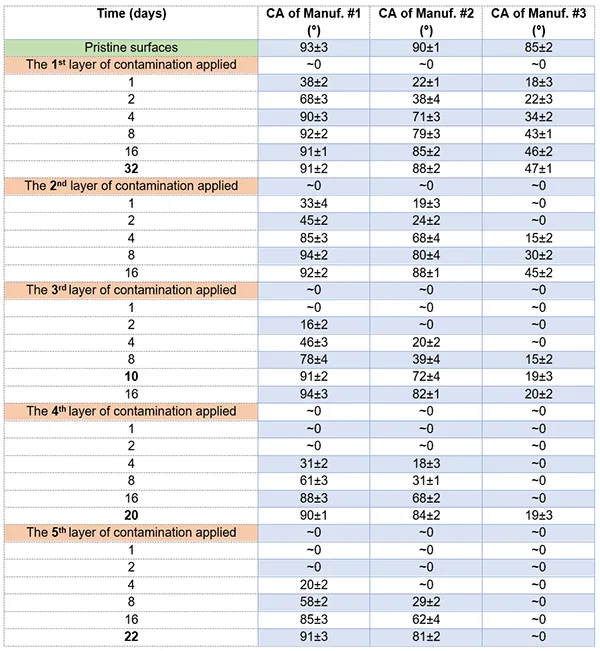
Fig. 6 summarizes time-dependent hydrophobic recovery of the 3 silicone rubber insulator materials from different manufacturers over 5 contamination cycles.
Manufacturer #1:
• Initial Recovery (Cycle 1): Fastest recovery among all; reached full recovery by Day 4.
• Cycle 2: Recovery slowed slightly; reached near-hydrophobic CA (85 ± 3°) by Day 4 and full hydrophobicity (94 ± 2°) by Day 8.
• Cycle 3: Recovery deteriorated further; took 10 days to regain hydrophobicity.
• Cycle 4: Required 20 days to recover.
• Cycle 5: Took 22 days to regain hydrophobicity.
• Trend: Progressive degradation in recovery rate, but still able to fully recover in each cycle.
Manufacturer #2:
• Initial Recovery (Cycle 1): Moderate recovery; CA reached 22° on Day 1, 38° on Day 2, and near-hydrophobic level (88 ± 2°) after extended time.
• Cycle 2: Reached 80 ± 4° by Day 8 and 88 ± 1° by Day 16.
• Cycle 3: Recovery slowed further.
• Cycle 4: Achieved CA of 84 ± 2° by Day 20.
• Cycle 5: Recovered to a similar level as Cycle 4 (83 ± 2°) after 22 days.
• Trend: Slower and less consistent recovery with each cycle; did not reach full hydrophobicity in later cycles.
Manufacturer #3:
• Initial Recovery (Cycle 1): Weak recovery; CA reached only 18° on Day 1 and showed minimal improvement after 32 days.
• Cycle 2: Reached similar CA as in Cycle 1; no significant improvement.
• Cycle 3: Continued limited recovery.
• Cycle 4: No specific improvement observed.
• Cycle 5: Completely lost ability to recover hydrophobicity.
• Trend: Consistently poor hydrophobicity recovery, with performance degrading further in later cycles.
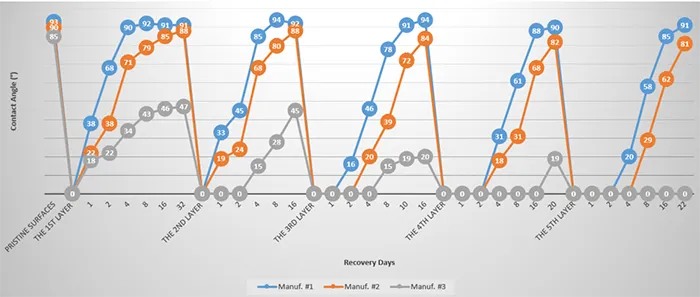

Fig. 7 shows the ATR FTIR absorption spectra of silicone rubber insulators from the three manufacturers before contaminant slurry application. The absorbance peaks observed at approximately 1000-1110 cm-1, 805-855 cm-1, and 1245-1275 cm-1, correspond to the molecular vibrations of the Si-O-Si symmetric stretch, Si(CH3)2 symmetric stretch, and Si(CH3) groups, respectively. Additionally, the broad peak between 3000-3500 cm-1 is attributed to the molecular vibrations of aluminum trihydrate (ATH) particles present in the samples.
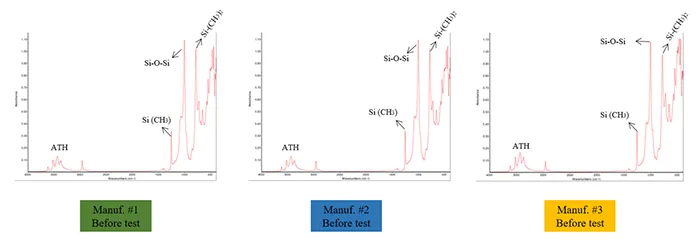
Fig. 8 illustrates the evolution of surface chemical bonds for the three silicone rubber insulator manufacturers on the 2nd and 4th days after the first layer of contaminant slurry application. The significantly higher CA observed for Manufacturer #1 after 2 days is attributed to the emergence of Si(CH3) peaks in its FTIR spectrum. By day 4, the FTIR spectrum of Manufacturer #1 closely resembles its pre-test profile, which explains the high CA value of approximately 90°. Manufacturer #2 began showing Si(CH3) peaks by day 4, corresponding to an increased CA of 79°. In contrast, Manufacturer #3 exhibited no significant spectral change over the 4-day period, aside from a slight increase in the Si(CH3)2 peak, resulting in a modest increase its CA (34°).
The observed FTIR spectral changes provide insight into the hydrophobic recovery mechanisms of the silicone rubber surfaces. The presence and intensity of Si–CH₃ related peaks serve as indicators of the surface’s hydrophobic methyl groups, which are responsible for water repellency. For Manufacturer #1, the rapid reappearance of these Si(CH₃) peaks within four days suggests efficient migration or reorientation of low molecular weight siloxane chains to the surface, restoring the hydrophobic character.
This molecular-level recovery aligns with the significant increase in contact angle observed. Manufacturer #2’s slower and less pronounced Si(CH₃) peak development reflects a more gradual or limited re-establishment of hydrophobic methyl groups at the surface, consistent with its intermediate contact angle recovery. Conversely, Manufacturer #3 showed minimal spectral changes, indicating a poor recovery of hydrophobic groups on the surface. This lack of significant molecular reorganization likely results in its persistently low contact angle and weak hydrophobic recovery.
Overall, FTIR data confirm that the recovery of surface hydrophobicity is closely linked to the regeneration of methyl group functionality on the silicone rubber surface. This process is influenced by the availability and mobility of low molecular weight species within the bulk material, which differs among manufacturers’ different formulations and contamination cycles.
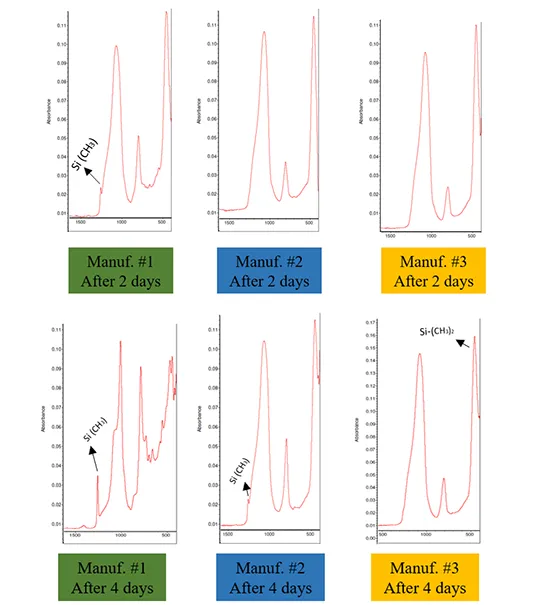
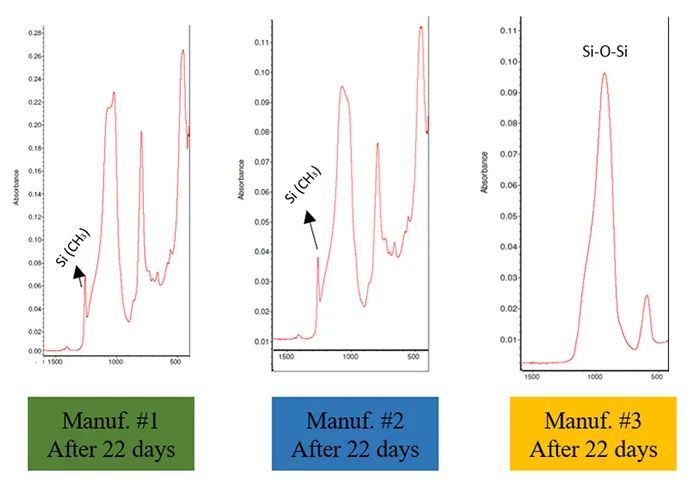
Fig. 9 illustrates the evolution of surface chemical bonds in silicone rubber samples from three manufacturers, measured 22 days after the 5th application of contaminant slurry. The FTIR spectra align with the CA measurements. Manufacturer #1 exhibited stronger Si(CH₃) and Si(CH3)2 peaks, correlating with higher CA values. In contrast, Manufacturer #2 displayed the same peaks but at much lower intensity, resulting in reduced hydrophobicity. This observation suggests that Manufacturer #2 had a weaker recovery performance compared to Manufacturer #1, potentially due to differences in crosslink structures, crosslink density, the availability and type of LMWS, and the migration rate of LMWS to the surface. The chemical bonds in Manufacturer #3 closely resembled those of silica powder, indicating a failure to recover hydrophobicity. This suggests that Manufacturer #3 lacked sufficient LMWS in the bulk material to migrate to the surface and mask the contaminant layer.

Summary & Outlook
This research evaluated the hydrophobic recovery behavior of silicone rubber insulators from 3 manufacturers subjected to 5 repeated contamination cycles. Findings, derived from time-resolved contact angle (CA) measurements and FTIR spectroscopy, offer insight into the degradation and re-generation mechanisms of surface hydrophobicity under environmental stress.
Key Observations:
1. Manufacturer #1 material consistently demonstrated superior hydrophobic recovery, with rapid restoration of surface methyl groups, as indicated by the early and strong reappearance of Si(CH₃) and Si(CH₃)₂ peaks in FTIR spectra. Even though the recovery rate gradually declined with successive contamination cycles—requiring up to 22 days in the 5th cycle—this material was still able to fully restore its initial hydrophobicity in all cases.
2. Manufacturer #2 material showed moderate performance, with increasingly delayed and incomplete recovery in later cycles. The FTIR spectra revealed delayed development of methyl group peaks and lower peak intensity overall, suggesting that either the quantity or mobility of low molecular weight siloxanes was limited. By the 5th cycle, although a near-hydrophobic state was reached (CA ≈ 83°), the surface never fully regained its pristine hydrophobic condition, even after 22 days.
3. Manufacturer #3 material failed to recover hydrophobicity after repeated contamination, with contact angles remaining near zero from the 3rd cycle onward. FTIR data supported this finding by showing little to no regeneration of methyl-functional groups, implying an absence or exhaustion of LMW chains in the bulk. This suggests that the material either lacked sufficient LMW species from the outset or that its cross-linked network restricted migration of these molecules to the surface.
These results emphasize that not all silicone rubber insulator materials offer equivalent long-term performance in polluted environments. They also illustrate that some materials that perform well after a single contamination cycle may still degrade significantly under repeated exposure.
REFERENCES
1. Hu, Y.Y., X. Yu, G.G. Wang, and M. Lu, Surface Wettability of the Contaminative Silicone Rubber. Applied Mechanics and Materials, 2014. 675: p. 31-37.
2. Yu, J., et al., Rapid hydrophobicity recovery of contaminated silicone rubber using low-power microwave plasma in ambient air. Chemical Engineering Journal, 2023. 465: p. 142921.
3. Papailiou, K. and F. Schmuck, Silicone composite insulators. 2013: Springer.
4. Vasudev, N., et al. Long term ageing performance of Silicone rubber insulators under different conditions. in 2009 IEEE 9th International Conference on the Properties and Applications of Dielectric Materials. 2009. IEEE.
5. Hillborg, H., M. Sandelin, and U.W. Gedde, Hydrophobic recovery of polydimethylsiloxane after exposure to partial discharges as a function of crosslink density. Polymer, 2001. 42(17): p. 7349-7362.
6. Homma, H., et al., Diffusion of low molecular weight siloxane from bulk to surface. IEEE Transactions on Dielectrics and Electrical Insulation, 1999. 6(3): p. 370-375.
7. Yuan, Y. and T.R. Lee, Contact angle and wetting properties, in Surface science techniques. 2013, Springer. p. 3-34.
8. Jothi Prakash, C. and R. Prasanth, Approaches to design a surface with tunable wettability: a review on surface properties. Journal of Materials Science, 2021. 56: p. 108-135.
9. Amin, M., M. Akbar, and S. Amin, Hydrophobicity of silicone rubber used for outdoor insulation (an overview). Rev. Adv. Mater. Sci, 2007. 16(1-2): p. 10-26.
10. Zhu, Y., M. Otsubo, C. Honda, and S. Tanaka, Loss and recovery in hydrophobicity of silicone rubber exposed to corona discharge. Polymer degradation and stability, 2006. 91(7): p. 1448-1454.
11. Maghsoudi, K., Carreira, A.J., Hydrophobic Recovery of HTV Silicone Rubber Insulators. INMR Woorld Congress, 2023.
12. IEC 62217 ED3: Polymeric HV insulators for indoor and outdoor use – General definitions, test methods, and acceptance criteria. 2019.
13. http://bigwww.epfl.ch/demo/dropanalysis/.
14. Stalder, A.F., et al., Low-bond axisymmetric drop shape analysis for surface tension and contact angle measurements of sessile drops. Colloids and Surfaces A: Physicochemical and Engineering Aspects, 2010. 364(1-3): p. 72-81.
15. Stalder, A.F., et al., A snake-based approach to accurate determination of both contact points and contact angles. Colloids and surfaces A: physicochemical and engineering aspects, 2006. 286(1-3): p. 92-103.
16. Maghsoudi, K., G. Momen, R. Jafari, and M. Farzaneh, Direct replication of micro-nanostructures in the fabrication of superhydrophobic silicone rubber surfaces by compression molding. Applied Surface Science, 2018. 458: p. 619-628.