The voltage-current (VI) characteristic of its varistor is one of the most important parameters of any surge arrester. Still, most arrester users do not see this characteristic represented in graphical form; rather only as tables of discharge and reference voltages. Looking more deeply ‘behind’ such tables and to the data that actually create an arrester’s specifications is also useful. The VI characteristic shows the conductivity or resistance of a varistor/arrester. To begin with, for any given voltage or current, there is a corresponding current or voltage. The varistor derives its name from the fact that it acts as a variable resistor whose resistance depends mainly on applied voltage, i.e. the higher this voltage, the lower the resistance. Indeed, it is this very characteristic that makes surge protection using varistors possible in the first place. Most physicists and material scientists refer to three separate regions of a varistor’s operation: pre-breakdown, breakdown and high current.
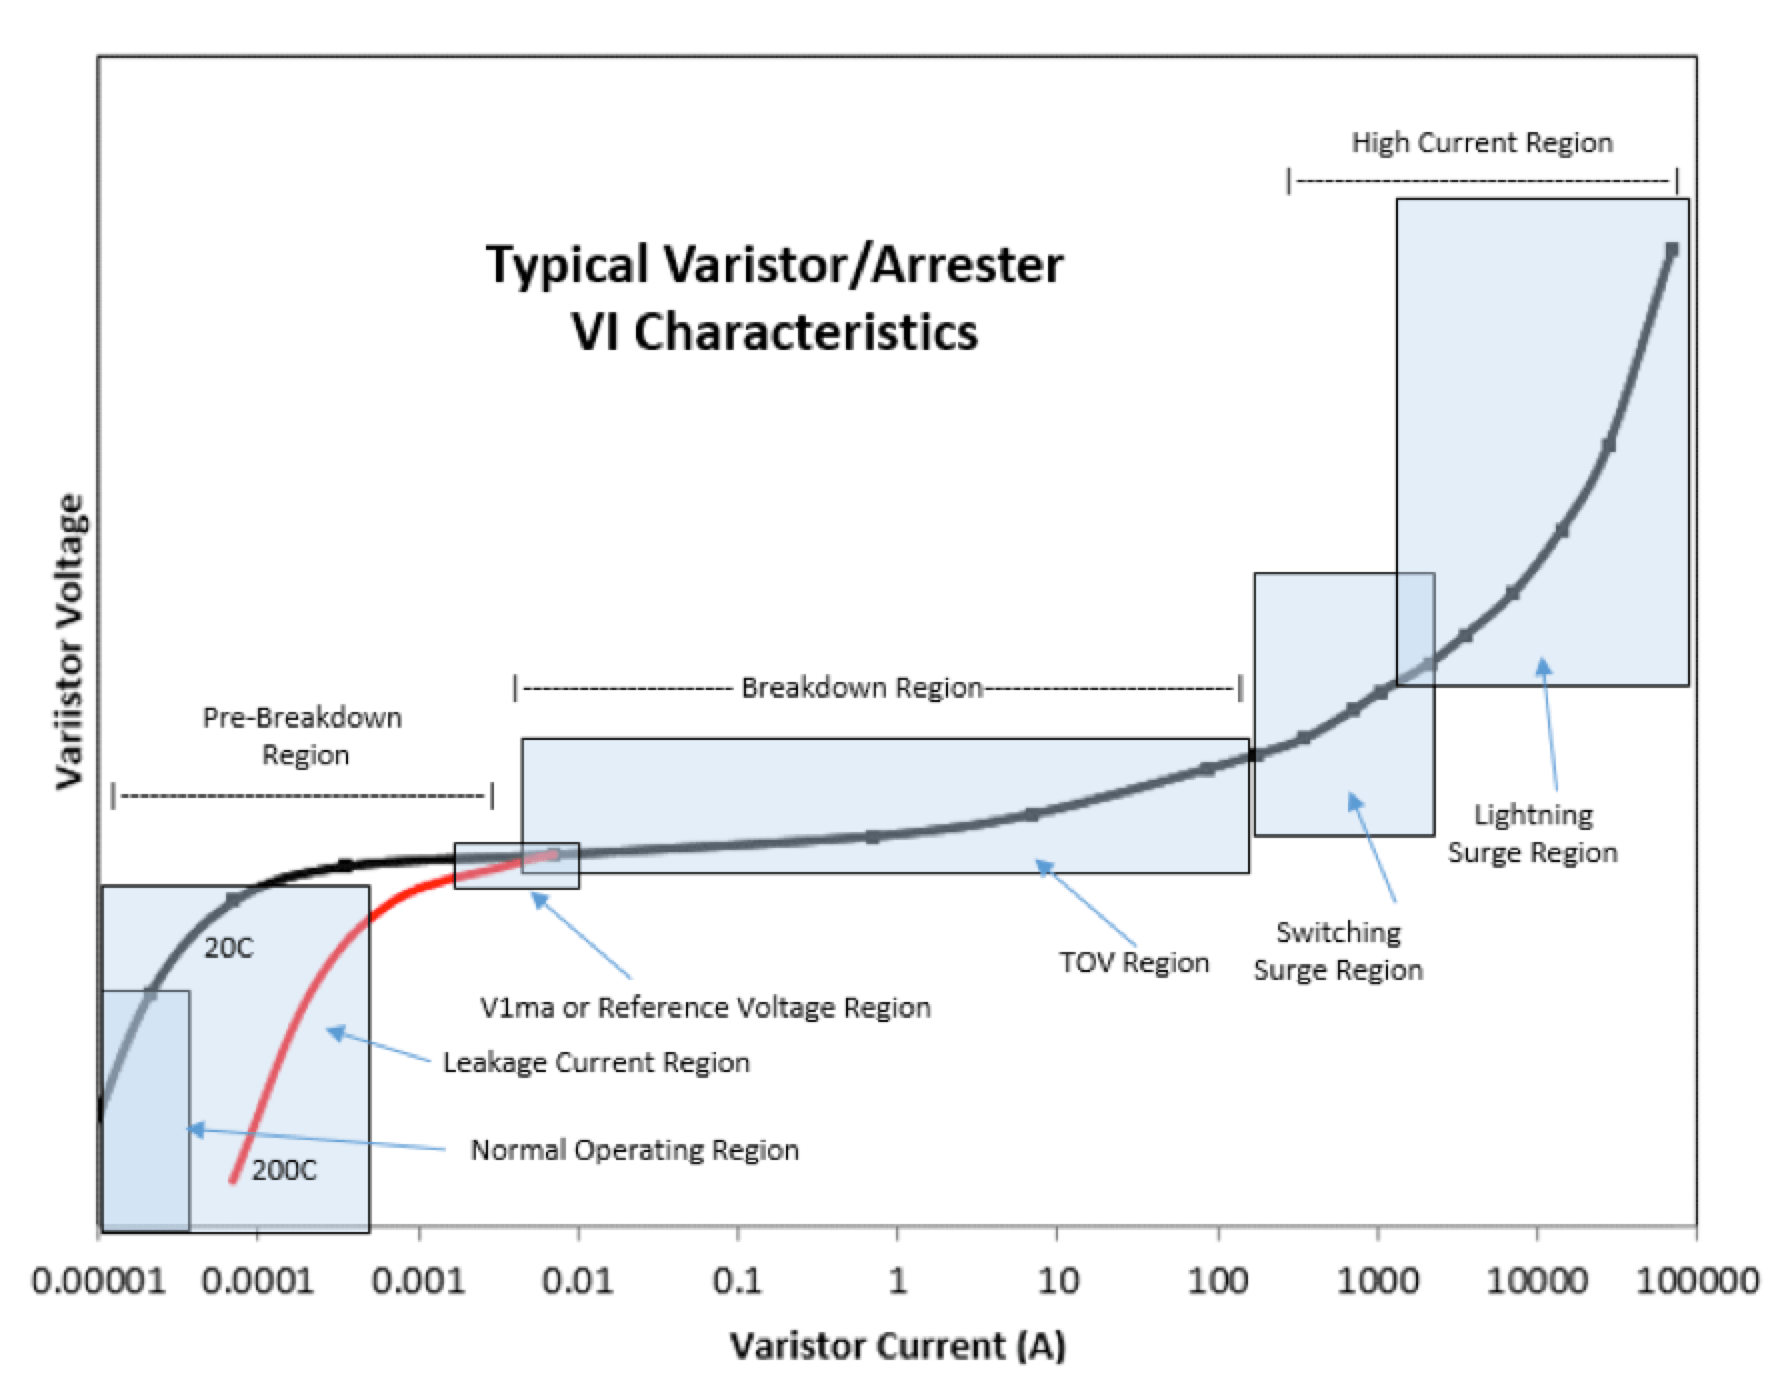
The pre-breakdown region is where a varistor is not in severe conduction mode and there are only microamperes flowing through the semiconductor. The varistor engineer usually refers to this region as the operating region or the leakage current region. This area of the VI curve accounts for the vast majority of a varistor’s typical life and, since very little heat is typically generated, the varistor can operate almost indefinitely. However, the resistance or conductivity of the varistor in this range of the curve is highly sensitive to temperature. If the varistor body temperature increases for any reason resistance decreases, moving the VI curve to the right into a higher leakage current range. The pre-breakdown region is also the only region that is affected by high current impulse. For example, should a surge of very high current pass through the varistor, the resistance in the normal operating region can decrease, causing more current to flow and possibly failure long after the surge has passed.
A very important yet the smallest region of the VI curve is the ‘knee’ or V1ma region – also known as the reference or characteristic voltage region. The reason it is so important is that it is not temperature sensitive and therefore, at current levels of 1-10 ma, the rest of the VI curve can be accurately predicted.
In the breakdown region of the curve, resistance is controlled by varistor junctions, which are present throughout the semiconductor material. As any design engineer for arresters understands, conductivity in this region is usually caused by power frequency overvoltages that can lead to a significant temperature increase of the disks. As long as temperature remains between 100 and 300°C, there is no long-term impact on the varistor. Note that conductivity in this region cannot last more than a few seconds or it will cause temperature to rise above the capability of the device.
The higher current region is where the varistor is performing its surge clamping function. Here, the varistor is conducting significant levels of current per square centimeter and the conductivity interval in this region is milliseconds down to microseconds. Moreover, the higher the current, the shorter the surge length. Also, in this region the zinc oxide grains are controlling the resistance of the varistor. The lower end of the high current region is where switching surges are found while above 2000 amps we find lightning currents. This is the region that gives the discharge voltage or residual voltage data found in most specification charts for arresters.
Each region of the curve is therefore important since together they provide for the varistor action associated with surge protection.
Jonathan Woodworth
Co-Convenor IEC TC37 MT4 (responsible for IEC 60099-4)