The performance of overhead line insulation in DC differs from AC due to ionization of airborne particles resulting from the unidirectional electric field. Contamination level, given the same service environment, is therefore more severe than for AC and CIGRE and IEC have published guides and models to reflect this when designing insulation for a DC line.
This edited 2017 contribution to INMR by researchers at Sediver in France compared insulation levels defined by these models with actual field observations as well as results from laboratory testing.

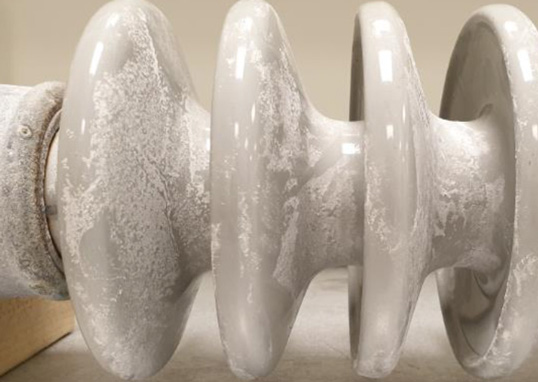
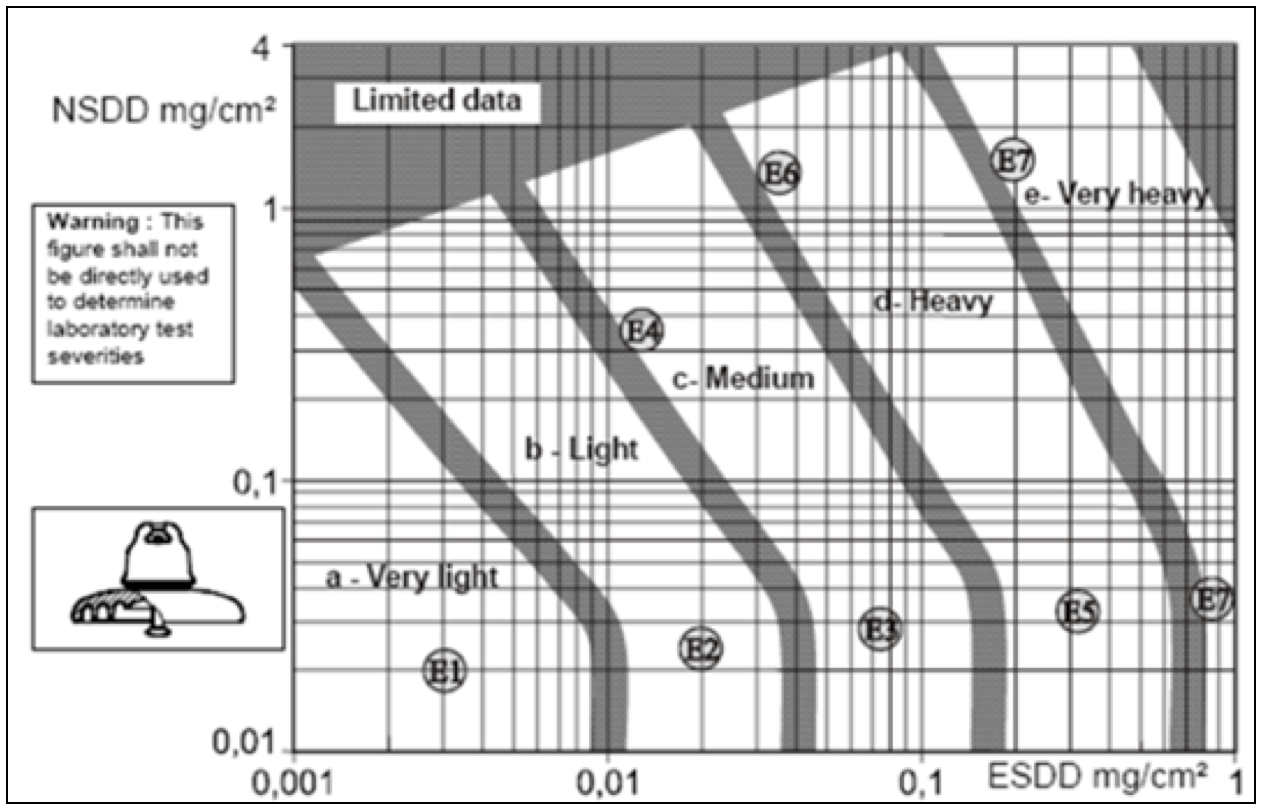
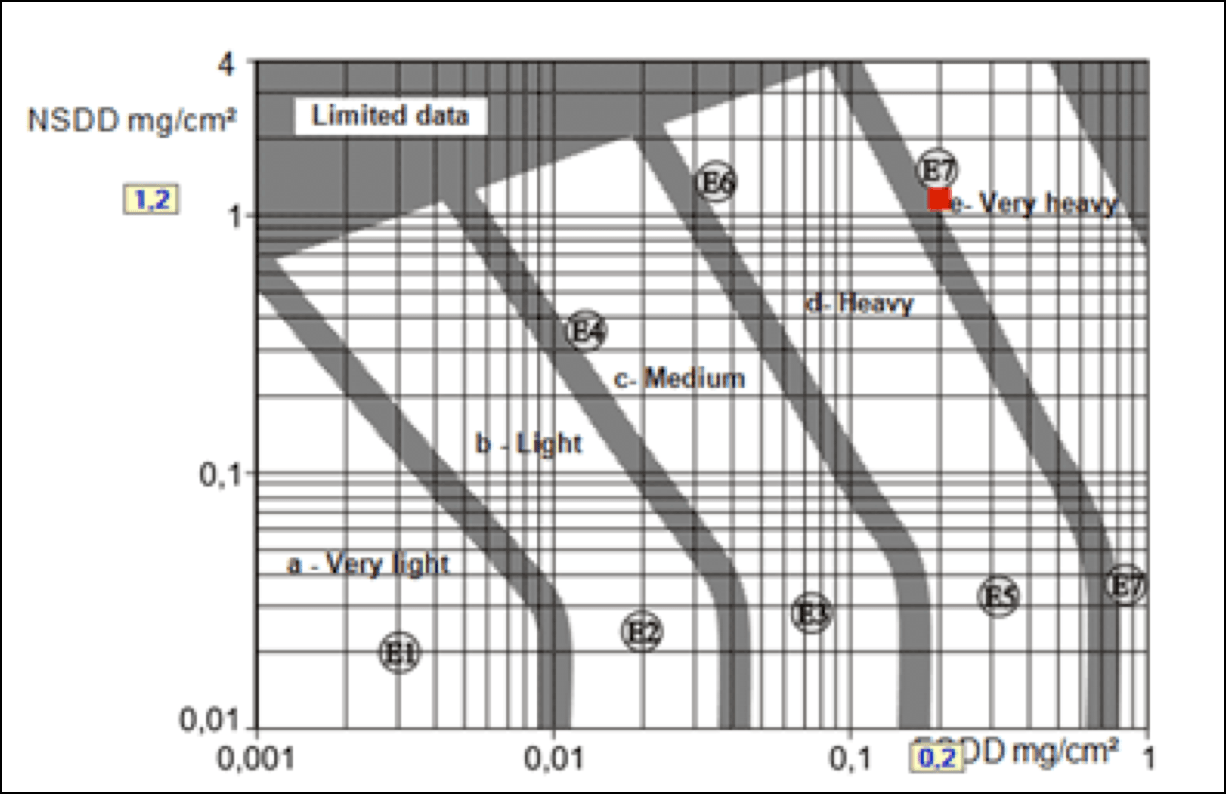
Pollution deposits on the surface of an insulator are classified utilizing equivalent salt deposit density (ESDD) and non-soluble deposit density (NSDD). ESDD level contributes to higher conductivity of the water on the insulator surface and subsequently increased leakage currents. The NSDD parameter reflects the extent to which moisture is ‘sponged’ from morning dew or fog events, thereby providing water to the leakage current and dry band arcing mechanisms.
CLICK TO ENLARGE
Contamination deposits in the field are usually non-homogeneous, with the bottom surfaces (live end) of the insulator string more polluted than other surfaces. CUR is the parameter that describes this property and is defined as the ratio of bottom to top ESDD levels. During laboratory testing, CUR is often set at 1 for practical reasons and thus provides more severe conditions than with a higher CUR. Other parameters such as shape and dimension of the insulator, altitude, dynamics of pollution deposition and polarity matter as well. All are clearly explained in CIGRE TB518 (Outdoor insulation in polluted conditions. Guidelines for selection and dimensioning. Part 2: the dc case) and also in IEC TS 60815-4 Edition 1.0 2016-10. The focus in this discussion is on determining required leakage distance of a string of insulators based on CUR, ESDD and NSDD.
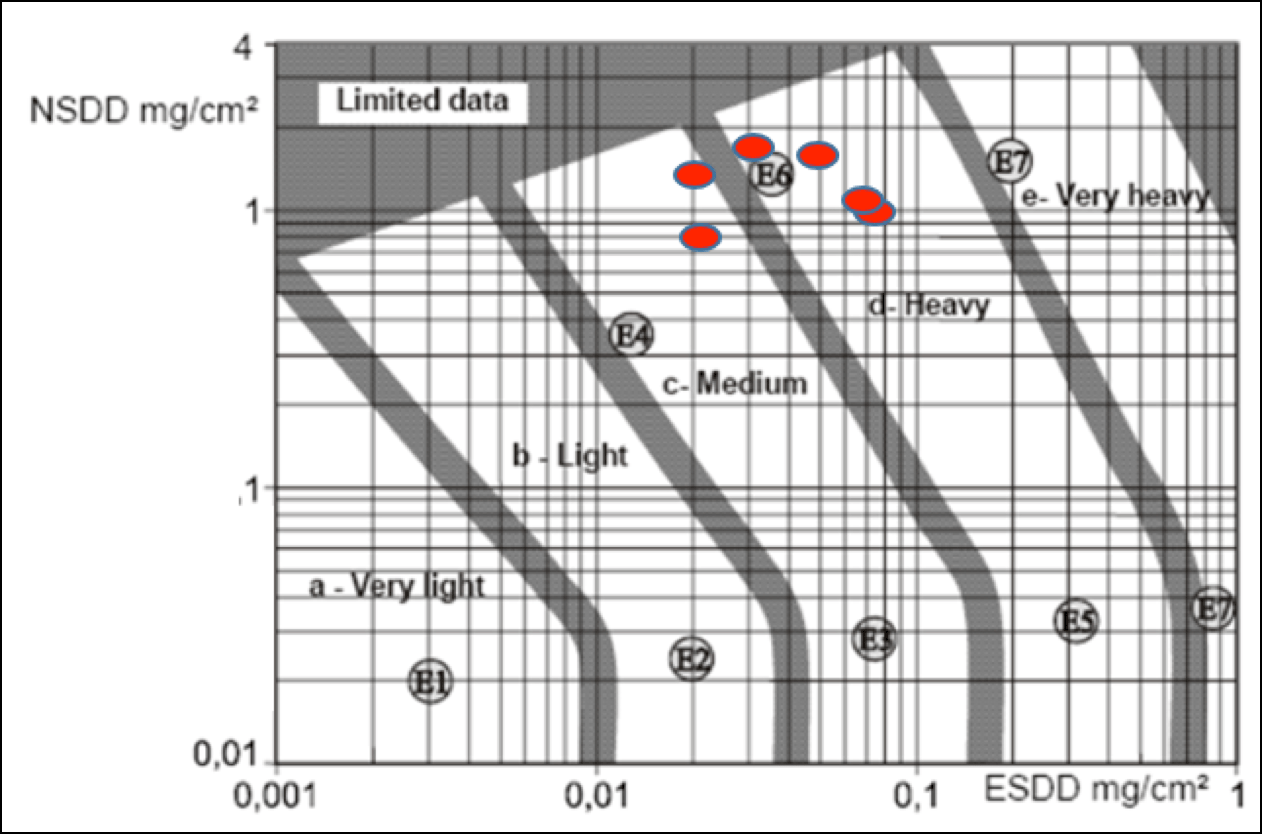
The severity of contamination in any given environment is classified in the above-mentioned CIGRE and IEC documents and varies from ‘very light’ to ‘very heavy’ (see Fig. 2). Specific creepage distance required to prevent flashover of the insulator string under the given contamination conditions is then determined. Another important parameter is reference unified specific creepage (RUSC) distance, which is the minimum USCD calculated as per these documents. Once defined, suitable insulator design can be selected and also number of insulators required in the string.
CLICK TO ENLARGE
String Design Based on CIGRE & IEC Theoretical Approaches
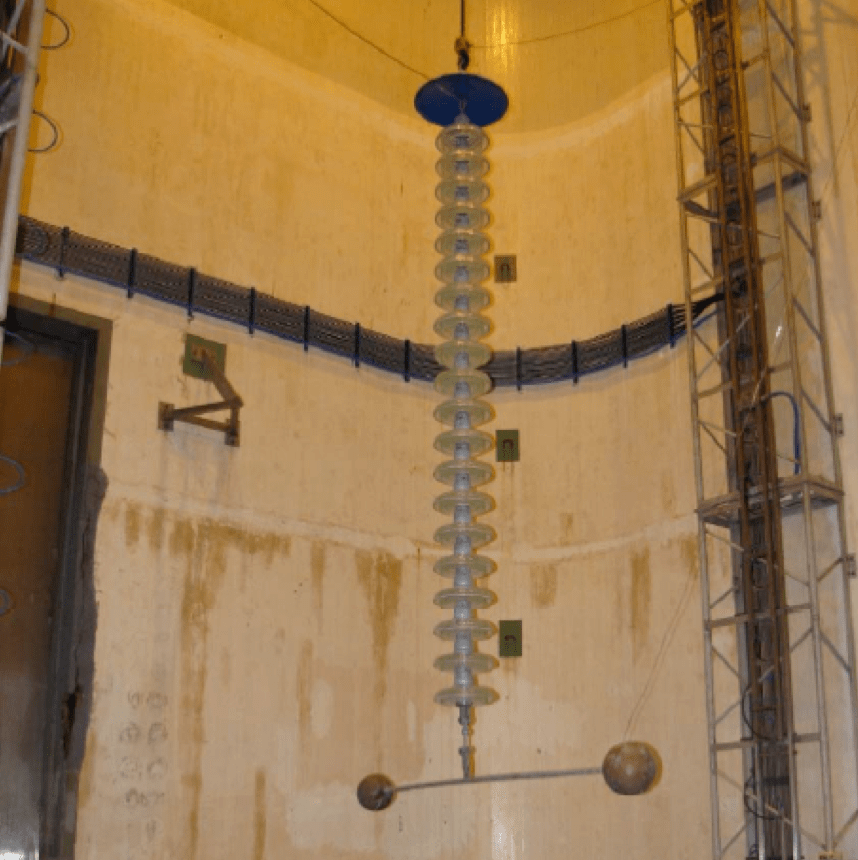
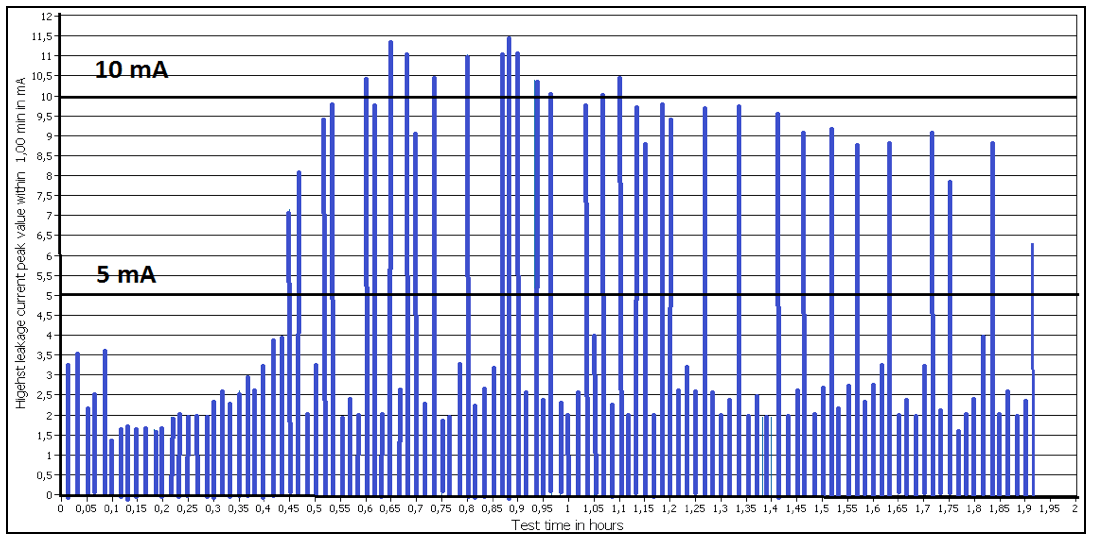
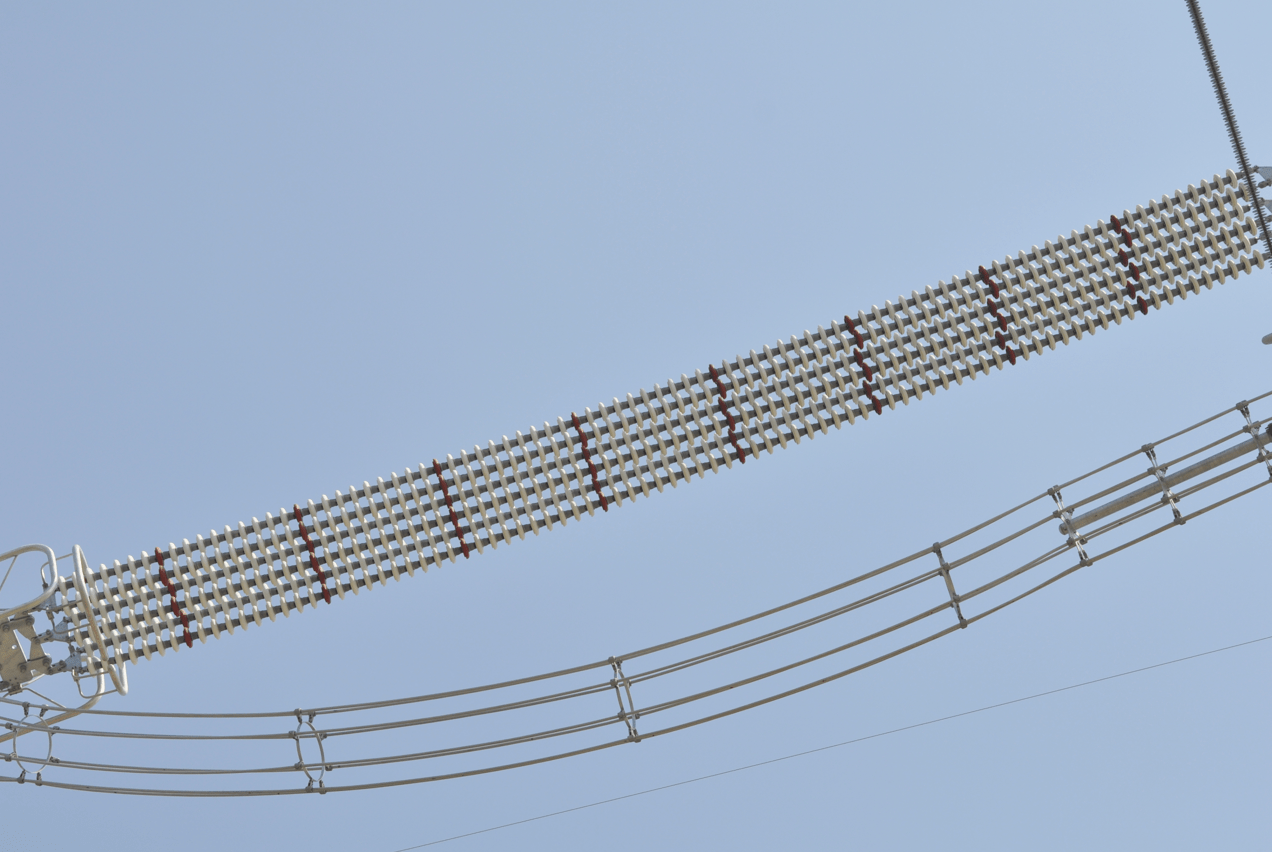
The following demonstrates the discrepancies possible between results from theoretical methods and those obtained from laboratory testing. In this case, a typical 300 kV string of 20 toughened glass DC units each having a leakage distance of 550 mm was tested under artificial pollution conditions established at ESDD=0.047 mg/cm² and NSDD=0.1 mg/cm² (see Fig. 3). This translates to a USCD=36.6 mm/kV.

According to CIGRE TB518 and IEC TS 60815-4 Edition 1.0 2016-10, the theoretical RUSC for this environment would be 44.8 mm/kV. Nonetheless, performance of the string was excellent with leakage current peaks only around 10 mA (see Fig. 4).
CLICK TO ENLARGE
CLICK TO ENLARGE
The difference between the USCD and the RUSC in this example is 20% and, if anything, is likely conservative given the low currents measured during the test. Here, the model does not describe observed pollution performance of the DC string. If such a line were to be designed solely based on the theoretical calculation, strings would probably be ‘overdesigned’ and generate unnecessary added cost.

Field Performance & Laboratory Testing
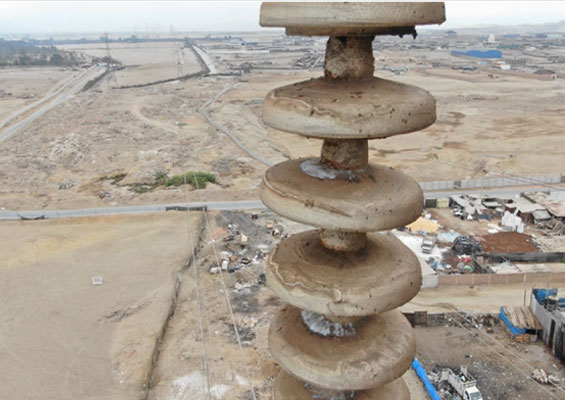
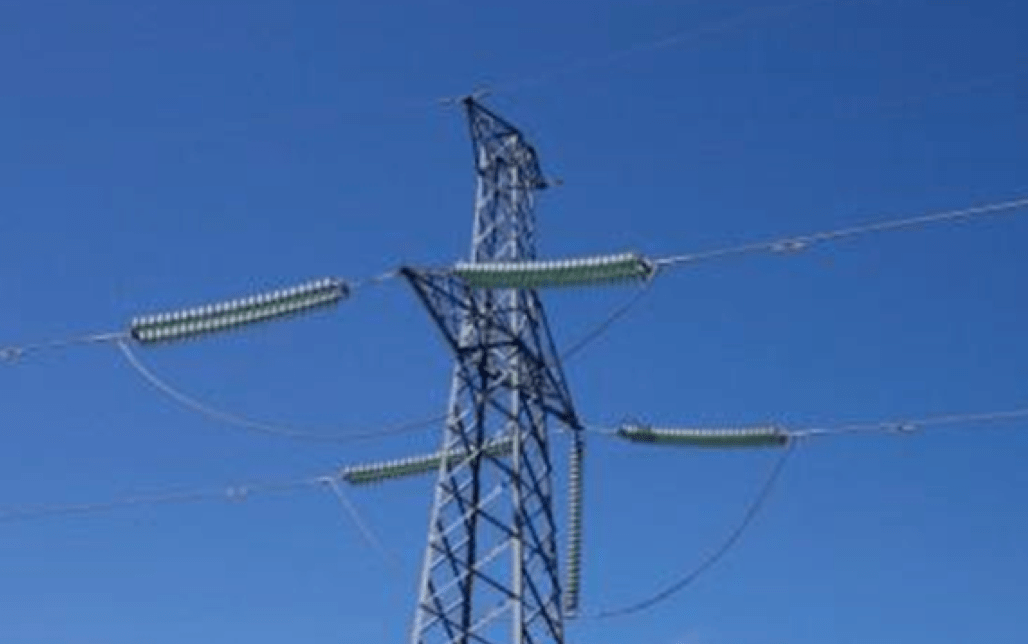
Examples based on experience with real DC lines were also evaluated. Actual pollution levels were determined by sampling ESDD and NSDD levels on site and this information was used along with the theoretical model to calculate expected USCD. Laboratory tests were then performed on these same insulator strings to determine flashover values. As in Fig. 5, among these cases was a 500 kV DC line that did not experience specific pollution problems over more than 40 years of service in a desert environment and also showed non-uniform pollution distribution along the strings. This line was designed with USCD=25 mm/kV. Yet the theoretical model would recommend using at least 42 mm/kV based on uniform contamination along the string with ESDD=0.04 mg/cm², NSDD=0.1 mg/cm² and CUR=1.
CLICK TO ENLARGE
An artificial pollution test was performed in the laboratory on toughened glass DC insulators selected for a voltage upgrade of this line. The string was set with USCD=23 mm/kV and tested under the same conditions as used earlier for the theoretical estimation (i.e. ESDD=0.04 mg/cm², NSDD=0.1 mg/cm², CUR=1). Maximum current during this test sequence was 60 mA. Moreover, another test was conducted with ESDD=0.07 mg/cm² but maintaining NSDD=0.1mg/cm². In this case, maximum leakage current was 100 mA but still with no flashover.
Under these same conditions, the theoretical model would recommend using a string with USCD=51mm/kV, namely twice what was tested. Even accounting for any effect of possible non-linearity between short and full length strings (since the test was conducted on short strings), there is a large gap between testing and the model.

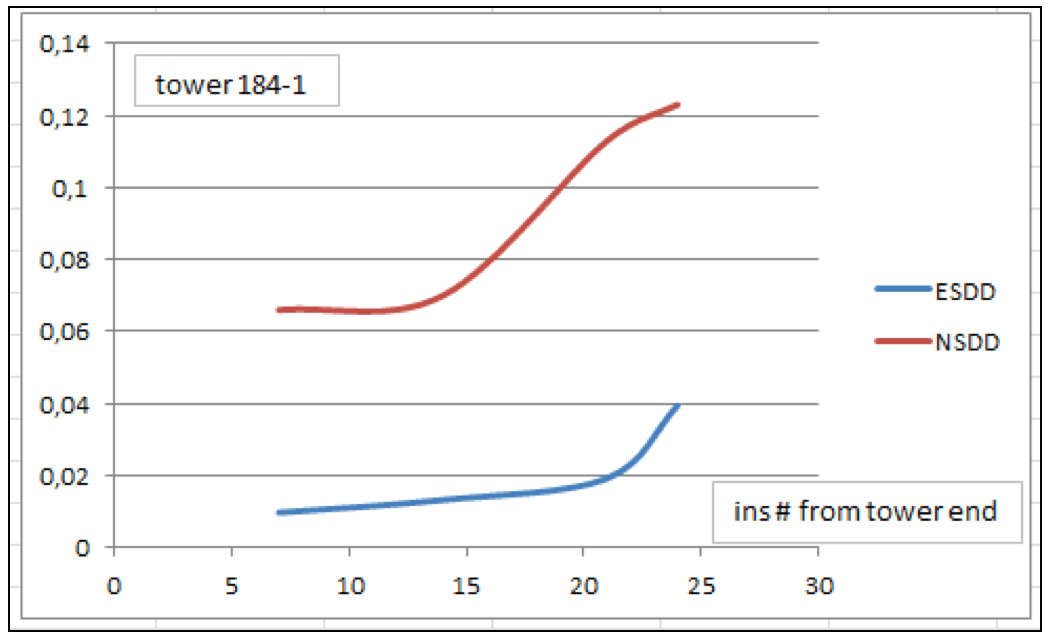
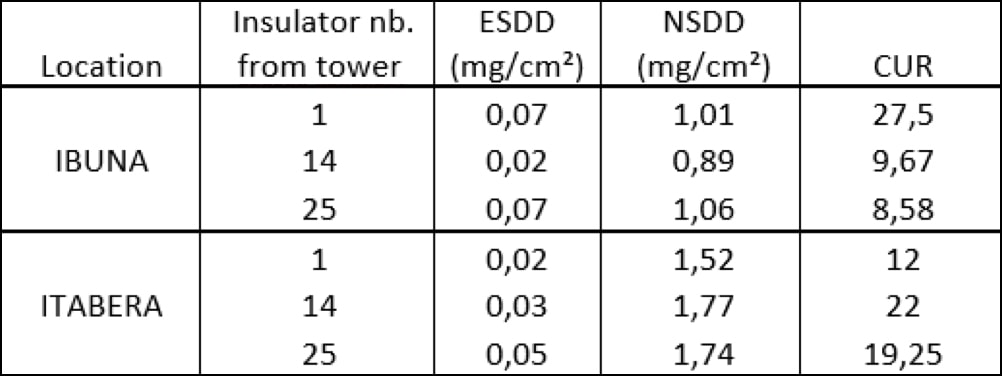
A similar example involved the 600 kV DC Itaipu bipoles in Brazil, where actual USCD is 28.5 mm/kV. Several strings were removed from bipole 2 for evaluation. Pollution levels here are classified as ‘heavy’ due to agriculture and industry near São Paolo (see summary in Fig. 6). It is also interesting to note the CUR ratios shown in Fig. 7. While the Maintenance Department of this line’s operator assured that there were no line interruptions related to local pollution, the theoretical model predicts intense flashovers unless the strings are redesigned with at least USCD=47 mm/kV. While in this particular case CUR level is outside the typical range considered in the model (i.e. CUR<10), the limits and acuracies of the mathematical approach can once again be called into question.
CLICK TO ENLARGE
CLICK TO ENLARGE
Mitigation of Severe Pollution
Most DC lines are built in relatively clean environments although there are cases, such as China, Italy and New Zealand, where lines pass industrial or coastal zones of relatively high pollution. Nonetheless, even in clean areas the electrostatic effect will attract airborne particles and result in a higher surface pollution than for an AC line in the same location. The problem for more contaminated service environments is therefore more critical. Polymeric insulators have sometimes been considered under these conditions, mostly in China, but only marginally in other countries due to lack of standards describing maximum silicone housing and seal stress levels for DC applications. Cases of premature degradation of polymer housings or seals have been reported and this has resulted in a more conservative approach for polymers when comparing pollution performance to accelerated ageing in DC.
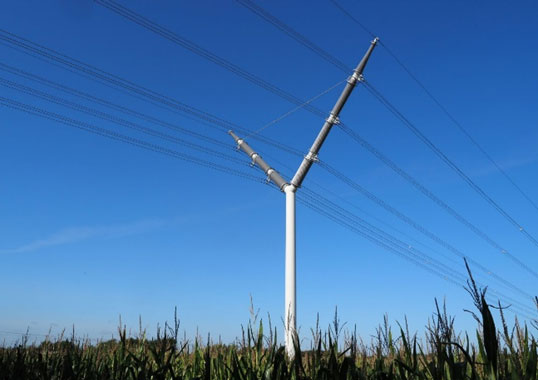
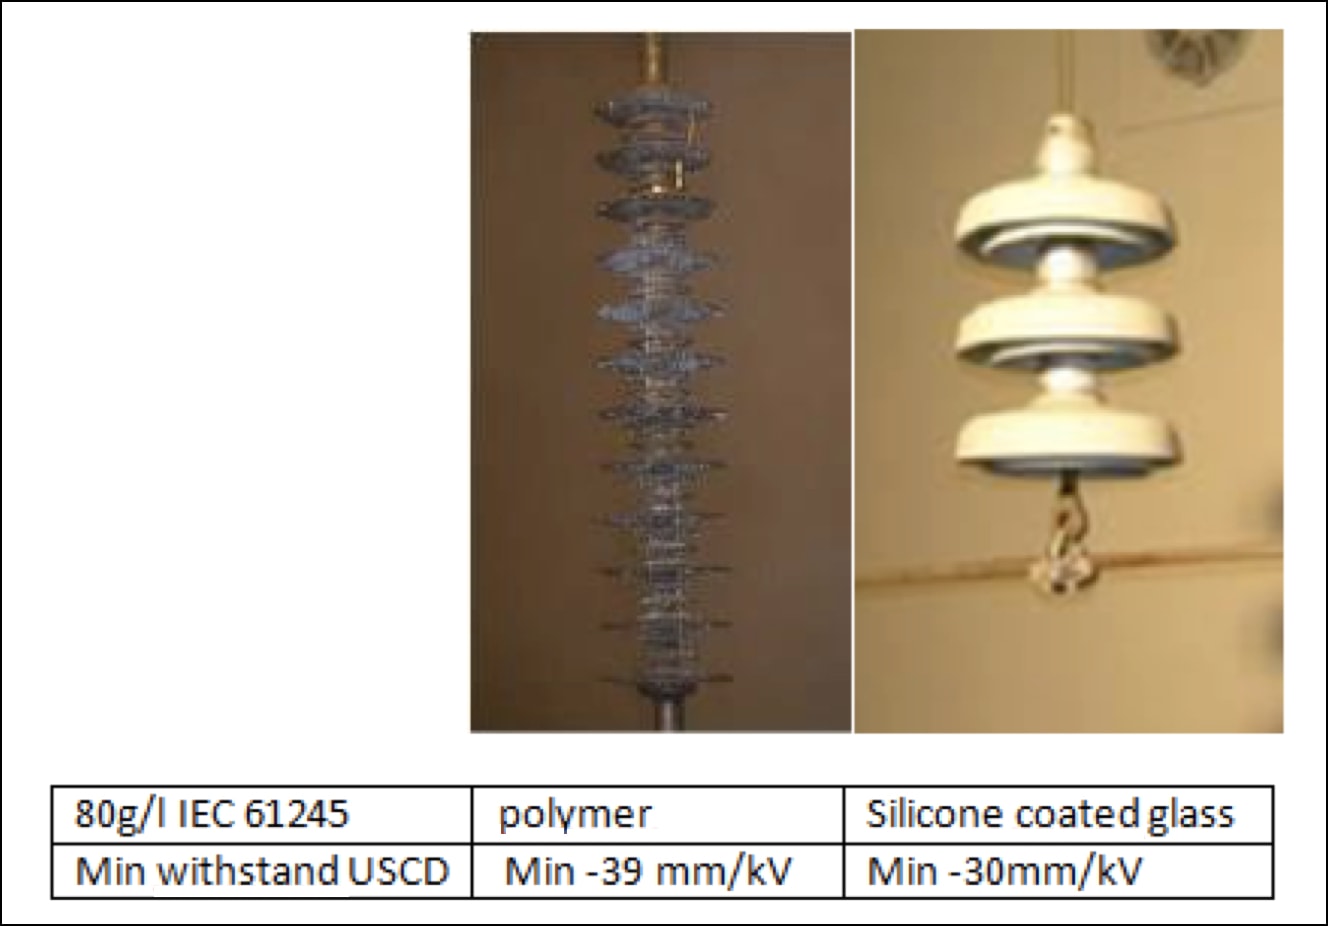
One solution in these situations is use of silicone coating applied on the surface of glass or porcelain insulators. For example, in China, the 800 kV Ximeng-Taizhou-Shanghaimiao-Shandong DC line currently utilizes several hundred thousand factory coated glass insulators. Similarly, TSO Terna in Italy has used coated glass strings on its 200 kV DC line in Tuscany (see Figs. 8 and 9) and also in Sardinia with the goal of reducing need to frequently wash insulators. As shown in Fig. 8, these areas are classified as ‘very heavy’ pollution.
CLICK TO ENLARGE
CLICK TO ENLARGE
Pollution tests comparing performance of factory-coated glass insulators with polymeric insulators were performed under salt fog conditions typical of a coastal application. Fig. 10 summarizes findings and demonstrates the benefits of a classical glass insulator string coated with silicone. These results demonstrate the difficulty in arriving at any generalized statement on performance without carrying out testing. Here, both test objects were considered hydrophobic materials and their respective leakage distances were equivalent. But material and shape matter as well.
CLICK TO ENLARGE
The above suggest that theoretical models may require further work and also possible modifications to better reflect hydrophobicity transfer materials (HTM), especially since more and more silicone coated glass insulators are being used in addition to polymeric types. As in AC, shape also matters and assumptions made for HTM in the theoretical model have been made mostly considering polymeric insulator designs, not ceramic cap & pin insulators.
CLICK TO ENLARGE
Conclusions & Future Directions
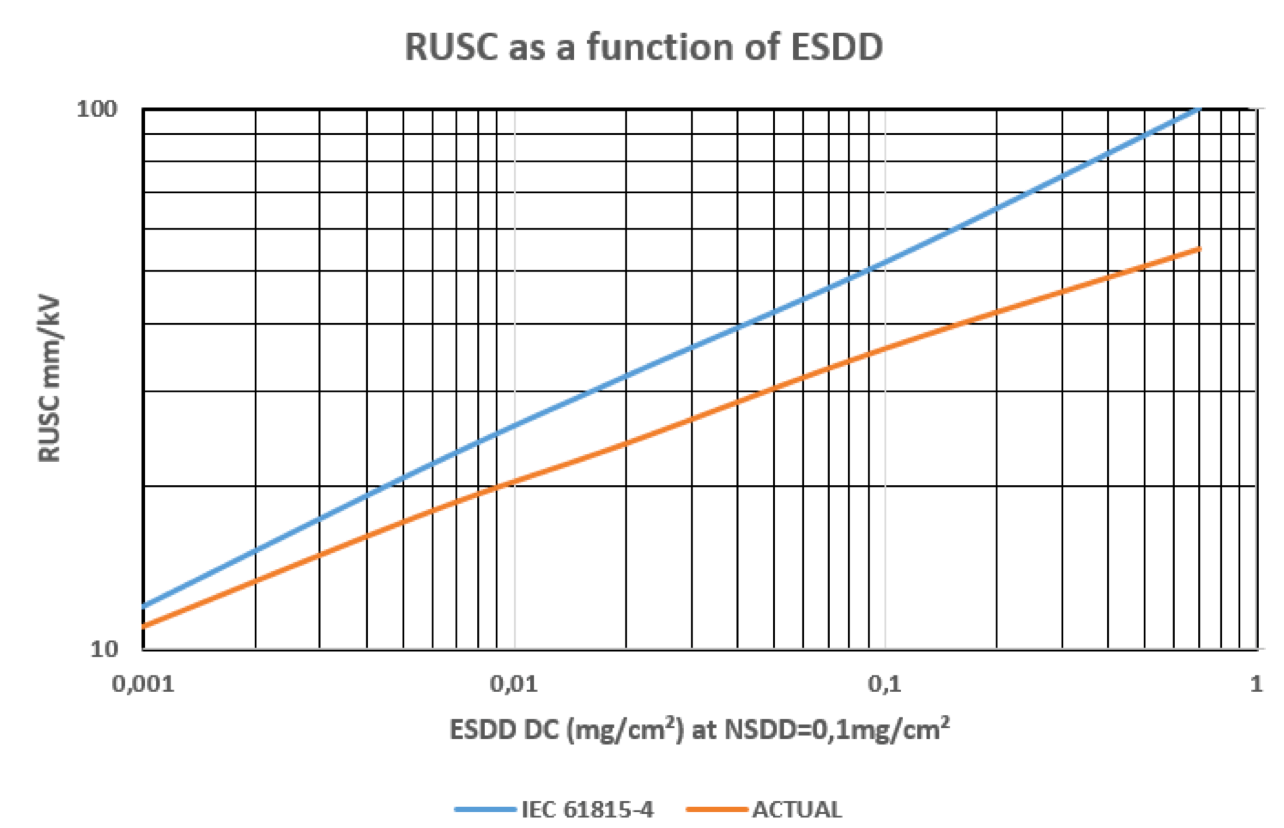
The large spread in findings between laboratory testing, field experience and theory suggest the need to produce an actual design test for any given project and not rely solely on the theoretical equations found in various documents. Fig. 12 for example gives an idea of the possible margin of error between theoretical evaluation of RUSC versus laboratory testing and actual field performance. This graph needs further adjustment using more test results to ‘fine tune’ the reference to RUSC.
Errors from relying mainly on mathematical models can lead to possible overdesign of 20% to 30% and the implication for added cost can make a new line project design unacceptable. Widespread pollution testing campaigns in DC are required to better document actual performance. Similarly, most laboratories conduct tests with CUR=1 while in reality this usually varies between 3 and 5 (sometimes even 7). There is therefore the need for new contamination deposition methods to be able to consistently duplicate variable CUR levels during tests. This will ensure better simulation of actual field conditions without relying only on theoretical correction factors.
CLICK TO ENLARGE
References
• CIGRE C4.303-TB518, Outdoor insulation in polluted conditions. Guidelines for selection and dimensioning. Part 2. The dc case
• IEC TS 60815-4Edition 1.0 2016-10Selection and dimensioning of high voltage insulators intended for use in pollution conditions. Part : insulators for dc systems
• 2015 INMR WORLD CONGRESS JM George HVDC insulators
• Condition Assessment of Cahora Bassa Insulators Removed during Reinsulation of the Line: Preliminary Results. Nalomo, Ntshani and Mahatho, ESKOM CIGRE South Africa 2015
• 2015 INMR WORLD CONGRESS. A Pigini Design and testing of polymeric insulators to verify the pollution performance under dc voltage
• IEEE International Conference on Solid Dielectrics, Bologna, Italy, 2013. Marzinotto at all. DC-toughened glass insulators pre-coated with RTV silicone rubber- field returns from aged samples installed on HVDC lines.
• 2009 INMR WORLD CONGRESS. Performance evaluation method and optimum selection of overhead line insulators for contaminated environments. Prat, George, Lopez