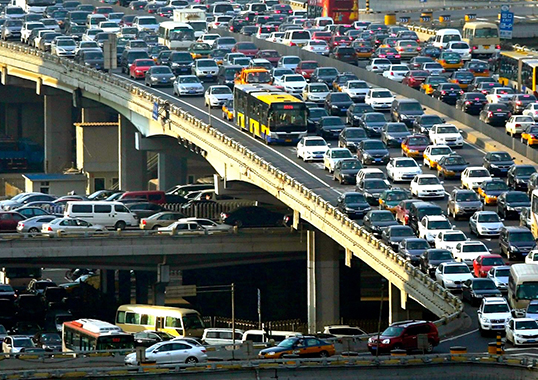
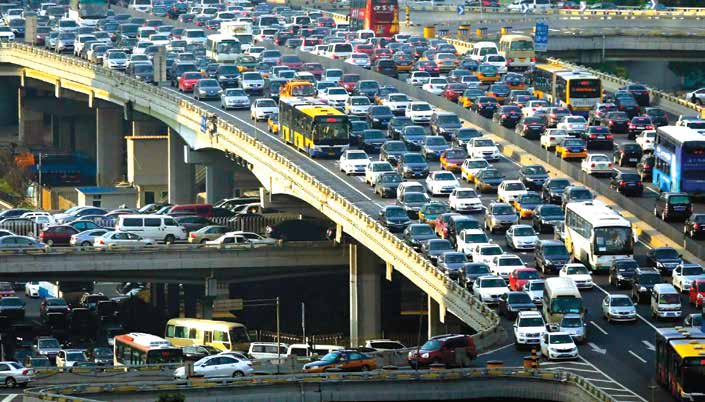
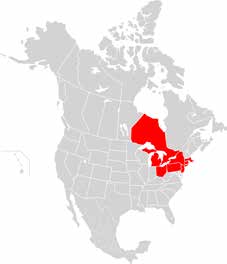
On January 30 fifteen years ago, traffic in Canada’s largest city, Toronto, descended into chaos when a 230 kV capacitor bank adjoining a 16-lane expressway shorted out and caught fire just after being energized. The voltage dip from the short circuit lasted only one-fifth of a second yet still tripped about 1500 megawatts of load. The disturbance was recorded throughout southern Ontario, all the way to the Quebec border and even into the neighbouring New York and Michigan. While there was no additional damage to the power system beyond the initial problem, the transient voltage dip caused almost 2000 traffic lights and an unknown number of digital alarm clocks to reset. About 140 of these lights remained off-line for hours. The total cost in lost time alone for some 500,000 frustrated commuters was estimated over US$ 2 million.
This past contribution to INMR by industry expert Dr. William Chisholm, looked at the real economic impact of these types of occurrences and correlated this against various engineering options that allow them to be avoided. While the data used in his analysis dates back a decade, the lessons and conclusions remain valid today.
Momentary outages of the sort that occurred in Toronto used to carry minimal economic penalties for the electric utilities involved. In this instance, for example:
• The instantaneous energy load not served was the product of severity (1500 MW) and duration (50 millionths of an hour) – amounting to 83 kWh and representing only about US$ 8.
• Using an IEEE figure of US$1997¬ 12.51/kW for momentary power interruption for industrials plant with less than 1 MW demand, and treating each of 2000 flashing lights as a small 200-W industrial plant, we calculate a penalty of US$2015 7300.
• The spot price of power dropped by two-thirds for about five minutes, representing lost energy revenue of US$200k to high-cost generation providers.
Yet all of these costs pale by comparison with the real economic cost of this momentary outage, given the thousands who arrived late for work. This is more properly reflected in the North American Electrical Reliability Corporation (NERC) Standard TPL-004-0, which tabulated this as a Category D ‘Extreme Event’, involving two or more elements removed or cascading out of service.


Cost of Sustained Outages
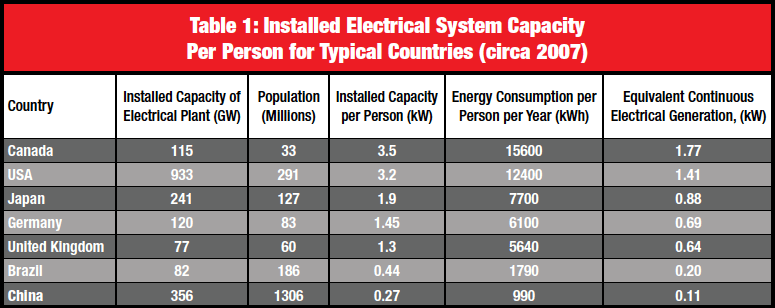
In contrast to momentary problems, the costs of outages having extended duration are usually widely reported, along with the number of people affected. This simplifies evaluation of economic impact in terms of ‘Customers Not Served’. For example, the historic blackout in the northeast U.S. and eastern Canada in August of 2003 affected 50 million people with outage-related financial losses estimated at US$ 6 billion – representing US$ 120/person for the day. Similarly, the ice storm of 1998 that affected Quebec, southeastern Ontario and other regions caused damage amounting to US$ 6 billion. For the 700,000 people left without power for more than three weeks, the specific restoration cost was US$ 2 billion, or some US$ 140/person/day. Estimates of the conversion from population not served to load not served can be obtained by dividing system peak loads by population in service areas or by using per capita measures of power consumption.
These estimates have some variation among states or provinces within countries. For Canada and the U.S., some regional figures, updated to 2013, included:
• Ontario, Canada: 24.9 GW peak load, 13.5 million people, 1.8 kW/person
• California ISO, 45.1 GW peak load, 38.4 million people, 1.2 kW/person
• New York ISO, 33.9 GW peak load, 19.6 million people, 1.7 kW/person
In terms of defining utility customers rather than population, a factor of 3 or 4 persons per electric meter was supported by some specific values at the time for Canada and the U.S.:
• Toronto, Ontario: 2.8 million people = 730,000 customers
• Large utility in California: 15 million people or some 5 million customer accounts

Power Quality Standards & Costs
Utilities have traditionally used their discretion to select those options which satisfied customers while also minimizing their investment and maintenance costs. Then, about 15 to 20 years ago, things started to change from optional to mandatory. For example, the USA Energy Policy Act, signed in 2005, gave new jurisdiction and power of enforcement to a regulating body (FERC) and also mandated a new Electric Reliability Organization (ERO) with the responsibility to enforce reliability standards. The function of the ERO was assigned to NERC in the U.S., along with legal powers to enforce the new reliability regulations. Utilities have become quite responsive to NERC ‘Alerts’, such as the one involving thermal rating of overhead lines, i.e. FAC-008-3.
Many different problems can force the power system voltage away from a pure single-frequency sine wave of constant amplitude. Standards such as IEEE 493 continue to offer excellent advice on configurations which improve reliability. But these configurations generally have redundancy which adds cost and complexity.
Many utility regulators now review some traditional measures of power system reliability, based on system-average interruption frequency index (SAIFI) and interruption duration index (SAIDI). Some large utilities face penalties exceeding US$ 5 million when these indices do not meet target values. These are important metrics that fulfill necessary, but not sufficient, conditions to ensure customer satisfaction as measured by surveys. SAIFI and SAIDA do not consider outages of less than 3s in the calculations. Rather, these are included in a separate tally of the momentary average interruption frequency index (MAIFI).
Retail customers usually do not distinguish between momentary and sustained outages when responding to telephone surveys of customer satisfaction. The surveys are typically based on five factors:
• Power quality & reliability
• Company image
• Price and value
• Billing and payment
• Customer service
Momentary voltage dips are usually measured by a scatter plot of remaining voltage (percent of nominal) against the duration of the disturbance. Voltage dips with duration of less than 20 ms are ignored as are those which do not fall below 90 percent of nominal voltage. Fig. 1 provides a typical set of readings.
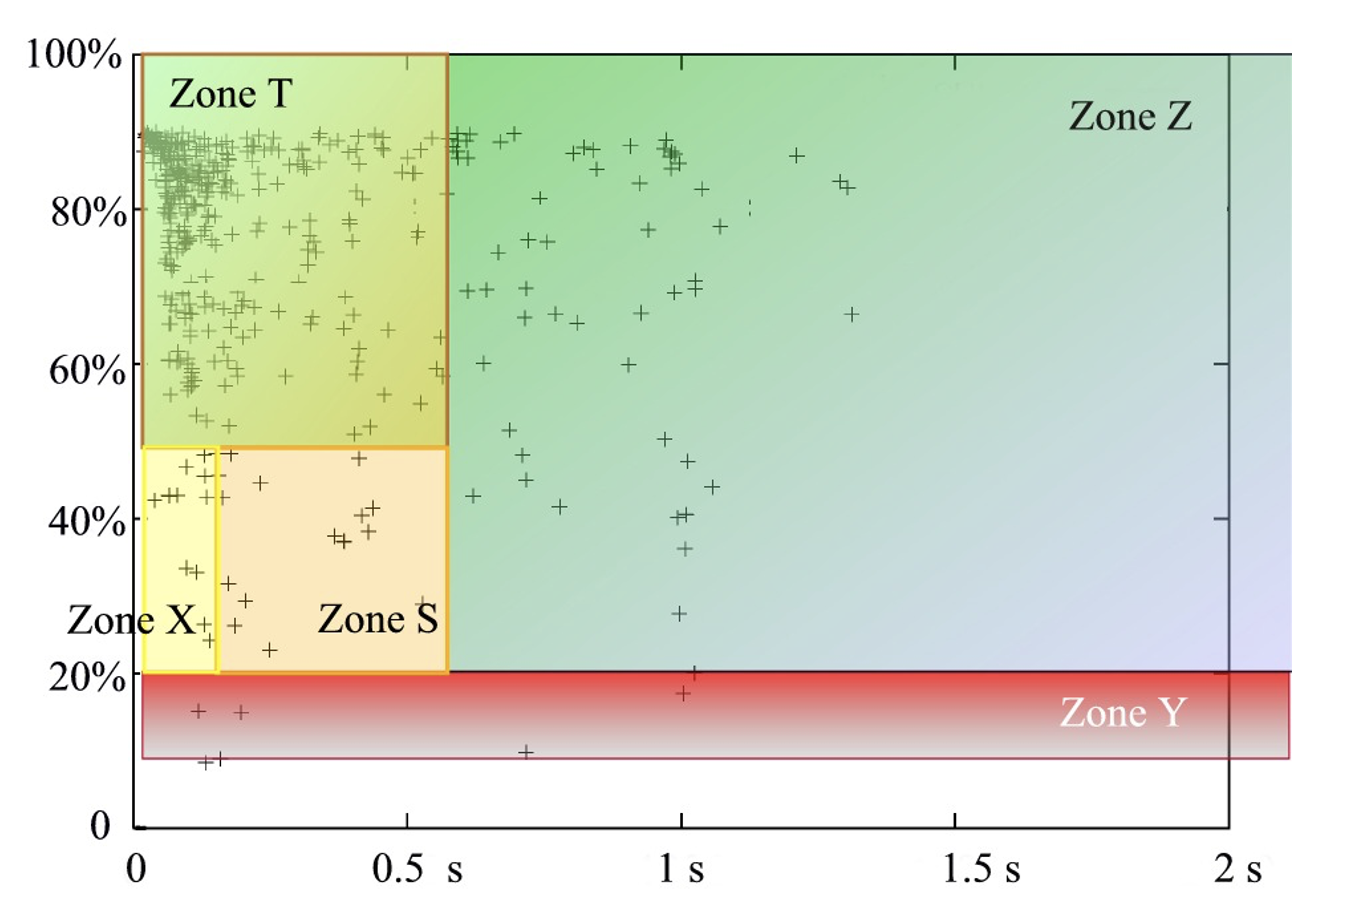
Normally, an equipment tolerance curve is overlaid on such a dip-duration scatter plot. Rather than the ITIC curve normally used in the U.S., a more detailed classification of the five zones has been overlaid here, as proposed by Eskom, the large South African utility. Eskom was selected because it has considerable experience managing a power system in areas having high lightning ground flash densities (in the east), high levels of insulator contamination and other risks to reliability. The dividing line between Zone X and Zone S in Fig. 1 is 150 ms. If the voltage dip lasts longer than 600 ms, it lies in Zone Z unless the remaining voltage falls below 20 percent. Zone S can often be the area where customers and utilities must negotiate. There are 15 disturbances in this zone which may or may not upset or damage electronic equipment, variable-speed drives or large motors, depending on specifications. Utilities take greater responsibility for disturbances in Zones Z and Y while customers should be buying equipment which holds up to disturbances in Zones T and X.
In August 2014, the IEEE introduced a trial-use practice for end-user electrical equipment operating at less than 1000 V, Standard 1668TM. This incorporated work from CIGRE Working Group C4.110 at 969 monitoring sites. Transmission faults lead to three-phase interruptions and Type III voltage sags, which are now addressed in the new guide. The trial-use recommendation is that electrical equipment should ride through voltage dips as follows:
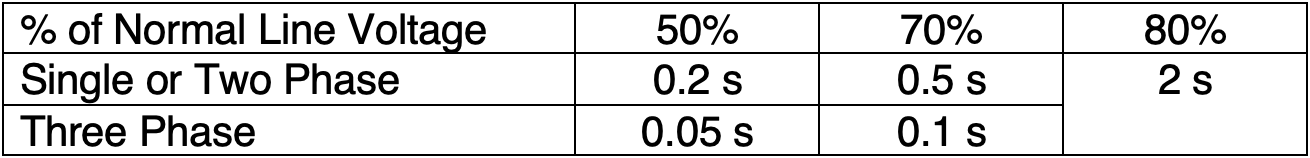
The definitions for passing or failing the immunity test included full operation, self recovery or assisted recovery.
Cost of Unserved Energy
The reliability cost/reliability worth method is considered by several major utilities as an excellent approach to achieve consistency in planning among groups which install or maintain generation, transmission and distribution facilities. This method is based on the trade-off between the cost of reliability and the cost of unreliability, as illustrated in Fig. 2.
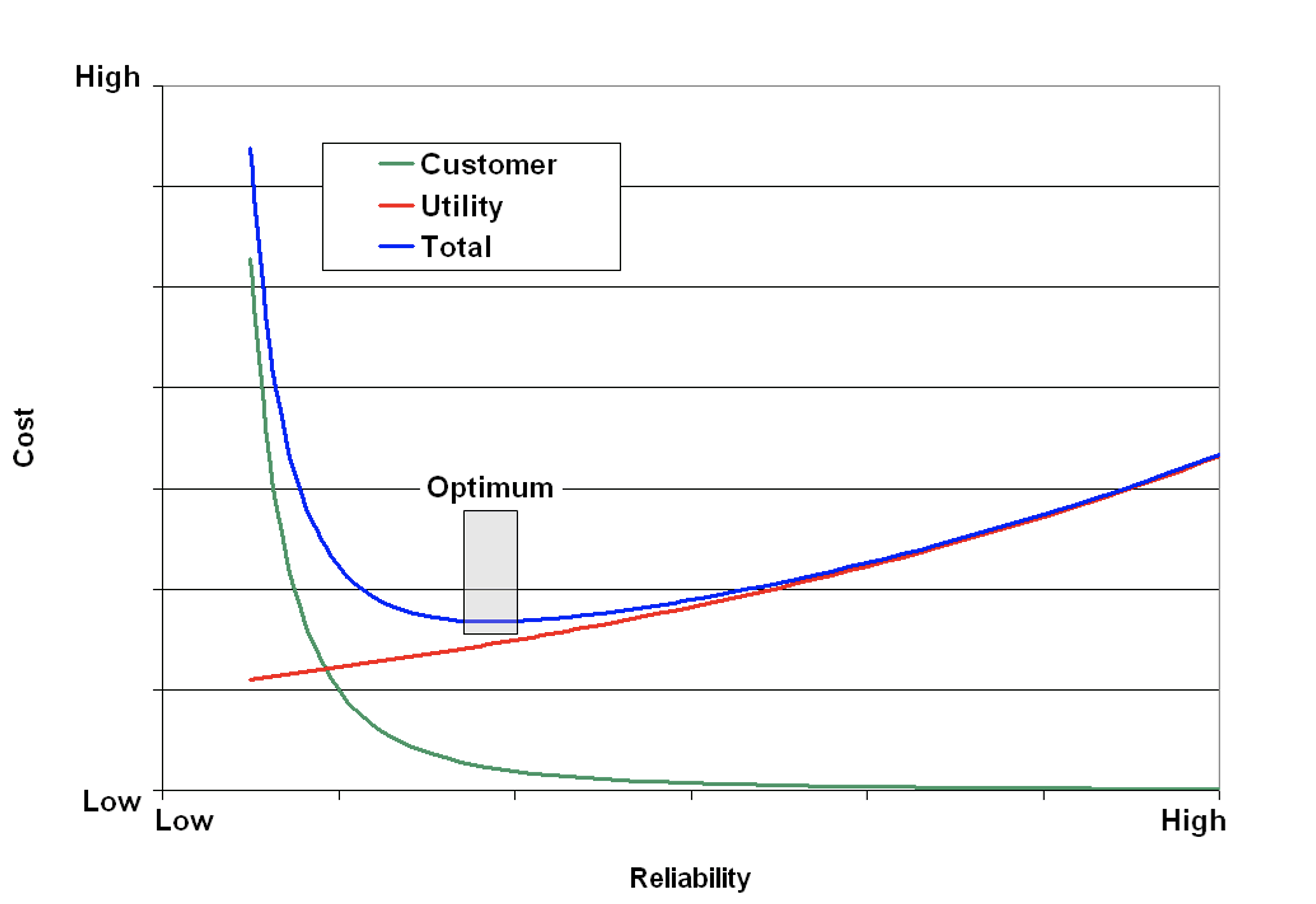
The red line in Fig. 2 indicates the cost of providing enhanced system reliability through additional generation or transmission. The green line shows cost to the utility customers of ‘unserved’ energy. Even a system with poor reliability will have some minimum cost needed to replace defective equipment as it fails. An extremely reliable power system will have significantly greater cost and therefore further investment does not provide much additional value. The optimum is found in the gray-shaded area, where total cost reaches a minimum value.
This optimization approach is based on using the ‘correct’ cost of interruptions to customers. Planning recommendations to incorporate more reliable, more expensive configurations depend greatly on how this cost to customers is evaluated. The cost of unserved energy is a measure of the value which customers place on a secure supply of electricity. In some regions, this can be estimated by tabulating the cost of energy not supplied to customers as a result of rotating power cuts. In other areas, customer queries about these unserved energy costs are viewed as attempts to justify rate hikes, or the data are considered confidential, or there are other barriers which make estimates for cost-of-unserved-energy uncertain.
Yet, where they have successfully been carried to completion, customer surveys in the U.S. have shown that the cost of unserved energy is in the range US$ 2000 to 50,000/MWh depending on frequency and duration of outages and their consequences to particular customers. In South Africa, a large utility used a figure of R19,000 (US$ 2700) in their planning but they also noted that the figure could also reach the same upper limit of US$ 50,000/MWh, based on published losses of US$ 850M after past contamination outages in the Cape Town area. If the cost of unserved energy in a planning process is too low, system reliability will almost certainly be lower than that desired by customers. The customers will either adapt by selecting equipment which has less sensitivity or they will be prepared to pay a premium in their electricity prices for an improvement in the security of supply.
Cost Per Avoided Customer Momentary Dip
There are a number of ways to describe the actual ‘customer(s)’ affected by momentary dips in line voltage from failures in power system insulation. Using the Canadian event described in the Introduction as example, would that problem of January 2007 be scored as 2000 individual traffic light loads, each of 200 W or, alternatively, as a disturbance affecting 500,000 commuters? It was established earlier that there are about three persons per electric meter and in the U.S. each person consumes about 1.4 kW. These combine to suggest that 4 kW could be used for evaluating the number of customer meters and thus the number of power quality survey opinions which would be affected by a voltage dip.
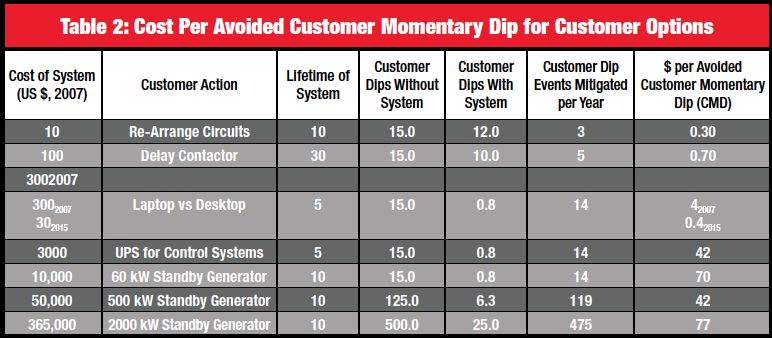
A typical 230 kV transmission line running at 40 percent of peak load capacity would serve about 40,000 customers of 4 kW each. With these input assumptions, estimates of the cost of avoiding an individual customer momentary dip can be built up. As an example, a consumer could choose to purchase a laptop computer rather than a desktop model of the same capability, powered from the AC line. The premium for customer investment this “nanogrid”, with energy storage of about 50 Wh and 5 year service life, was about $300 a decade ago, and thus the cost of avoiding about 14 momentary dips per year worked out to $300/(5 years x 14 dips per year) or $4 per dip. In 2015, the cost of a replacement battery for a laptop has dropped to about $30, making these customer nanogrids much more cost-effective reliability solutions at about $0.4 per avoided momentary dip. Tables 2 and 3 show the costs of other choices, which have remained constant in the past ten years, including three related to lightning protection which will be described in greater detail below.
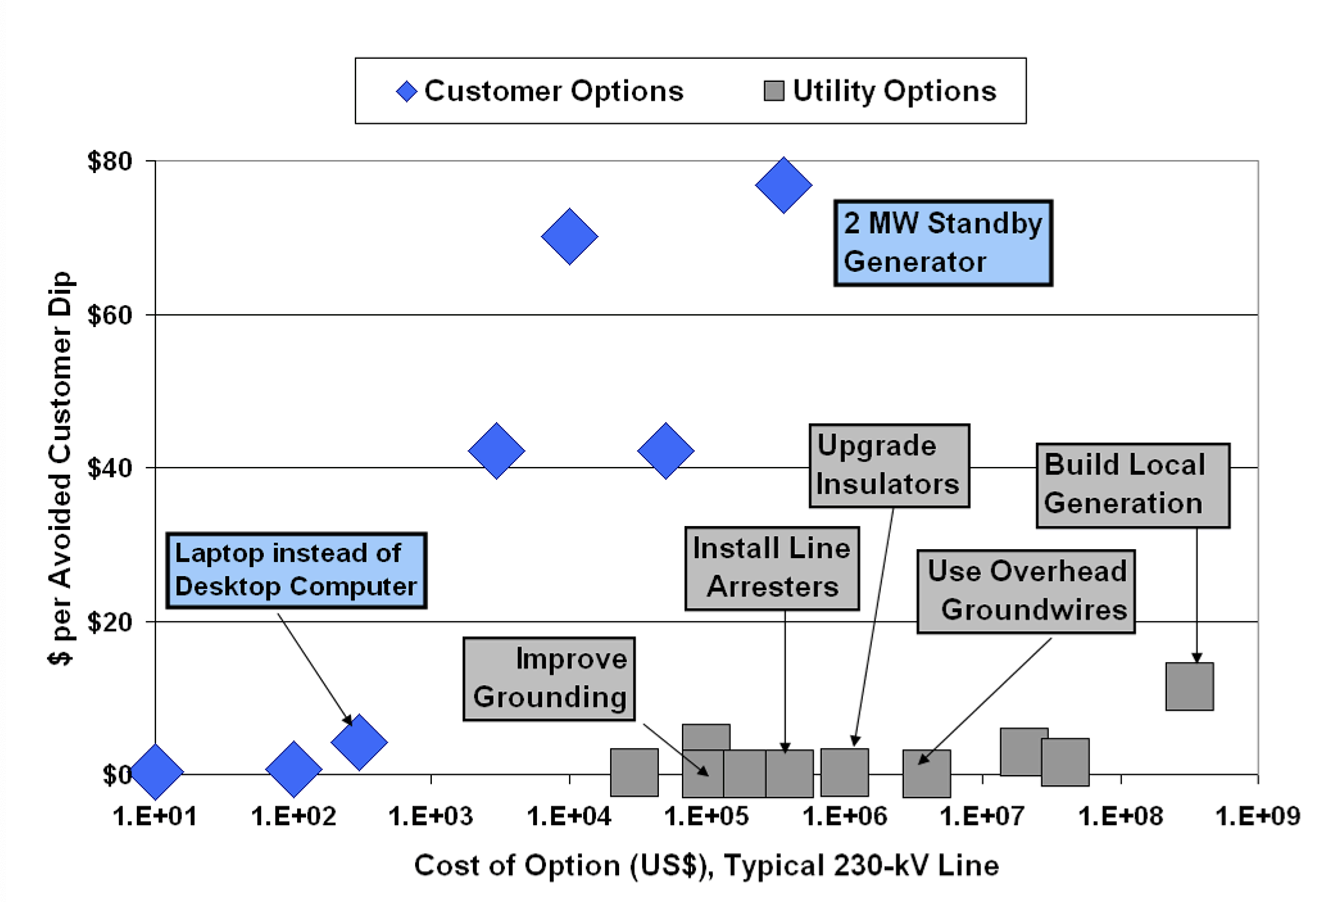
Customer versus utility options for 40,000 customers served by 230 kV line.
Fig. 3 plots the estimates from Tables 2 and 3 for one typical transmission line. Both the graph and the numbers show that utilities have a range of options which are, as a median, thirty times more cost effective than those choices open to individual customers. The only customer option that has gained advantage in the past 10 years is the pervasive use of lithium-ion batteries and USB charging cables to form nanogrids of portable electronics and computers.
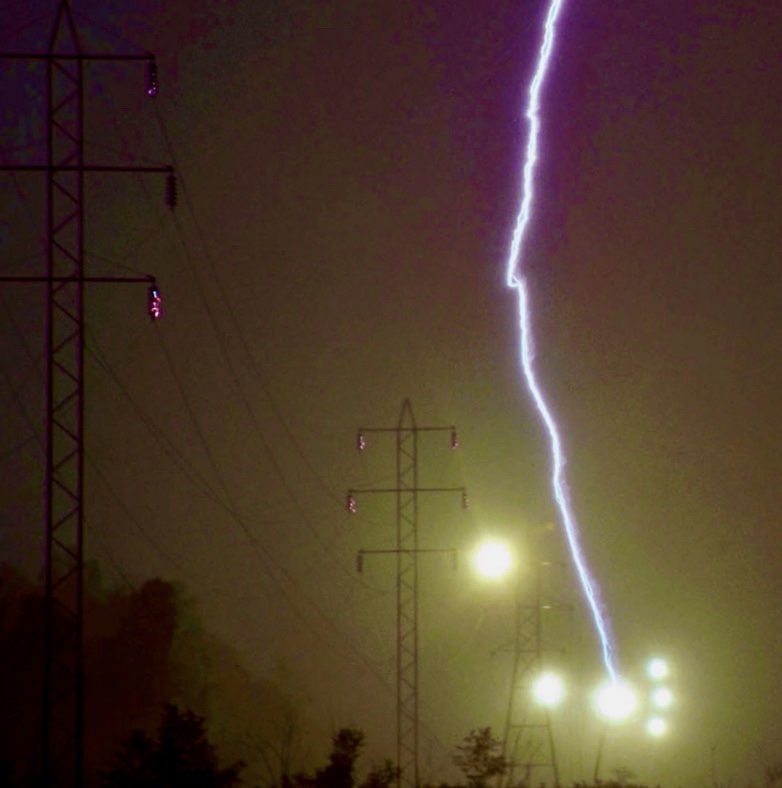
Lightning, Grounding & Insulators
Utility investment in lightning protection delivers an extremely low cost per avoided momentary dip, compared to the choices an individual customer can make. Lightning is also a good starting point for discussion of the costs utilities already pay to avoid customer momentary dips. In most places, lightning is the most frequent cause of momentary interruptions. In addition, the costs of lightning mitigation are easier to break out of an overall line cost. The industry is now increasingly facing choices which might further impact reliability, e.g. gapped or gapless arresters, partial or full treatments, as alternatives rather than supplements to traditional overhead groundwires and good grounding.
Cost of Avoiding Momentary Dips with Overhead Groundwires
Costs on Transmission Lines
In 1990, a CIGRE working group reported that a median 4 percent of the cost of a transmission line is associated specifically with the overhead groundwires. In addition, the extra height and overturning moment from side wind loading adds to the cost of structures, be they wooden poles or steel lattice towers. Overhead groundwires also need good ground electrodes at every tower in order to function effectively. Overall, the sum of these various capital costs amounts to at least 10 percent of total line construction costs.
Many utilities in recent years seem to believe that their transmission line construction costs are well above a perceived industry average. However, a review of such costs filed with public review boards and available on the Internet does not support this perception. Typical 230 kV double circuit, single large conductor transmission lines show published construction costs of about US$ 300,000 to 500,000 per kilometer, leading to a median estimate of about $ 400,000/km. There are admittedly some anomalies in difficult areas – for example the Sunrise Powerlink 230 kV/500 kV line in southern California seems to have cost about $1.9 billion for 188 km, crossing the threshold of $10,000,000/km. Overhead groundwires are a part of nearly all transmission line designs, and the utility capital investment is therefore about $ 40,000 per km on average.
Benefits on Transmission Lines
The benefit of lightning protection by overhead ground wire can be measured by computing how many momentary dips are avoided by customers. The number of lightning flashes to a line in any region can be estimated (e.g. CIGRE 63/IEEE 1243) from an attractive radius based on the height at the tower ‘ht’:
Ra = 14 ht 0.6
The line length times the collection width (2Ra + maximum separation for lines with more than one OHGW) gives an exposure area. Typically, line engineers normalize to a line length of 100 km for reporting outage rates. For 100 km of line, the number of flashes will be the exposure patch times the local ground flash density Ng, also expressed in flashes/km2/year.
Nflashes=Ng/10 (2Ra+b)
Ng can be obtained from lightning location system records or converted from the optical transient density values measured by NASA starting in 1995.
A typical 230 kV transmission line with 35 m towers has Ra=118 m. In an area with moderate ground flash density (Ng=3 flashes per km2 per year), 100 km of this average line would receive about 74 flashes per year. Any fault on the transmission line would affect about 40,000 customers – more for EHV and double circuits, fewer for 115 kV and 138 kV lines. Using the median 40,000 customers, there would therefore be (74 x 40,000)=3 million customer dips per year in the event of no overhead groundwires.
Properly placed overhead groundwires, combined with a target value of footing impedance of less than 25Ω, will be remarkably effective on this 230 kV line. Estimates suggest that the lightning tripout rate will fall from 74 tripouts to 1.5 tripouts per 100 km per year. This represents an efficiency of 98 percent. If the terrain is difficult and the tower resistance is 50Ω, then the outage rate will rise to about 5.8 per 100 km per year because the efficiency of protection drops to 92 percent. The conversion of the outage rate with overhead groundwires into the cost of avoided momentary dips is detailed above in Table 3. The cost of the overhead groundwires, i.e. $ 4 million, is divided by the number of customer dips mitigated over the 50-year life of the wires. This gives a benchmark value of about 3 cents each.
Improvements to grounding tend to last only about 15 years before corrosion and theft combine to cause effective end of life. Even with this short lifetime, if all towers can be improved from 50Ω to 25Ω at a cost of about $ 300 each, then the utility can make further improvements in reliability at a reasonable cost.
Distribution Lines
The ways in which distribution lines are affected by lightning differ greatly from transmission lines. With their lower levels of insulation, nearly every direct flash to a line will cause a phase-to-ground flashover and tripout. Nearby vertical lightning flashes also generate high electromagnetic fields which are also coupled into the horizontal wires. This coupling mechanism leads to induced voltages that increase with line height. If the soil is resistive, the effective wire height above ground is greater, giving higher peak values of voltage.
Standards such as IEEE 1410TM for preventing induced overvoltages from nearby lightning call for a minimum of 300 kV BIL, rising to above 400 kV BIL if the soil resistivity is high.
The trade-off between providing lightning protection on distribution and transmission systems in an integrated power system is usually won by the transmission groups. In many cases, the cost per avoided momentary dip when making improvements to distribution lines is more than one dollar. However, in urban areas with many customers and short feeders, the costs go down and this trade-off is certainly something which should continuously be evaluated when setting budgets.

Cost of Avoiding Momentary Dips with Other Alternatives
The technologies of greatest interest for improving lightning performance are:
• Insulators with higher impulse strength (meaning greater dry arc distance)
• Line surge arresters which limit the voltage across individual insulators
Table 3 shows that, in the case of an average transmission line, neither of these technologies delivers quite the same value as overhead groundwires under standard conditions, based on the stated assumptions. However, there are many factors which could shift the balance, including:
• Longer component life with externally-gapped arrester systems;
• Longer service life of polymer insulators;
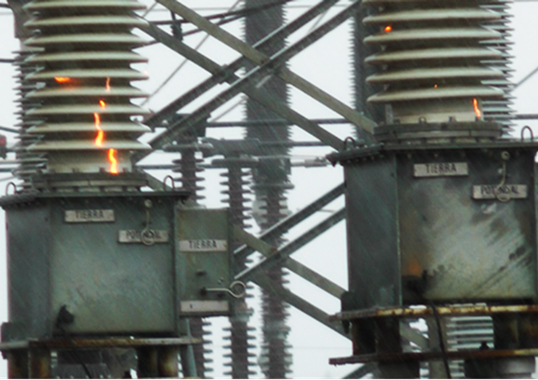
• Wood construction which can take advantage of “free” additional impulse strength, while mitigating the leakage currents that cause pole fires;
• Higher rate of corrosion or theft of grounding conductors;
• High soil resistivity, making it impossible to achieve the desired 25Ω at any cost.
Longer Insulators on Shielded Lines
The benefits on lightning performance for improved insulation are significant when overhead groundwires are used. Table 3 shows that, without changing the grounding from 50Ω to 25Ω, the use of 3 m insulation instead of the typical 2 m dry arc will have a cost per avoided momentary dip of about 15 cents. The cost of changing out insulators is high and the choice of 30 years as the median estimated lifetime of a polymer insulator remains to be verified.
Line Surge Arresters on Every Phase of Shielded Lines
Transmission line surge arresters, fitted to all three phases of the line, do not require nearly as much work as changing out the insulators and, with this solution, nearly all lightning outages will be eliminated. However, the additional components which make up a typical line surge arrester installation will have a failure rate of about 0.5 per 10,000 per year, i.e. similar to other high-quality transmission line components. Some of these failures may not cause outages right away. But others will and this is also factored into the data shown in Table 3.
Line Surge Arresters on One or Two Phases of Shielded Lines
The preference these days in transmission line surge arrester application, for example in CIGRE Technical Brochure 440, seems to be partial rather than full installation. When an arrester is placed on a single phase, the wire is essentially converted into an additional overhead groundwire. This has an important and somewhat mysterious benefit. With an extra conductor raised to the high potential of the footing under lightning surge conditions, all of the other phases will take up a higher fraction of this voltage. This is referred to as coupling (transverse electromagnetic or TEM surge impedance coupling for the specialist) to distinguish it from other sorts which are more important on distribution lines. The voltage stress on the line insulation is the difference between the tower voltage and this coupled voltage on the phase conductors. Higher coupling will reduce this difference, effectively improving performance by raising the ‘threat current’ which would cause a flashover from tower to phase.
By enhancing coupling, a single surge arrester per phase can achieve a significant improvement in lightning performance – equally beneficial to improving the grounding. In this regard, if line surge arresters could deliver 30 years of reliable electrical and mechanical service rather than the demonstrated 7 to 15 years, this technology would become extremely competitive with campaigns to re-ground lines periodically.
Line Surge Arresters on Unshielded Lines
Presentations on line surge arresters have noted that the most significant advantage of gapless or externally gapped zinc-oxide surge arresters could be in areas of high (and consequently highly variable) footing resistance, and where wind and ice loads are also high. Their use to replace rather than supplement traditional overhead groundwire protection has the greatest financial impact, but also the highest level of risk. The use of externally-gapped line surge arresters (also known as current limiting arcing horns or CLAH) is widespread in Asia and some spot applications are starting to appear in North America.
Designs which focus on achieving superior performance with partial arresters rather than with overhead groundwires are often of greatest interest. Externally-gapped line surge arresters have no flexible or moving parts so they are likely to be mechanically more reliable than gapless arresters. Under adverse weather conditions which produce icing and galloping, this is a big advantage. However, there is more application risk for externally-gapped arresters on unshielded transmission lines and this relates to the sharing of surge energy.
Even in areas of high average soil resistivity, there are often a few towers where the soil is deep and footing resistance is low. At these towers, the arrester energy dissipation can be so much greater than average that the application of suitable devices becomes prohibitively expensive. This energy duty can be managed to some extent by:
• ensuring that all towers have the same footing impedance;
• selecting arresters with well-controlled characteristics; or
• making use of the resistance of concrete or composite poles.
This issue is more important for externally-gapped arresters than for gapless designs because fewer of them will participate in the current sharing.
Reclosers
Automated switches in distribution and transmission systems are used to interrupt electrical fault current and then quickly reclose. There is an expectation in such recloser applications that the arc across the insulation will weaken sufficiently to self clear. However, if the system voltage exceeds the voltage needed for arc re-ignition, the fault does not clear properly. This can lead to two or more switch opening and closing sequences after which the reclosers lock open and must be manually reset.
A 2001 study of American utilities brought out an interesting finding: recloser outage sequences can cause nearly four times as much equipment damage to customers as do normal interruptions. Heavy equipment in particular is strained and damaged by stopping and restarting so rapidly. For example, the average cost of equipment damage in such cases was US$2001 2011 per recloser outage, compared to a median of $ 554 for 1-second, 3-minute and 1-hour interruptions. This finding represents an important limitation to the application of additional reclosers on a system in order to improve power quality.

Conclusions
Overhead groundwires can offer an extremely wide range of return on investment, expressed as a cost per avoided customer momentary dip. They usually represent an excellent value on critical transmission lines serving many customers in that they typically lead to mitigation costs of less than US$ 0.10 per customer dip. By contrast, many consumers have invested in lithium ion batteries to support a reliable “nanogrid” electrical supply to their computers, at a premium these days of about $0.40 per avoided customer dip and computer re-boot.
Any option considered for improving transmission line lightning performance, including longer insulation and line surge arresters, needs to be considerably more cost-effective at the utility level than the choices available to, and selected by, individual customers. For sub-transmission lines in areas of difficult grounding and having low lightning activity, overhead groundwires offer poor value of more than US$ 1.00 per dip. This investment is difficult to justify when compared to alternatives such as line surge arresters or automatic switchgear.
[inline_ad_block]