Application of room temperature vulcanized silicone coatings to glass insulators has grown worldwide as utilities look to keep the beneficial properties of toughened glass while also enhancing pollution performance. But quantifying the hydrophobicity transfer properties of coated insulators is complex and common practice has therefore been to dimension them conservatively using the same USCD as for uncoated glass.
Direct comparison of the relative performance of hydrophobic, coated glass with the steady hydrophilic behavior of the uncoated glass is key to understanding the dynamics of hydrophobicity in service. Fortunately, advances in leakage current monitoring sensors have now made this possible by allowing large amounts of data in the field to be collected in real time and under normal operating conditions. Moreover, work done within different CIGRE Working Groups has provided new knowledge, including proposals to standardize pollution test procedures for coated glass insulators.
This edited past contribution to INMR by experts at La Granja Insulators presented a probabilistic approach for dimensioning coated glass insulators in polluted environments based on leakage current monitoring, quick-flashover tests and comparing relative performance. This methodology can help evaluate flashover risk and quantify the benefit of hydrophobicity when dimensioning coated glass insulators in polluted service areas.

Approaches to Dimensioning
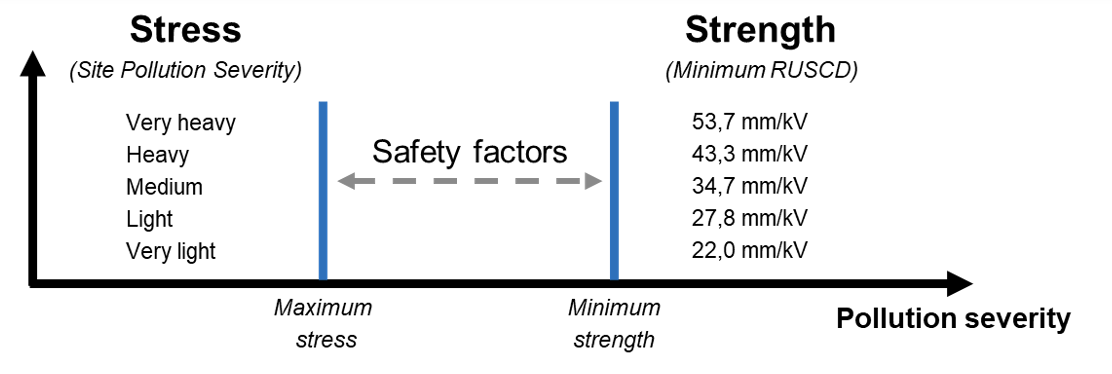
The deterministic approach is used widely for insulator dimensioning and is based on a worst-case analysis with safety factors to cover unknowns, as per IEC-TS 60815. However this approach can result in over-dimensioned designs given its significant limitations in reflecting the dynamic properties of hydrophobicity transfer materials (HTM) such as silicone coatings.
By contrast, a probabilistic approach for dimensioning insulators in polluted areas has been shown to be more effective. Such an approach considers the stress and the strength as probabilistic variables to evaluate risk for flashover of potential designs. Those designs are then selected that yield adequate insulator performance with respect to pollution conditions. Unfortunately, characterization of pollution severity, as typically done by means of ESDD measurements, results in limited available data to fit well into statistical distributions. Moreover, as with the deterministic approach, the benefits of hydrophobicity are not considered or developed into this approach.

Probabilistic & Dynamic Approach
Based on the probabilistic approach, this approach aims to include the dynamic effects of hydrophobicity of insulators in service so as to quantify the pollution performance enhancement offered by the silicone coating:
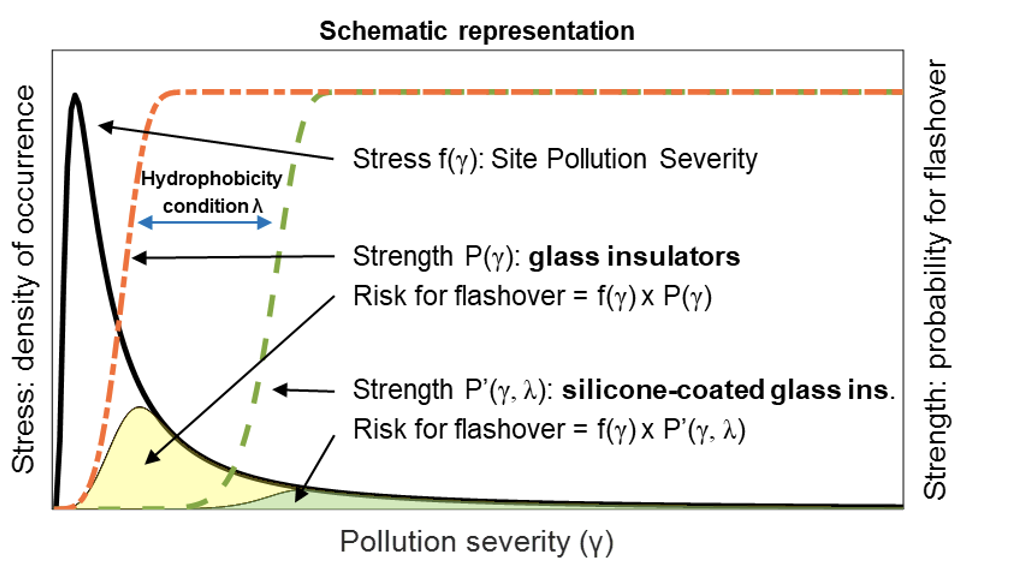
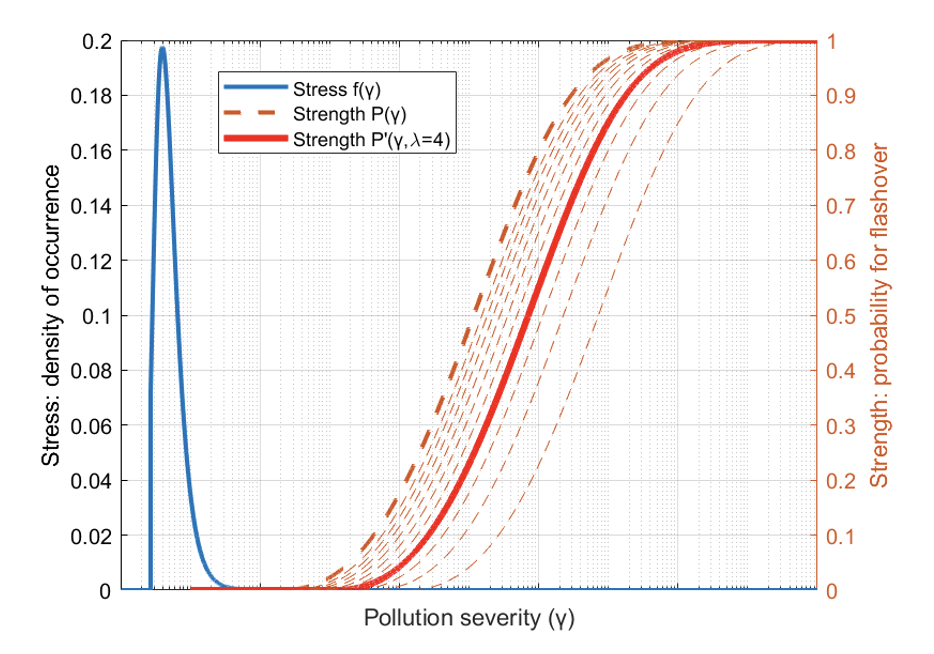
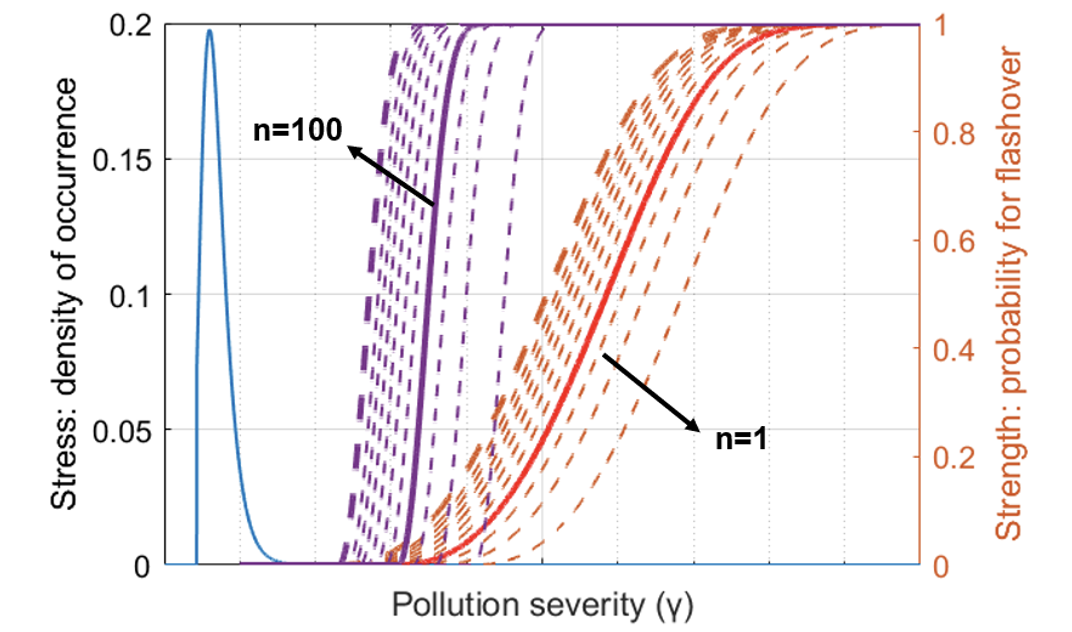
• Pollution stress of the site is described by the probability density function f(γ) of an extreme value distribution expressed in terms of site severity “γ”;
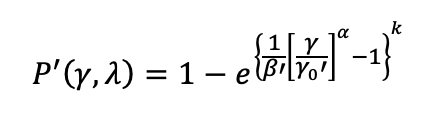
• Insulation strength is described by the cumulative distribution function P’(γ,λ) of a three-parameter Weibull distribution as a function of the same measure of site severity “γ” and a new term, “λ”, which expresses the hydrophobicity condition of the surface of the insulators. Note that, in case of uncoated glass insulators with the same insulator type, string configuration, etc, the strength function is expressed only in terms of site severity P(γ) and represents the hydrophilic condition
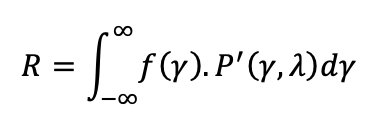
• Multiplying the f(γ) x P’(γ,λ) functions yields the probability density of flashover. Flashover risk is given by the area below the curve.
Monitoring Pollution Severity
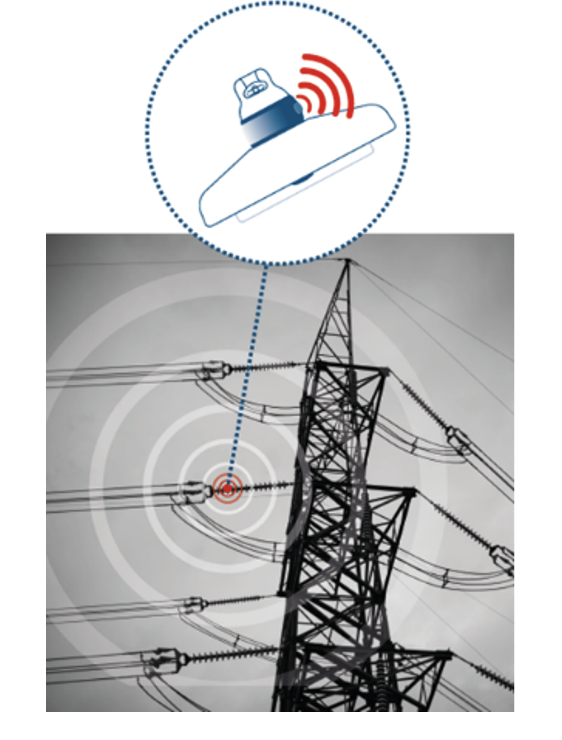
Leakage current (LC) across an insulator string is a suitable parameter to assess its pollution performance. This is because, unlike other methods such as measuring ESDD and NSDD, leakage current reflects the wetting effects of the environment on the pollution layer. This can be monitored in real time on energized insulator strings in service and used to monitor pollution severity on glass strings as well as the hydrophobicity condition of silicone coated glass. In addition, the large amount of LC data monitored in the field allows for a good fit of the stress distribution f(γ) as well as the hydrophobicity condition (λ).

Site Equivalent Salinity
The relationship between leakage current in the field and standardized laboratory pollution severities can be established through testing. Site equivalent salinity is the pollution level of salt fog tests, according to IEC 60507, that yields comparable leakage current levels on the same insulator string, at the same voltage as in service.
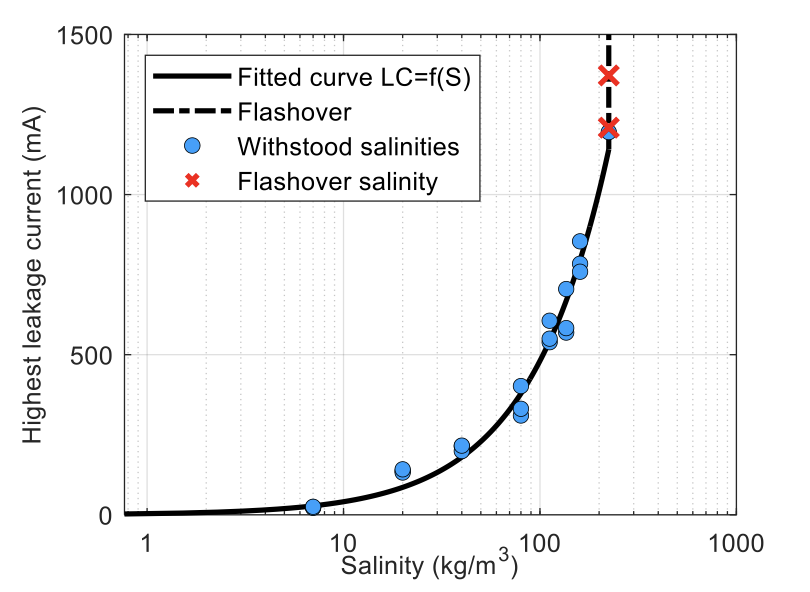
Note that the pollution severity (γ) for stress and strength functions must be expressed in the same terms, e.g. in case of pollution associated with coastal areas (type B) i.e., salinity (kg/m3).
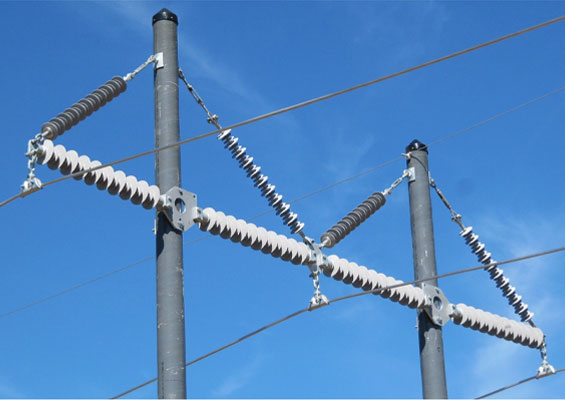
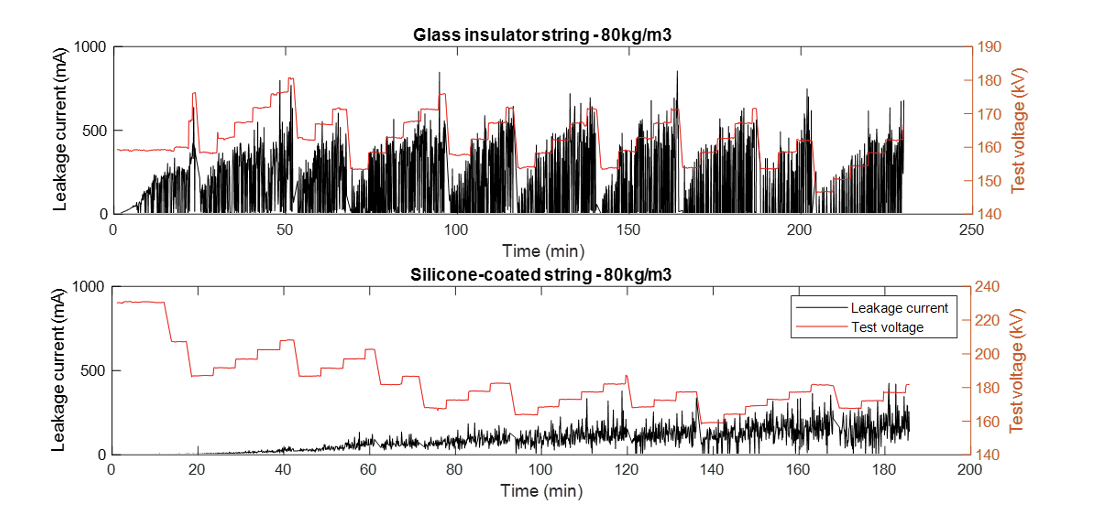
Data from the Field
Example of data collected from the field involved two ‘mirror’ insulator strings composed of (1) glass and (2) silicone-coated glass insulators, energized at 220 kV and monitored for a period of more than 3 years. To select the statistical distribution that best fits the LC data, several techniques were employed, such as the log-likelihood, AIC (Akaike) and BIC (Bayesian information criterion). Generalized Extreme Value (GEV) Type II, or Fréchet, yielded the best metrics.
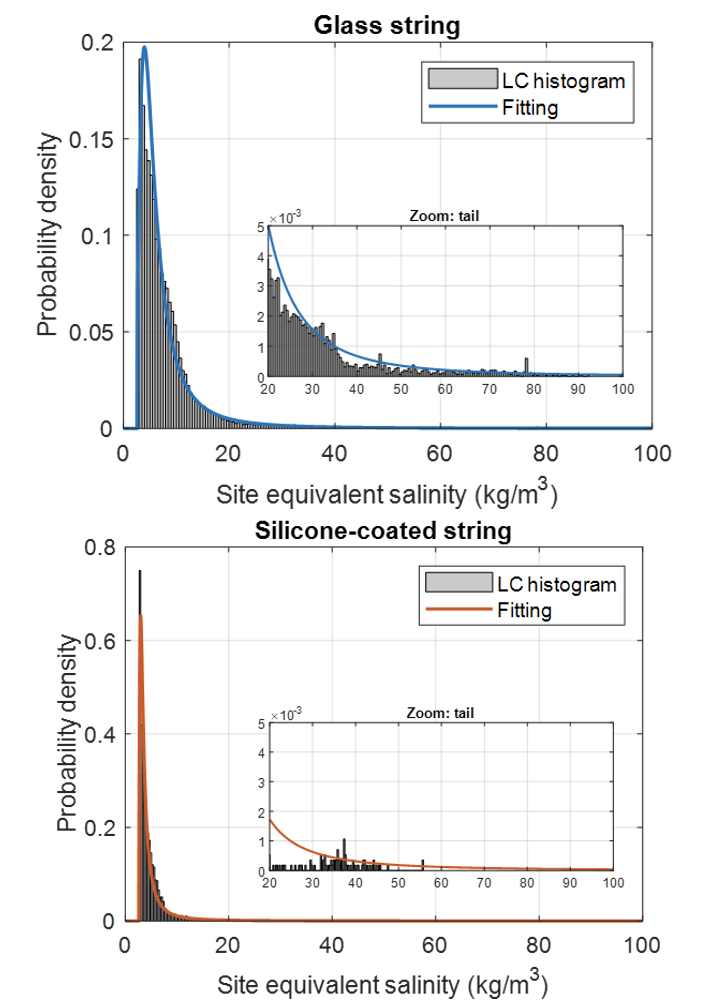
Loglogistic and lognormal distributions could also have been used but a worse fit was observed on the tail. By contrast, GEV fit well for both uncoated glass and silicone coated strings. As expected, LC values were lower for the silicone-coated strings. Particularly, when comparing the ‘tails’, the benefit of the silicone coating becomes clear.
The damping ratio (ζ) concept was developed to express statistically the ratios LC silicone-coated / LC glass:
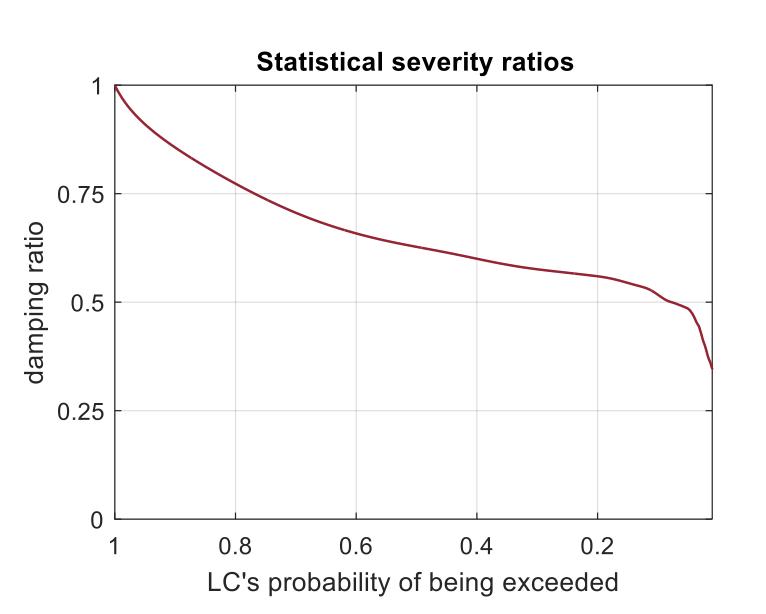
ζ = 1: Leakage current is the same in both strings, coated and uncoated. That typically happens when LC=0 with a 100% probability of being exceeded.
ζ < 1: Leakage current of the silicone-coated is lower (damped) than for the uncoated string. It is interesting to observe that damping is most effective for the highest currents, with less probability of being exceeded (the peaks), thereby demonstrating the real effectiveness of coatings.

Insulator Strength
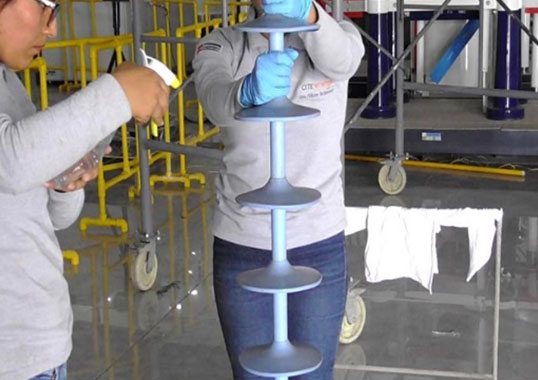
Quick-Flashover Tests
This procedure was initially established as a diagnostic method for naturally and artificially aged composite insulators. However, recent experience has indicated that the method can also provide valuable information when applied to new insulators.
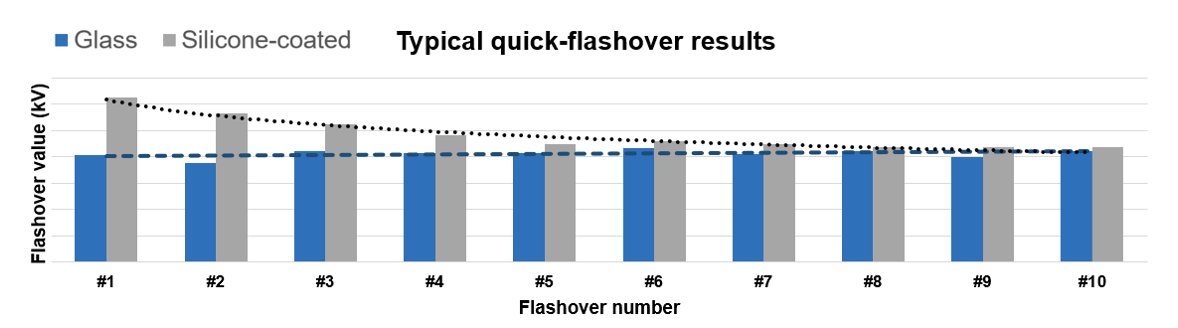
Research has found that the recurrent application of flashovers to silicone coated glass insulators leads to progressive reduction in their hydrophobicity, reaching a quasi-stable hydrophilic state after around 10 flashovers. (Note that number of flashovers may depend on insulator type, string configuration, test arrangement, etc.). This makes it possible to establish a relationships between number of applied flashovers in the laboratory and hydrophobicity of silicone coated insulators.

The test procedure was based on a proposal for standardization as in Cigre TB 691 but using a different way to evaluate data and results:
• A conditioning period of 20 minutes is applied at the specified salinity level. Voltage at this stage is about 90% of the estimated flashover voltage;
• After this conditioning period, test voltage is raised in 5% increments and kept for one minute at each level until flashover occurs. After flashover, the insulator is immediately re-energized at its initial voltage (90%);
• Test voltage is then raised in steps of between 2.5% and 3.5% every 5 minutes until flashover.
• Test is continued with 90% of the previous value of flashover voltage until the required number of flashovers has been obtained i.e. 10 flashovers. Standard deviation of the last 5 flashovers is recorded and if it exceeds 5%, the test shall be carried out to obtain 5 additional flashovers.
When comparing results with those obtained from testing a glass insulator string with steady hydrophilic performance, it can be observed that flashover values tends to converge. Identical trends were found when analyzing the leakage current.
Defining hydrophobicity level (λi) as the hydrophobicity condition of the silicone-coated glass insulator string after i flashovers in a QF test. And the damping ratio as the relative performance between silicone-coated / glass strings. It is possible to fit equations linking the performance of silicone-coated insulators in terms of conductance (LC/U) and flashover values to the hydrophobicity levels.
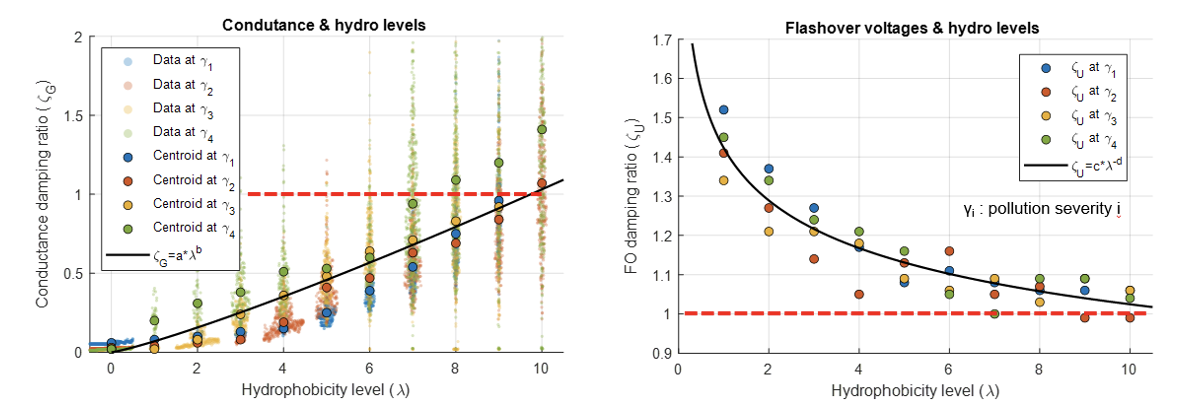
Note how both start at ζ = 0, which is the fully hydrophobic condition, and then tend to converge to ζ = 1, which corresponds the worst-case hypothetical scenario of losing completely the hydrophobicity (non-coated).

Insulator Strength
The pollution curve of a glass insulators string can be expressed as follows:
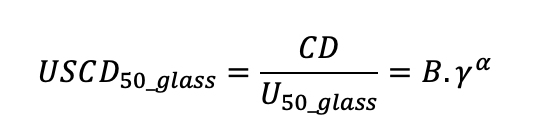
• CD is the creepage distance of the string (mm);
• U50 is the voltage level with a 50% flashover probability;
• γ is the pollution severity;
• B and α are experimental constants.
Combining the previous equation with the FO damping ratio, ζU, pollution curves for silicone-coated glass insulators can be expressed as a function of pollution severity (γ) and hydrophobicity level (λ):
 Strength is described by the cumulative distribution function of the strength of a three-parameter Weibull distribution. The fully hydrophilic condition, corresponding to glass insulator strings, which can be taken as the base and does not depend on hydrophobicity condition, (λ), is expressed as follows:
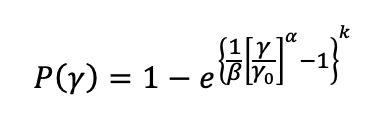
where:
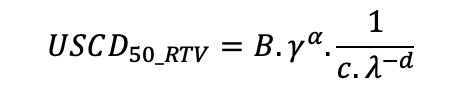
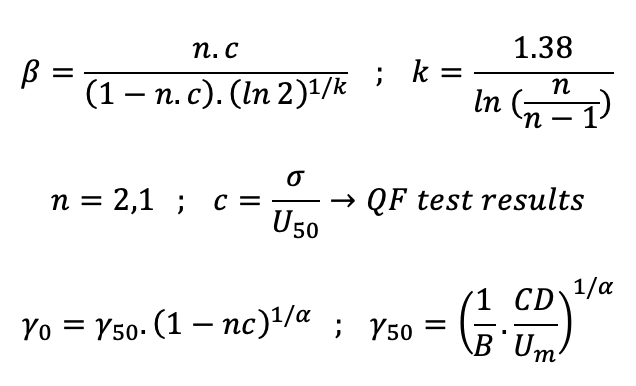 Combining flashover damping ratios, ζU, described in the previous equation, silicone coated glass insulator strength can be obtained as a function of pollution severity and hydrophobicity condition:
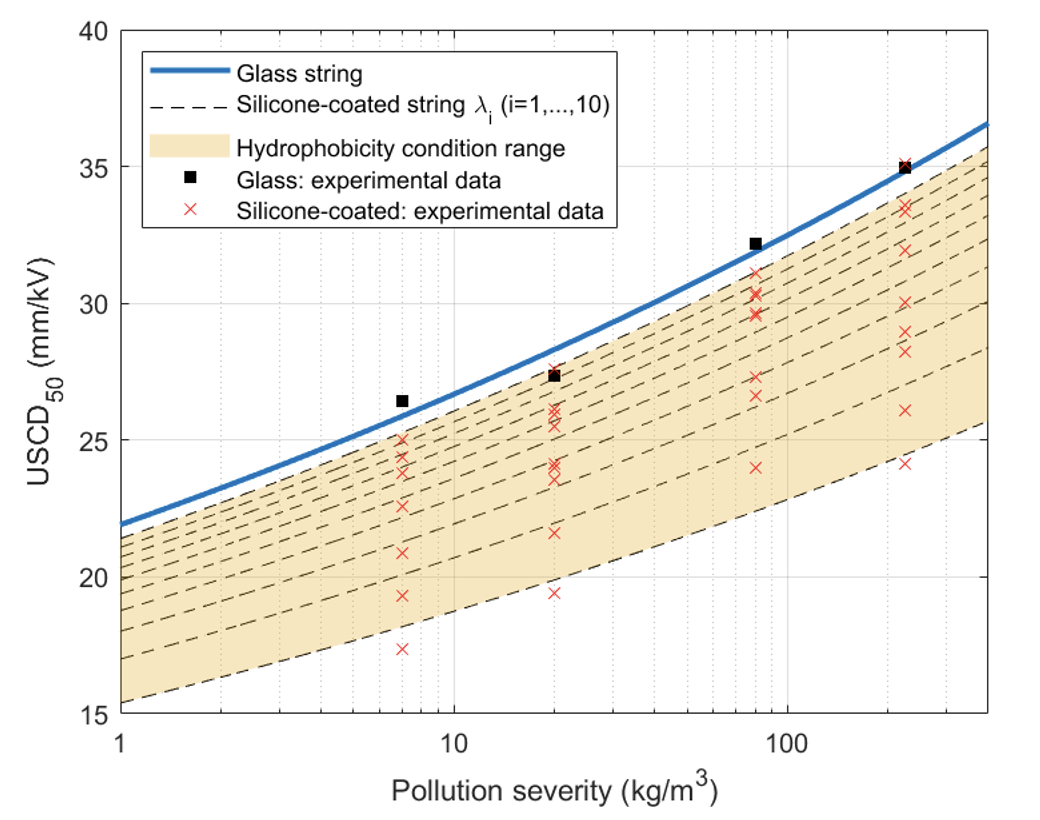
 Comparison between natural and artificial pollution tests has shown that the deviation for natural tests is greater than for artificial tests. In this respect, it is possible to adjust the above parameters to spread the deviation.
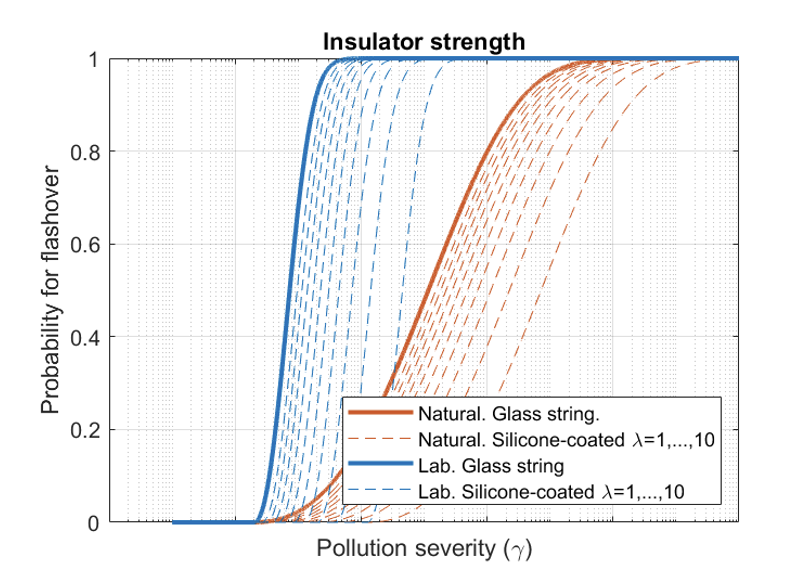
The dashed lines represent the different hydrophobicity levels of the insulator string (λ=1,…,10) while the solid line the fully hydrophilic condition corresponding to uncoated glass. It is nonetheless important to note that field experience shows that hydrophobicity is never fully lost, thereby always maintaining the benefit of a silicone coating.
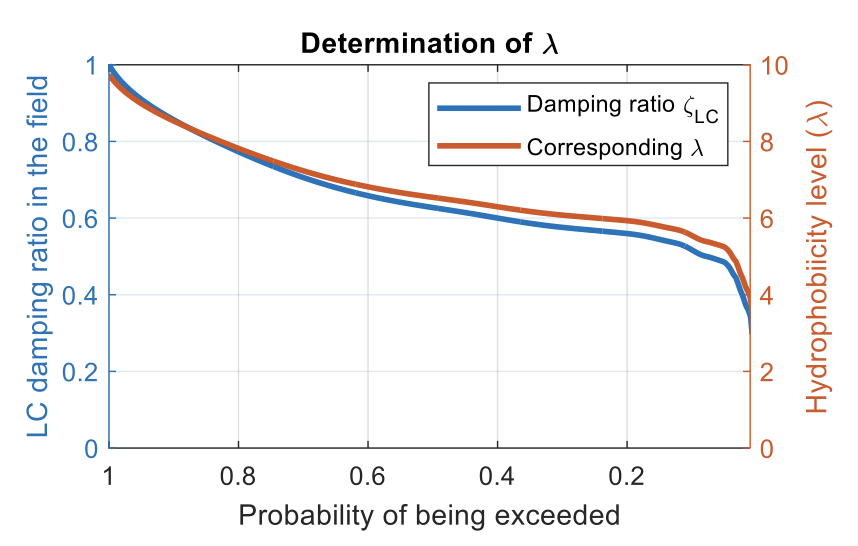
The hydrophobicity condition λ can be determined by equating and solving the equivalent damping ratios monitored in the field and obtained in laboratory:
ζLC_field ↔ ζG_lab (λ)
In this case: λ = 4. Note that, a period of time long enough to reach a stable surface condition is needed to obtain consistent results. Possible ageing effects can be simulated by projecting a higher λ.
As mentioned, it is interesting to observe that damping is more effective for the highest leakage currents, with less probability of being exceeded (the peaks). In other words, silicone coated insulators better reduce the highest leakage currents, demonstrating the benefit of hydrophobicity as well as effectiveness of a coating.
Stress-Strength
The multiplication f(γ) x P’(γ,λ) function gives the probability density of flashover and risk of flashover is given by the area under the curve:
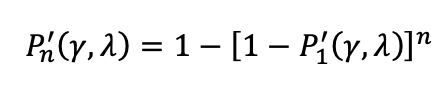
String designs with different numbers of insulator units can be compared and evaluated by computing string creepage distance. If multiple silicone coated insulator strings are installed on the same line and exposed to the same conditions, risk of flashover increases as follows:
Conclusions
• A probabilistic method for dimensioning silicone-coated glass insulators in polluted environments was developed based on leakage current monitoring in the field and quick-flashover laboratory tests.
• Pollution stress at site is well described by an extreme value distribution (Fréchet).
• Pollution strength of silicone coated glass insulators is defined by a three-parameter Weibull distribution that includes a novel concept of hydrophobicity level (λ), which covers performance from fully hydrophobic to the hydrophilic condition. The latter is obtained from testing an equivalent uncoated glass string.
• This methodology is useful to evaluate flashover risk and to quantify the benefits of hydrophobicity when dimensioning silicone coated insulators for service in polluted areas.
References
[1] H. de Santos and M. Á. Sanz-Bobi, “Novel Approaches to Assess the Mechanical Reliability of Toughened Glass Insulators Used in Transmission Lines,” in IEEE Transactions on Power Delivery, vol. 37, no. 3, pp. 2083-2089, June 2022
[2] CIGRE Working Group D1.44, “Pollution test of naturally and artificially contaminated insulators,” Technical Brochure 691. 2017
[3] CIGRE Working Group B2.69, “Coating for improvement of electrical performance of outdoor insulators under pollution conditions,” Technical Brochure 837. 2021
[4] H. de Santos and M. Á. Sanz-Bobi, “Research on the pollution performance and degradation of superhydrophobic nano-coatings for toughened glass insulators,” Electr. Power Syst. Res., vol. 191, p. 106863, 2021
[5] C.S. Engelbrecht, R. Hartings, J. Lundquist: “Statistical dimensioning of insulators with respect to polluted conditions”, IEE Proc.-Gener. Transm. Distrib, Vol. 151 No.3, May 2004, pp. 321-326.
[6] Pigini, A., Gutman, I.: Evaluation of the performance of polluted insulators: the IEC simplified approach against the statistical approach. INMR World Congress (2013)
[7] H. de Santos and M. Á. Sanz-Bobi, “A Cumulative Pollution Index for the estimation of the leakage current on insulator strings,” IEEE Trans. Power Deliv., vol. 35, no. 5, pp. 2438–2446, 2020