The IEC’s first Guide for selecting insulators with respect to pollution in was published in 1986 and standardized the concept of creepage distance. Although the Guide quickly found application due to its simplicity, field experience did not always prove successful. For example, in highly polluted environments adding creepage alone did not guarantee satisfactory performance. In fact, it was soon understood that other insulator parameters, such as profile/shape and material, also had to be taken into account.
By the early 1990s, it had become clear that the old IEC 815 needed substantial revision to address deficiencies as part of a project aimed at revising and updating this standard to cover AC and DC as well as all types of insulator technologies. This work started in 1994 and the result was a reference document that would form the basis for future guidelines.
The ‘review of current knowledge’ document was published in 2000 as Cigré Brochure 158. Work then continued with development of Guidelines for Selecting and Dimensioning Outdoor Insulators for AC systems, published in 2008 as Cigré Brochure 361. The final task was to develop similar guidelines for DC systems, issued as Cigré Brochure 518.
This edited contribution to INMR from 10 years ago by industry expert, Chris Engelbrecht, remains valuable since it reviews some of the key basic principles that have not changed over time.
DC Versus AC Pollution Flashover
Development of pollution flashover under DC energization features some important differences versus under AC:
1. DC energized insulators accumulate more pollution since, under low wind speeds, electrostatic attraction of pollution particles under unidirectional electric field dominates deposition by aerodynamic action. On AC energized insulation, by contrast, there is little to no attraction of pollutants by the alternating electric field. Indeed, research suggests that the ratio of DC to AC pollution deposition in the same service environment can vary by as much as a factor of 10.
2. With the absence of voltage zeros, dry band arcing under DC is more likely to grow into flashover. This differs from the case under AC where dry band arcs must re-ignite after each voltage zero. DC dry band arcs are also more mobile and likely to leave the insulator surface to propagate through air. This requires development of special profiles for DC insulators to ensure effectiveness of the creepage distance. Another result of this difference in flashover development is that the relative flashover strength of DC insulation deteriorates more, compared to AC insulation, for any given increase in pollution severity (illustrated conceptually in Fig. 1.)
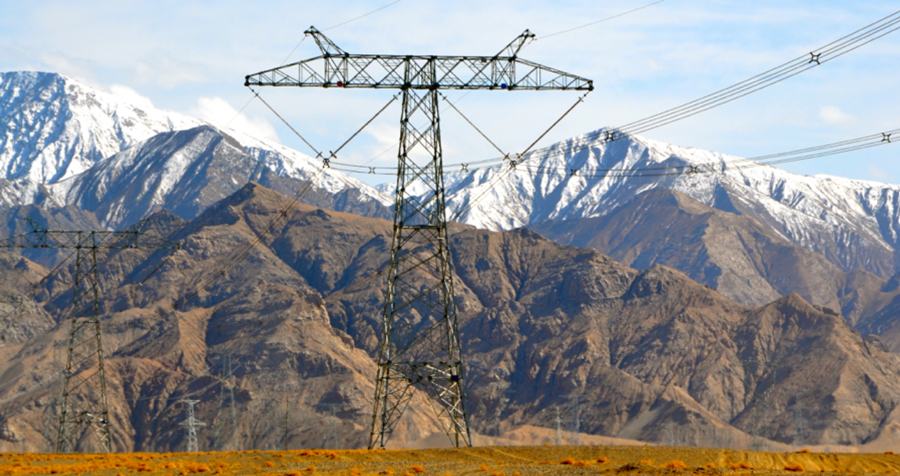
3. Relative to other insulation stresses, pollution performance of insulators is usually the parameter that dictates insulation design for HVDC systems. This differs from AC systems where insulation distances are typically determined by lightning or switching performance required of the line or substation (illustrated in Fig. 2 for EVH and UHV system voltages).
Fig. 2 also shows that extreme insulation lengths may be necessary in polluted areas, forcing system planners to reconsider any project and evaluate alternatives such as different line routes (i.e. avoiding polluted areas) or implementing cables or indoor switchyards – all to minimize number of external insulation surfaces. As a result, there is an urgent need to look at insulation design for HVDC systems at the earliest stages of a project and much sooner than would be customary for AC systems. It is also much more important to follow a detailed design process because of the potentially great impact of either over-dimensioned or underperforming insulation.
Holistic Flow Chart Methodology
In past Cigré Guidelines, designers were encouraged to follow an exhaustive approach with the aim of minimizing uncertainties in input data and any resulting impact on final design. Dimensioning principles were introduced based on a flow chart (see Fig. 3) to provide a holistic overview and context for each activity required. Overall design strategy is shown in the vertical column of numbered blocks on the left. A number of alternatives for obtaining the relevant information are then presented such that the further right one moves the less certain the results. For example, when determining site pollution severity, information collected from existing DC lines will provide far more accurate results than a purely qualitative estimation.
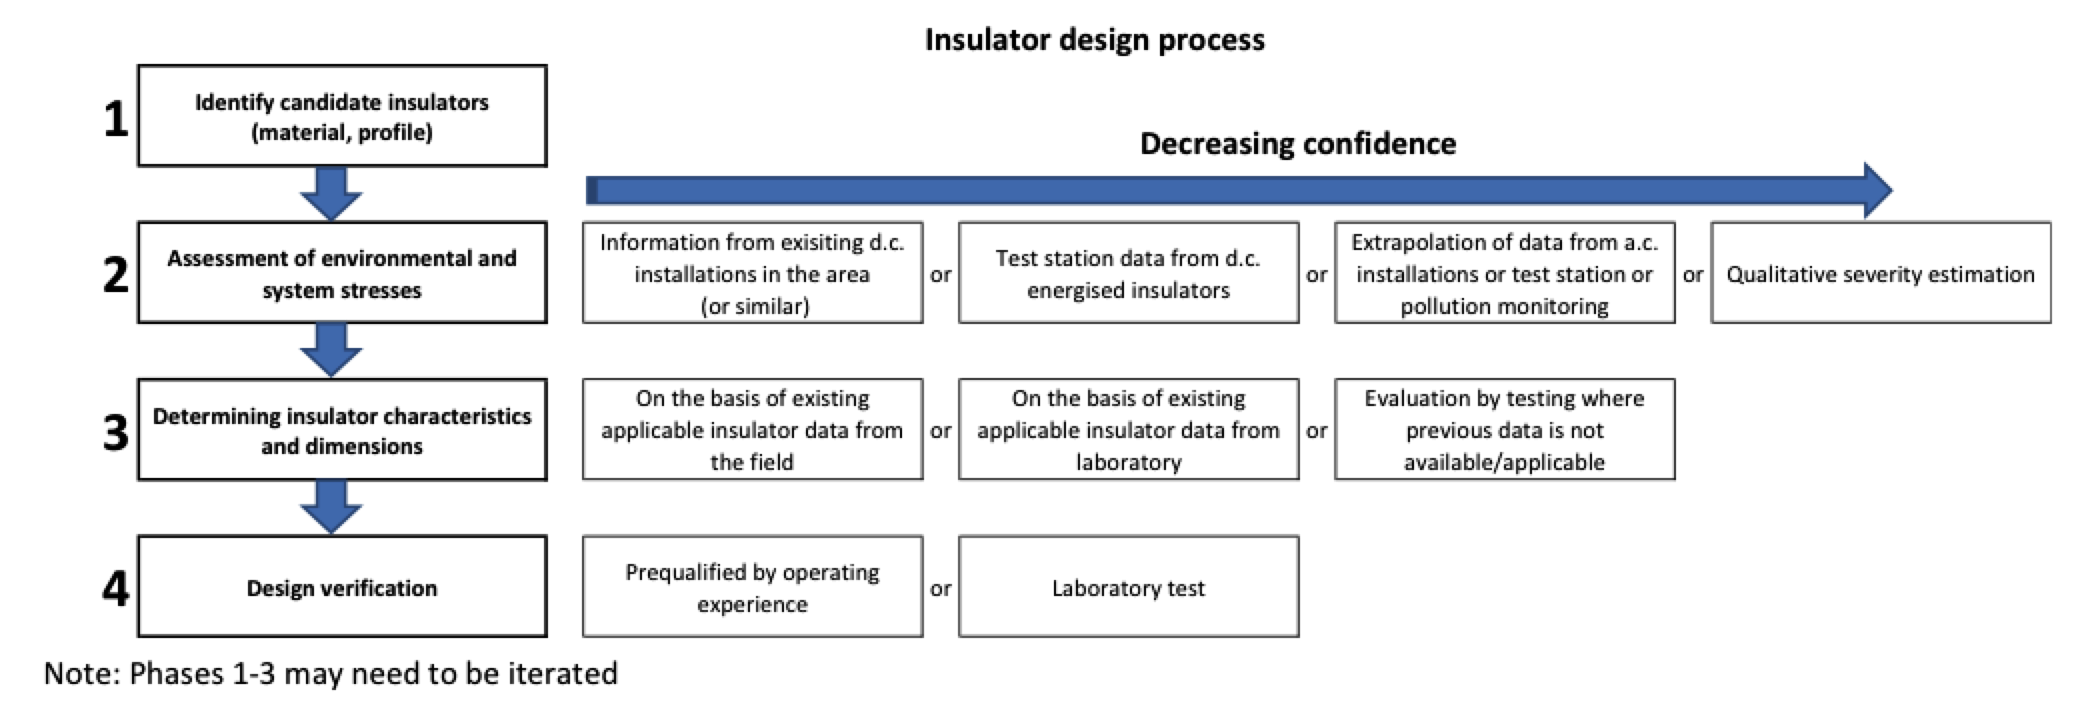
The various activities in the flowchart can be summarized as follows:
1. Identify Candidate Insulators
Due to special demands, some insulator types are specifically optimized for HVDC applications in terms of insulating materials and shed profiles and there is limited choice available. Nevertheless, choices still need to be made in regard to type, insulation material and profile for insulators that will be utilized at any particular location. Initial selection of a candidate insulator is usually based on a simplified preliminary site assessment. This choice could then be revised over time as more detailed information about site conditions becomes available.
2. Assess Environmental & System Stresses
Ideally, pollution deposition measurements over several years are needed to provide accurate data on the nature and severity of pollution at any given site. In the case of DC applications, it is especially important these measurements be performed on insulators that are energized to a representative DC stress. Since this is not always feasible, other techniques may have to be employed to obtain this information. For example, if there is data on performance of HVAC installations in the area, it may be possible to ‘translate’ this to HVDC. But such a methodology is purely indicative and designers must still make assumptions about differences in pollution accumulation on DC versus AC energized insulators. It is also possible to use a general environmental assessment to identify a comparable environment in a different location where an HVDC installation is already in operation. Data from this installation could then be useful in insulation design and selection for the new project.
3. Determine Insulator Characteristics & Dimensions
The most accurate way to select insulators for any new installation is to directly determine risk of flashover based on service experience of DC lines and substations in the same area or having similar environmental conditions. Flashover risk can also be obtained utilizing test stations where performance of a range of pre-selected insulators is monitored under DC voltage at locations considered representative of the new line and station corridor.
Where there is previous experience with DC lines in the same area, excellent data on insulator performance is available on which to base preliminary design. If there is a lead-time of a year or more, good data can also be obtained from installing energized insulators at field stations sited at representative locations along the line as well as at the converter station. Insulators at such field stations must be energized to representative stresses to take account of the significant influence of electrostatic field on pollution accumulation.
Instead of determining risk of flashover directly, it is also possible to follow a simplified deterministic approach during design. In this simplified method, pollution stress (i.e. maximum pollution on the insulator) is determined from measurements and through site condition studies. Insulator strength is then estimated from published information or based on performance data summarized in guidelines with correction factors applied to correlate test conditions with actual site conditions. Such data are then used to make a rough selection of insulator type, material and dimensions.
4. Verify Design
This is the last step in the process whereby the chosen insulation design is evaluated either by comparison with past experience or by testing.

Simplified Dimensioning Process
Besides the detailed dimensioning method discussed above, a simplified method was proposed with the basic intent to:
• provide useful orientation at the project’s start and identify a range of preliminary solutions;
• analyze outage performance and the adequacy of insulation solutions on existing systems.
It is important to stress that this simplified method has limitations that can result in either over or under-dimensioned insulation and is therefore not considered accurate enough for the final design process. On the other hand, it does provide insight into the various parameters that must be taken into account when dimensioning insulators for HVDC with respect to pollution.
The first part deals with determining site pollution severity, which is the equivalent value of ESDD at a 0.1 mg/cm2 reference value of NSDD. The second step is to adjust this value individually for each type of insulator being considered so that the required USCD can be determined.

Determining Site DC Severity
An overview of the process to determine DC severity is presented in Fig. 4. The aim of such a site assessment is to obtain an accurate picture of contamination severity of the area concerned based on data collected over a relatively long period. Initial assessment is usually based on:
1. Collected performance data on existing lines or substations, preferably DC energized, although AC data could also be useful;
2. Identification of type (i.e. A or B, as defined in IEC 60815-1), and composition of pollutants (i.e. type of salts, non-soluble deposits etc.);
3. Measurement of quantity of pollution present;
4. Characterization of climate, specifically if there is a prolonged dry season;
5. Assessment of geographic, topological and geological features to identify possible contamination sources, and;
6. Survey of present and foreseeable future pollution sources and land use.
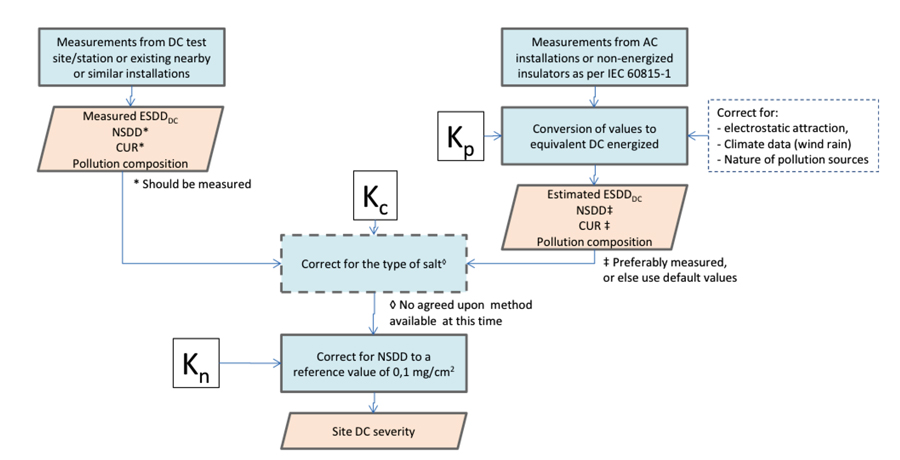
For critical installations such as converter stations, the above information might not prove accurate enough and therefore there is a need for a more detailed assessment. Ideally, this includes setting up experimental stations at representative locations equipped with selected different DC energized insulators so as to obtain an estimate of long-term pollution accumulation. An alternative approach, but with increased uncertainty, is to base site severity assessment on measurements taken on AC energized or non-energized insulators. In such a case, it becomes necessary to estimate the contribution of electrostatic field on pollution accumulation on energized DC insulators. This is done with the DC/AC accumulation factor Kp (applicable to both ESDD and NSDD values). This factor can vary between 1 and 10 but, for the simplified dimensioning process, values between 1 and 3 are more typical.
Once site severity measurements become available, the maximum value of the average ESDDs measured on insulators is converted to an equivalent laboratory test severity. With this correction, it is recognized that artificial testing differs from natural pollution in a number of important aspects, namely:
• Type of salt
Laboratory testing is generally performed with marine salt (NaCl) whereas natural pollution layers often contain less soluble salts such as gypsum (CaSO4). There is still no widely applicable methodology to quantify this effect other than performing specific flashover testing on insulators with natural pollution, so assume Kc=1.
• Amount of non-soluble material present in pollution layer
The standardized laboratory test usually subjects an insulator to a pollution layer with a non-soluble deposit density (NSDD) of 0.1 mg/cm2. In service, NSDD levels typically vary from 0.01 to 10 mg/cm2. The measured ESDD is normalized to an NSDD value of 0.1 mg/cm2 with a factor, Kn. These corrections result in an estimate of equivalent site severity at an NSDD=0.1 mg/cm2, defined as the DC site severity.

Determining Required Creepage Distance
Required insulator dimensions (notably creepage distance) are determined from available service experience or test results. If such data is not available, representative tests can be performed on candidate insulator types to determine their statistical flashover properties. The term ‘representative test’ is understood to mean any laboratory test designed to duplicate natural contamination conditions as closely as possible in terms of 1. pollution severity (i.e. ESDD and NSDD), 2. its composition (i.e. type of salt as well as non-soluble components), 3. uniformity of deposit and 4. type of wetting conditions. Alternatively, standard laboratory pollution test results can also be utilized but a number of adjustments to the DC severity then become necessary. These adjustments depend on specific insulator type and are therefore done separately for each different insulator that will be utilized (see Fig. 5).
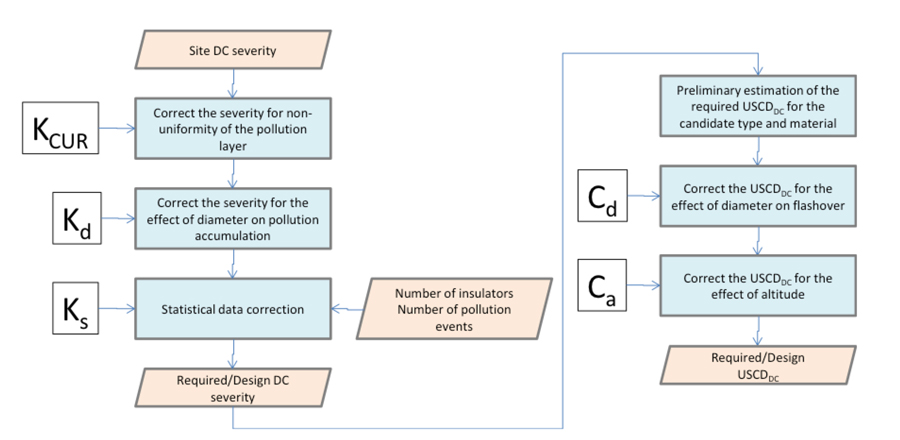
Briefly the adjustments can be described as follows:
• Non-uniformity of contamination layer
The flashover voltage of non-uniformly polluted insulators can be significantly higher than for uniformly polluted ones. This effect is corrected for with a factor Kcur.
• Insulator diameter
Larger diameter insulators collect less contamination than small diameter ones. This effect is corrected for with a factor Kd.
• Statistical considerations
This correction factor, Ks, is chosen to obtain a sufficiently low risk of flashover.
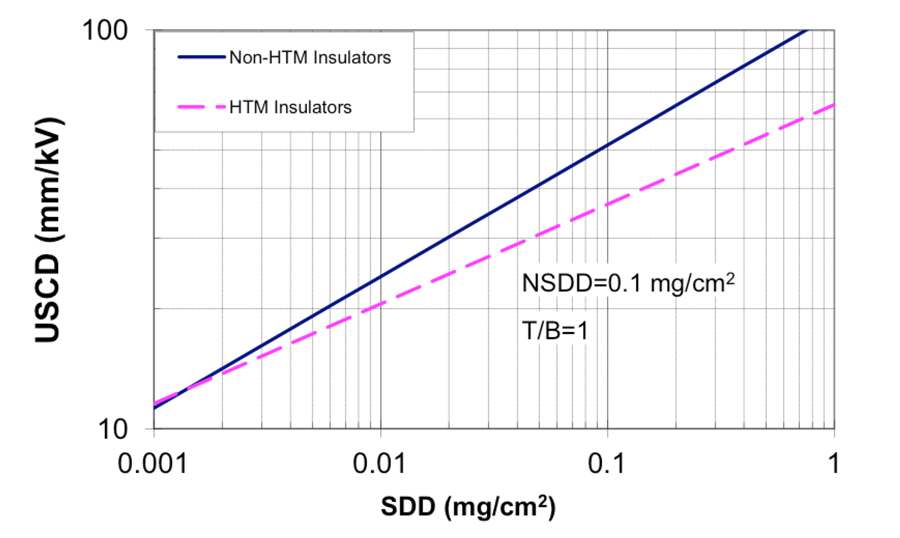
Application of these various correction factors results in a design DC severity that corresponds to the pollution severity at which representative laboratory tests can then be performed. At this stage, it is also possible to make a first estimate of leakage distance (unified specific creepage distance: USCD) required for the project, based on the graphs in Fig. 6. Two graphs are shown, one for hydrophobicity transfer materials (HTM) such as silicone rubber and the other for non-HTM insulators such as glass or porcelain.
These graphs are valid for line as well as substation insulators having relatively small diameter. Insulators with larger diameters generally have a lower flashover voltage than those with smaller diameters and therefore require longer leakage distances. This effect is corrected for with factor Cd. At time of writing, it was not deemed necessary to correct for the effect of diameter when it comes to hydrophobic insulators.
For installations at high altitude an additional correction factor can be considered to adjust leakage distance for the lower flashover voltage under low air density conditions. This is corrected for by a factor, Ca.

Verification
As confirmation of the applicability of the simplified method, actual outage performances were analyzed for various installations against the design curves presented. This proved difficult since detailed information on outage performance and corresponding pollution severities for HVDC systems in service are not generally published. Still, some useful information was found and results of this analysis are presented separately for substations (Fig. 7), lines (Fig. 8) and HTM insulators (Fig. 9). In these graphs a distinction is made as follows:
• Design Values
These data points represent minimum creepage distance values implemented on actual HVDC systems but for which performance data is not yet available.
• Good Performance
Indicates minimum creepage distance values implemented on actual HVDC systems for which positive service experience has been reported.
• Flashovers
Indicates minimum creepage distance values implemented on actual HVDC systems for which negative service experience has been reported.
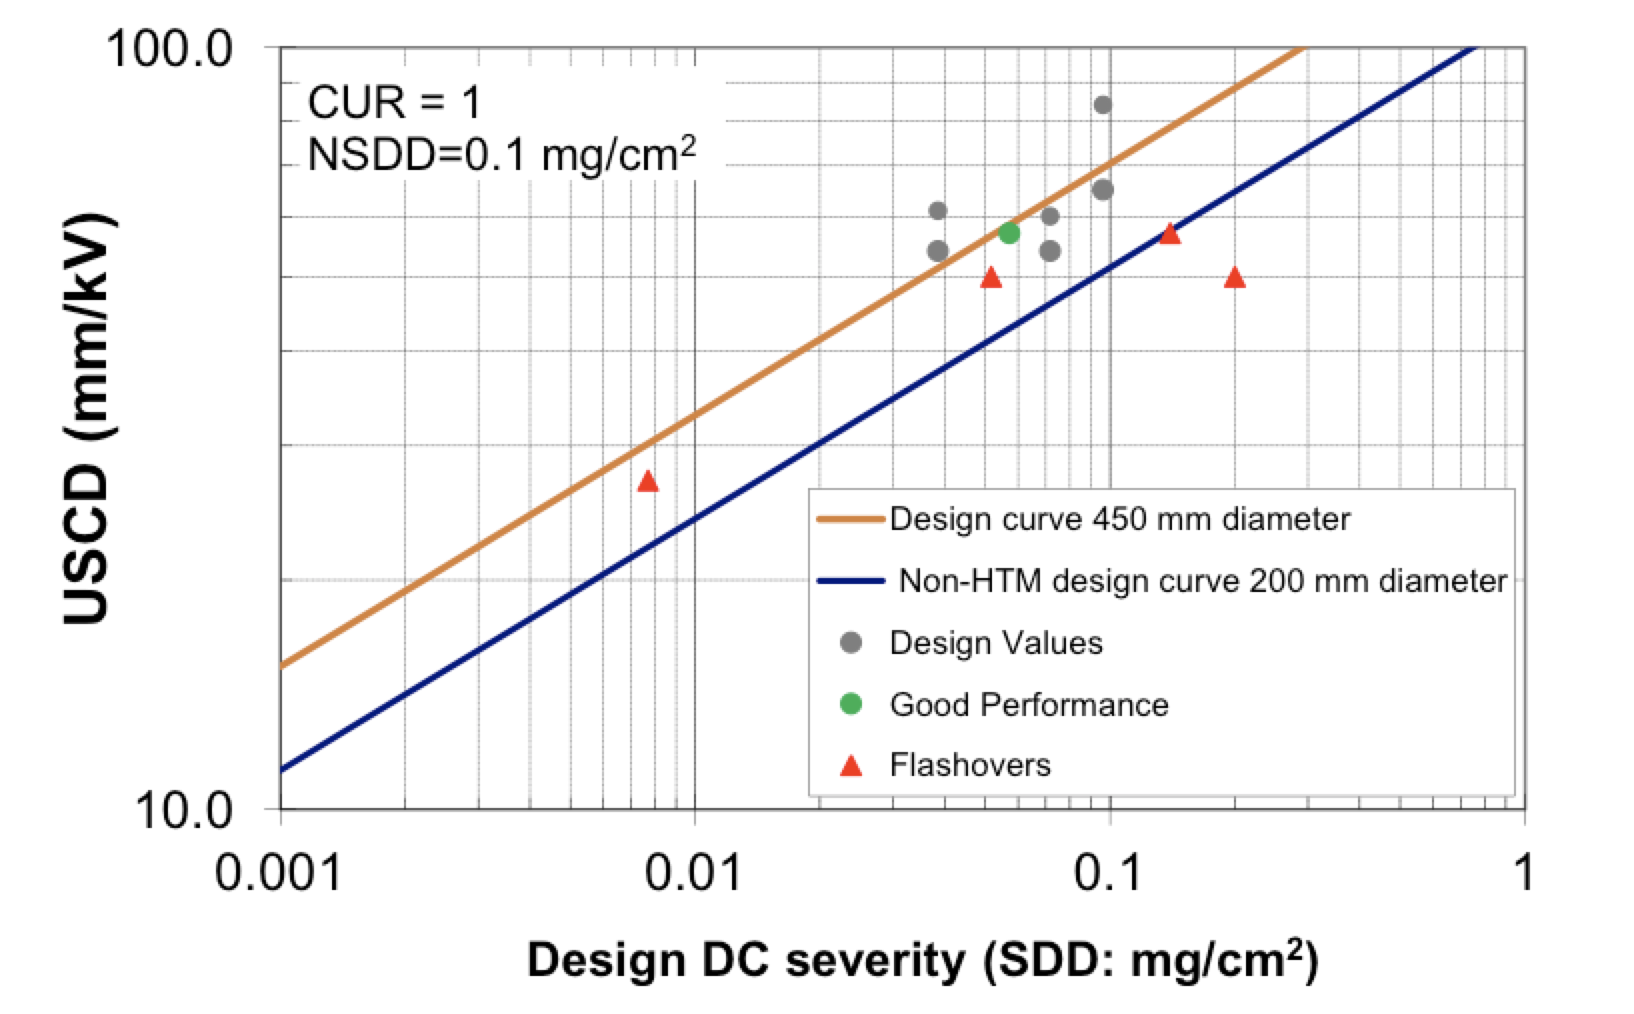
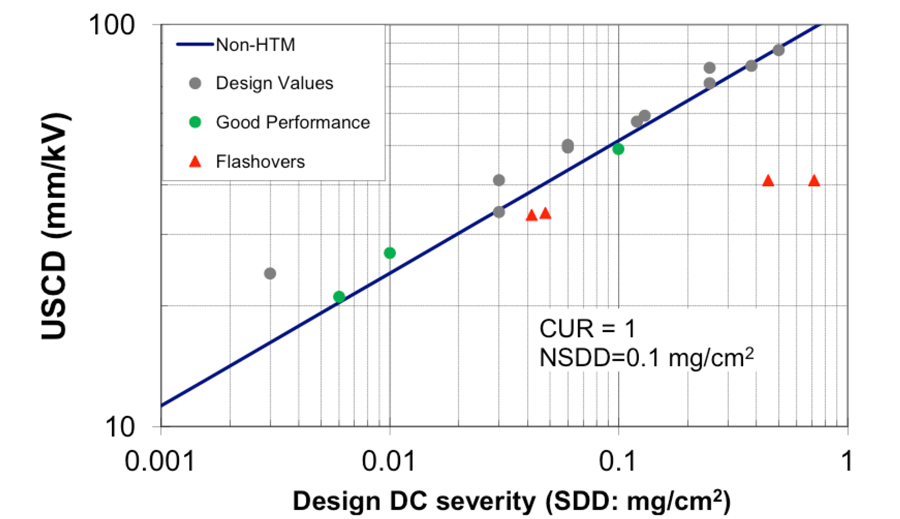
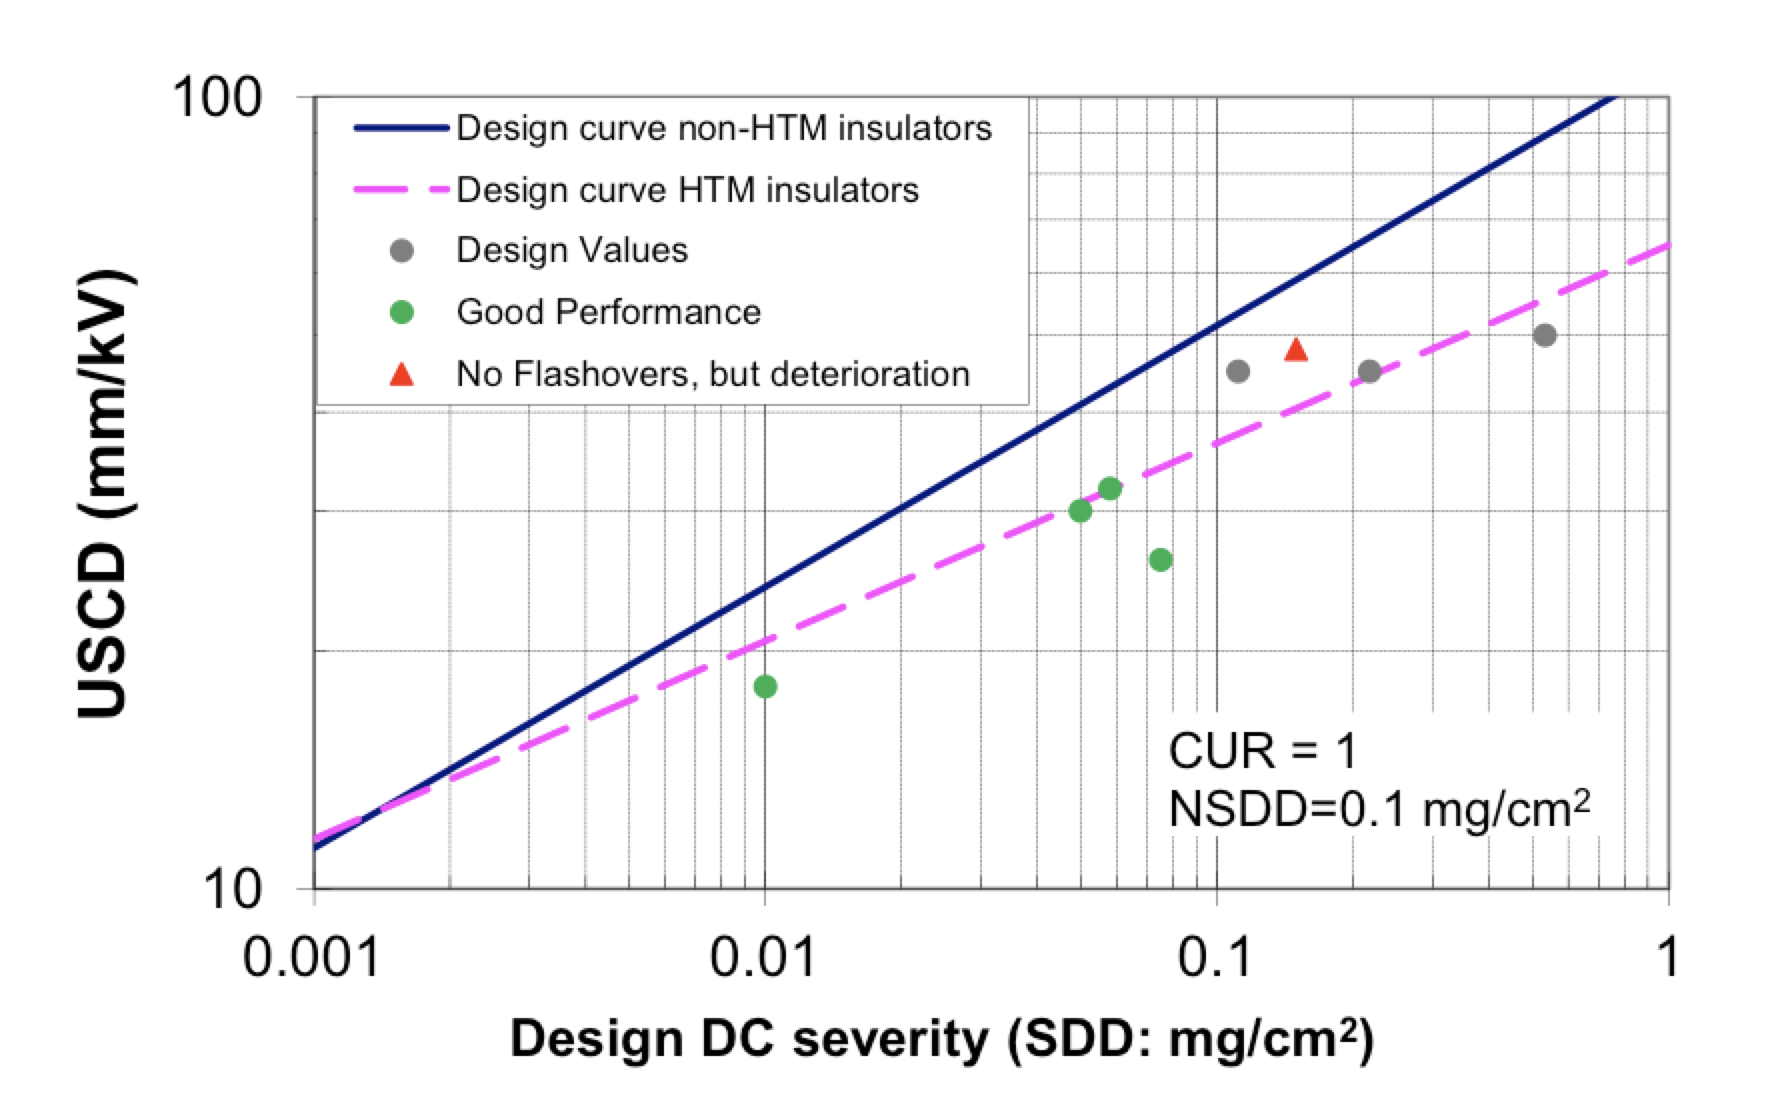
Data in these figures basically confirms the appropriateness of the simplified method recommended for obtaining a realistic first estimate of the insulation dimensions required at HVDC installations.
[inline_ad_block]