Thermal imaging has long served as a practical and cost-effective means to assess the condition of a surge arrester. But less effort has been devoted to determining what constitutes a ‘healthy’ versus a ‘suspect’ surface temperature profile.
This edited past contribution to INMR by Jonathan Woodworth of ArresterWorks reviewed the variables that can affect surface temperature as well as their relationship to watts loss.
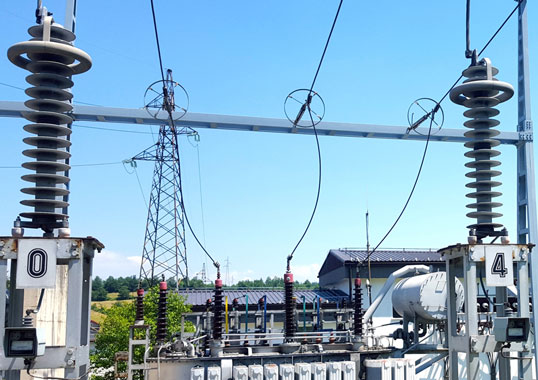
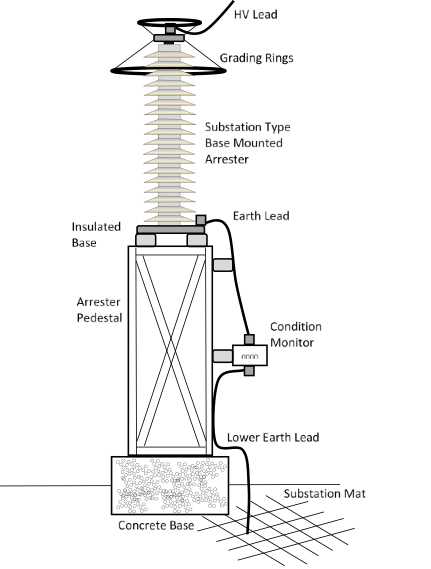
Monitoring the health of MOV arresters over the past decades has been dominated by measurement of third harmonic currents (better known as leakage current) at the base of the arrester. This method, however, is complicated by the fact that the arrester needs to be isolated from earth to obtain accurate data. It becomes further complicated by the effects of internal and external currents. While this way of condition monitoring works well for arrester installations that have previously employed surge counters and where the arrester is already isolated from earth, it cannot easily be utilized for arresters that are solidly earthed. Fig. 1 shows such a set-up.
In many installations, isolating the arrester base is not a practical option to allow condition monitoring. Therefore, in place of leakage current, infrared scanning (IR) has become the method of choice. This entails taking thermal images of arresters and then doing a comparison with similar units in service at the same location. Yet in spite of its popularity, there is little guidance from suppliers or others on what temperatures can be classified as within the safe operating range and what temperatures are an indication that an arrester is starting to experience problems. A general ‘rule of thumb’ that states that a 5°C differential between partner arresters warrants concern while 10°C is even more serious. Typically, temperature differentials of greater than 10°C are not reported and this is probably because once arresters reach this stage, they are close to failure or will have have failed and been removed from the system before the next thermal scanning cycle is completed.
Even though IR scans are the best monitoring method presently available, the method has a shortcoming in that they are usually performed on only a limited basis. This is largely due to the fact that it requires someone to walk each substation to acquire the thermal images of each arrester. Ideally, if arrester temperature could be monitored continually, a good prediction of health at any time could be compiled. To that end, an experiment utilizing a wireless temperature sensor on arresters was recently initiated to continuously monitor surface temperature. The goal was to better understand arrester surface temperature given the many variables involved, e.g. time of day, latitude, wind, sun, surface area, rain, cardinal direction of sun, distance from transformers, height, material and design. All these factors will affect surface temperature. A secondary goal was to determine sensitivity of surface temperature to watts loss for the arrester.
Environmental Effect on Surface Temperature (Experimental Analysis)
An arrester was set-up to continuously monitor surface temperature in order to determine how this variable cycles based solely on the environment and without any effect from internal power dissipation.
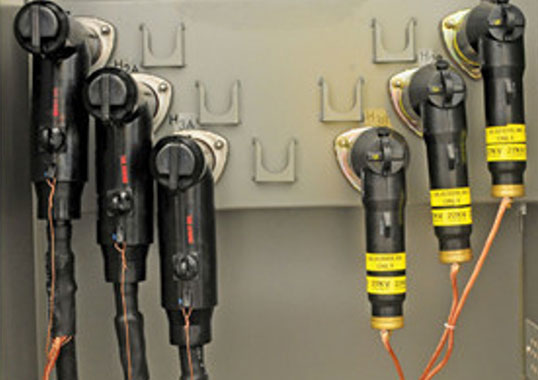
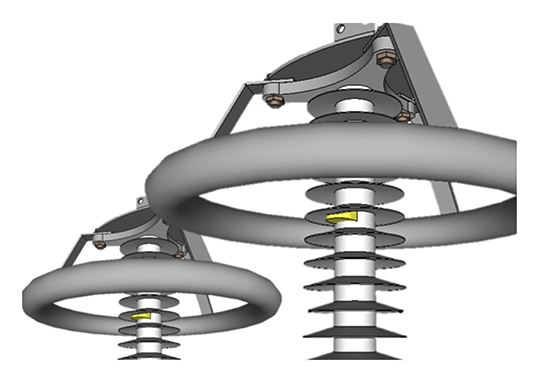
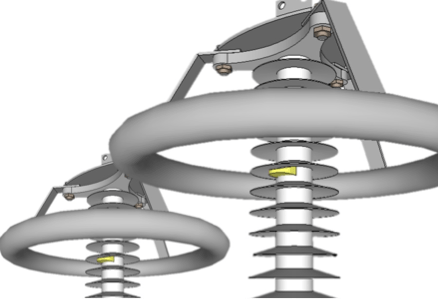
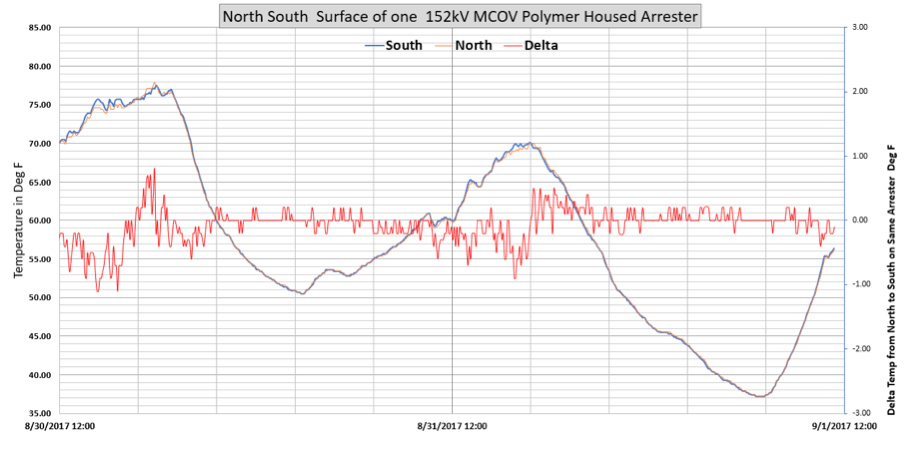
A wireless sensor was mounted on two arresters, side-by-side, as shown in Fig. 2. The sensor was on the west side of the arrester and data collection began during the summer of 2017 in the U.S. north-east. Temperature was recorded every 6 minutes and immediately transmitted to a cloud database where it was stored for analysis. Fig. 3 shows a typical daily cycle of arrester surface temperature of two 152 kV MCOV unenergized polymer-housed station class arresters.
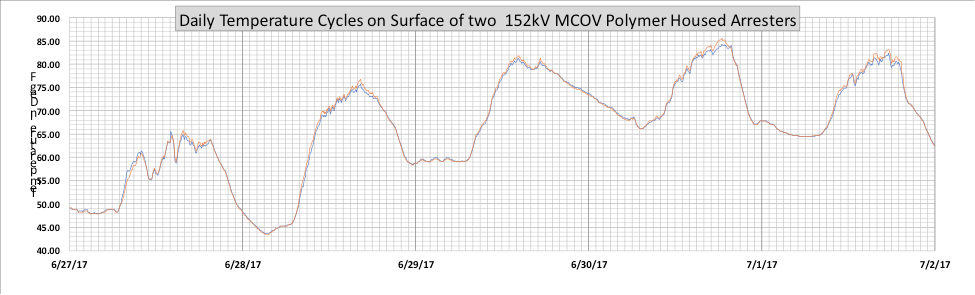
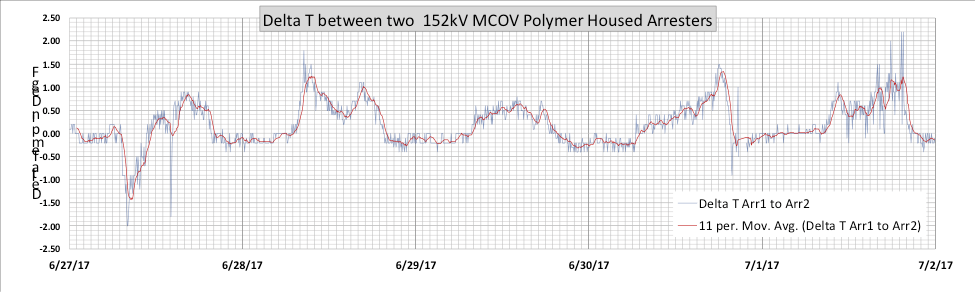
As can be seen, there is considerable change in surface temperature throughout the 24-hour period. This large swing, due solely to the environment, makes assessing condition of the arrester difficult if only looking at surface temperature. If however the temperature of two arresters is compared, as in Fig. 4, small changes in the difference in arrester temperatures can be discerned. As shown, there are temperature differences of 1-2°F during the day but differences are almost negligible during the evening.

Environmental Effects on Surface Temperature
1. Time of Day
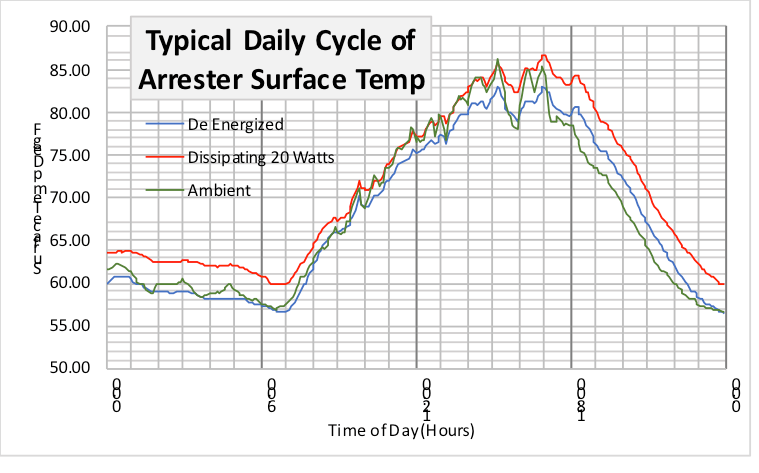
Time of day has perhaps the greatest impact on arrester surface temperature. Temperatures will nearly always rise during the day and drop at night. As shown in Fig. 5, ambient temperature changes from 56°F to 85°F over the course of a day and both the energized equivalent (from the electrical loss experiment) and de-energized arresters follow within a few degrees of ambient.
2. Location on Arrester
Several location variables can affect surface temperature of an arrester and must be taken into account when comparing thermal scans of partner arresters. For example, a sensor location vertically on an arrester can generate a difference of several degrees. Additionally, vertical locations can be significantly different if the sensor is on a different unit of the same multi-column arrester. Sensors must therefore be placed at the same location on each partner arrester used for comparison.
3. Cardinal Direction of Sun
It would seem likely that the side of the arrester facing the south would have a hotter average temperature. However, a quick test on the 152 kV arresters used in this assessment showed little difference between north to south. It is assumed that is because sheds shaded the arrester side such that sensors do not experience the true impact of the sun. See Fig. 6 for temperatures over two days.
4. Weather
It was observed that rain causes a rapid drop in arrester surface temperature. Rain also reduces thermal noise caused by the sun. Snow may also have some impact on surface temperature but, at time of writing, this was still under investigation.

Experiment on Effects of Electrical Losses
To better understand the impact of arrester losses on surface temperature, a simple experiment was conducted on a set of de-energized arresters. One arrester was mounted outdoors without connection to power. Directly next to this unit, a second arrester was mounted also with no applied voltage but with a heater installed under the housing and along the disk surface. This role of this heater was to simulate losses of an energized arrester but without actual energization. The heater was placed along the entire length of the arrester on the opposite side from the sensor and was adjusted to various levels for several days at a time. External temperatures were then monitored. Fig. 5 shows the temperature difference between the ‘simulated loss’ arrester with heater set at 20 watts and the de-energized arrester.
Steady State Losses
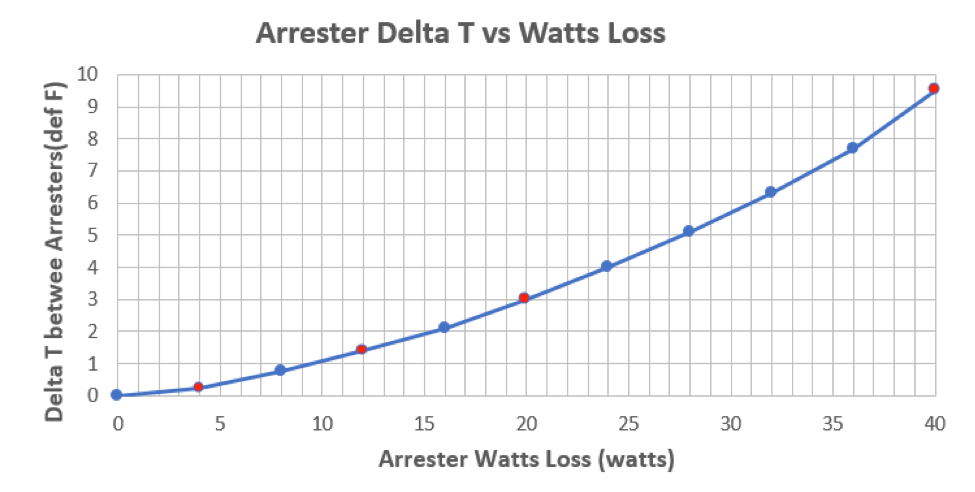
Station class arresters applied to systems below 245 kV will typically dissipate 0.2 to 0.3 watts per kV of MCOV. As such, in the case of a 152 kV MCOV arrester, the steady state loss would be between 30 and 40 watts. It has also long been thought that, for most arresters, steady state losses do not result in any temperature rise. This study, however, determined that as little as 8 watts of losses on a 152 kV MCOV polymer-housed station class arrester caused a detectable rise in surface temperature. Fig. 7 shows the relationship between delta T of the arrester surface and internal watts loss found in this study. This relationship, of course, is only for this specific arrester and would be different for other housing materials and shed configurations.
If an arrester is operating near its MCOV, it will likely maintain a temperature a few degrees above ambient. If surface temperature is to be used to monitor the health of an arrester, comparison with the temperature of a nearby arrester will give the optimal appraisal, provided the comparison is from the same basic location along the two arresters. Comparison of arrester temperature to ambient may also work if normal losses are low.
Variables Affecting Surface Temperature Changes Due to Electrical Losses
1. Surface Area
The surface area of the arrester tested during this study was 436 in2 and the housing material was an EP rubber. The sheds were considered to be insulators and their surface area was not included. If surface area was higher, the Delta T necessary to shed a watt would be less. In this case, the dissipated watts per sq. inch was 40/400 = .01 watts and a 10°F differential was required to accomplish this.
2. Housing Material
Since all materials have an emissivity constant, the level of heat that can be transferred to surrounding air will be different. Even color of material will affect this. For example, grey porcelain has an emissivity of 0.92 while grey polymer is between 0.95 and 0.97. This means that polymer rubber emits thermal energy more efficiently than glazed porcelain which in turn implies that, for the same watts-loss, a porcelain arrester will theoretically rise to a higher temperature than a polymer-housed arrester.
3. Design
If an arrester is designed with an internal air space axially along the disks, the air acts as an insulator and this insulation layer will cause disks to run hotter than the outside surface. This fact reduces the speed at which outside temperature will change and, in effect, reduces the value of an external sensor. Fortunately, long-term temperature rise exhibited by arresters does not require rapid temperature change to detect an issue.

Analysis of Surface Temperature Change Due to Switching Surge Activity
Continuous monitoring of surface temperature of an arrester allows for the possibility of sensing a switching surge. If an arrester were to experience a transient that was close to its maximum rated withstand capability, it would instantaneously raise the temperature by 80 to 90°F. This would also raise surface temperature almost instantaneously and to the same extent. Given the sensitivity of arrester surface temperature as shown in the test series above, such increase in temperature would easily be detected. However, this type of energy injection only occurs on arresters applied on at least 345 to 400 kV systems. In the case of lower voltage systems, the level of energy injected from a switching surge is far lower and would increase the temperature of a station class arrester by at most 4 to 5°F. This could be difficult to discern from ambient noise. Therefore, detecting a switching surge on systems below 345 kV would be a challenge.
Analysis of Surface Temperature Change Due to TOV Events
Whenever there is a line-to-ground fault on a grounded 3 phase system, there will be a voltage rise on one of the unfaulted phases. The arresters on this unfaulted phase will immediately transition into an overvoltage event at some level. In order to attain good transient system protection, the lowest possible MCOV arrester is used. This optimized MCOV rating usually means that during the TOV event the arrester is pushed into the early stage of failure mode if the surge is not interrupted by breakers whose role is to terminate the overvoltage event. During this time, the arresters will heat internally and this will quickly be sensed on the arrester’s external surface.
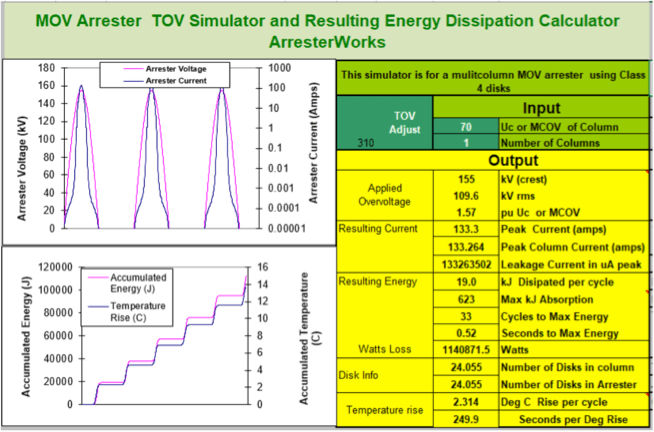
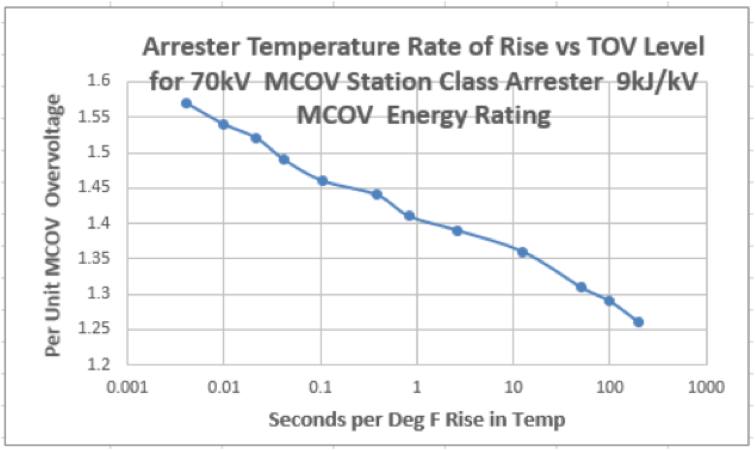
If the TOV event is severe enough to jeopardize the long-term health of the arrester, its temperature will have reached a fairly high level – perhaps even as high as 50 to 100°F above ambient. Temperature rise of an arrester can be calculated using a TOV Simulator (see Fig. 8) which calculates rate of rise of a 70 kV MCOV arrester for various overvoltage levels. Results shown in Fig. 9 indicate that, for higher TOV events, rate of temperature rise is significant and that final arrester temperature would likely be sensed on its external surface. Investigation in a test laboratory could be performed to verify this.
Several conclusions that can drawn from this experiment:
1. Comparison to a partner arrester is recommended to accurately measure health of an arrester using surface temperature;
2. To improve accuracy of such evaluation of arresters, temperature readings should ideally be made between midnight and sunrise;
3. Outside temperature of an arrester is sensitive enough to detect a difference of as little as 8 watts, which represents only a small change in leakage current;
4. Switching surges on systems above 345 kV will be detectable based on arrester surface temperatures;
5. TOV events will probably also be detectable on an arrester based on rapid temperature rise (i.e. few seconds) with long cool-down (i.e. minutes to hours).

[inline_ad_block]