A decade ago, the definition of arrester residual voltage and how it is measured changed in both IEEE and IEC standards. This past contribution to INMR by expert, Jonathan Woodworth, explained and reviewed the rationale behind these changes.
After an arrester’s AC rated voltage, its residual voltage (also know as discharge voltage) is the most important characteristic. The terms ‘discharge voltage’ and ‘residual voltage’ however do not always effectively describe the characteristic and a preferable one is probably ‘clamping voltage’. This terminology explains the essence of the characteristic ‘clamps the voltage’.
When a surge of any type travels along a conductor and reaches the arrester, the arrester changes its impedance, conducting the surge to ground and effectively clamping the peak voltage of the surge to lower levels according to its residual voltage characteristic curve. In other words, the clamping voltage is the peak voltage across the terminals of an arrester at any peak current in the range a few hundred to thousands of amps. Since the clamping voltage is an ever-changing function of the current passing through the arrester, it must be described as a Table or curve.
In 2010/2011, Maintenance Group 4 of IEC TC37 and Working Group 3.3.11 of IEEE SPD reviewed every test performed on arresters as part of a rationalization process and concluded that method of measuring and reporting residual voltage of an arrester was different between the two standards. In some cases, the characteristics reported were even misleading.
Arrester clamping voltage is measured (as per the standards) using three different types of surges with quite different rise times relative to the power system in which they operate. The slowest of these surges is similar to that generated by switching, as is very common in most transmission systems, and where rise time to crest is about 50-100 µs. By contrast, the current rise time to crest of a surge generated by a direct lightning strike is only about 8-10 µs. The fastest surge to which arresters can be subjected results from insulator ‘back flashovers’, which can have current rise times to crest of as little as 1 µs.
Now, as far as the two standards are concerned, measurement and method of reporting of the two slower surges (i.e. switching and lightning) are not changing. But the method of measuring and reporting results on arrester response to the very rapidly rising surge triggered by an insulator back flash will change in both.
When early MOV standards were developed by the IEEE, the ability of test labs to simulate the fast rising current surge typical of back flashover was limited. As a result, this characteristic was typically derived from results using slower surges with rise times to crest of 2, 4 and 8 µs. The clamping voltages from these surges were then used to extrapolate back to a voltage that would crest in only 0.5 µs. Over recent years, however, many test labs have developed reliable inductance-free generators that can produce a current surge cresting in 1 µs. In C62.11, not only was the process antiquated, but there was little guidance on how to account for the inductance of the discs and components in longer arresters.
Given these shortcomings, it has been agreed that the next edition of IEEE C62.11 should specify the test measurement methods, as done in IEC 60099-4. This new method, as far as the IEEE community is concerned, uses one simple 1 µs as the time to crest of the surge current to quantify the clamping voltage of the arrester. No interpolation from slower surges will be necessary – something that will doubtless be welcomed at test labs that routinely certify arresters to the IEEE standard.
Accounting for the arrester’s inductance and measuring circuit according to the IEC method is actually quite interesting. Since the inductance of the arrester only affects the results of the 1 µs test (and not the two slower surge tests), it’s only necessary this method be used for the fast rising surge.
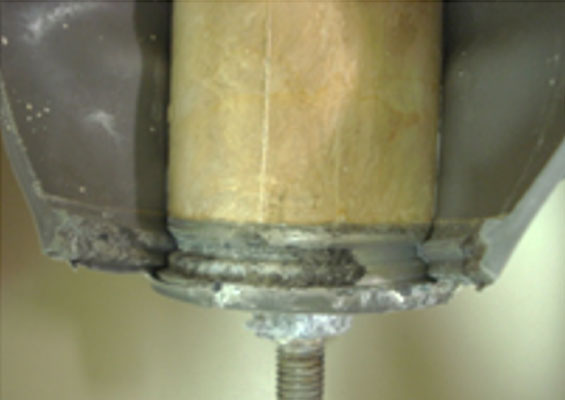
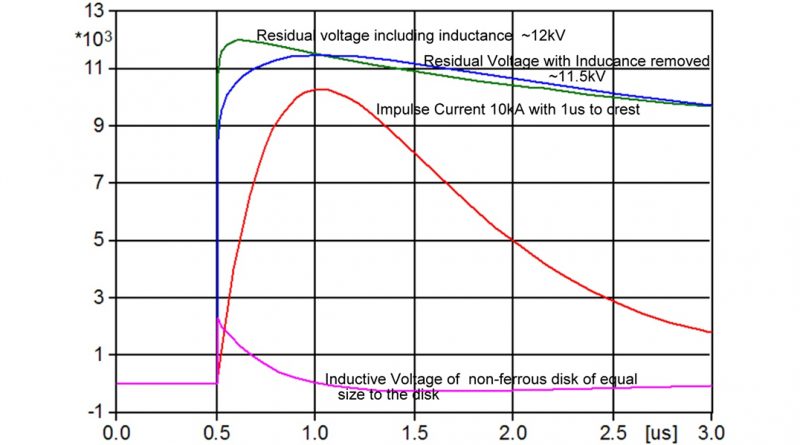
In short, the technique to account for any disc’s inductance is to impulse it with a fast rising current surge (i.e. red curve in Fig. 1) and digitally measure/store the clamping voltage (green curve).
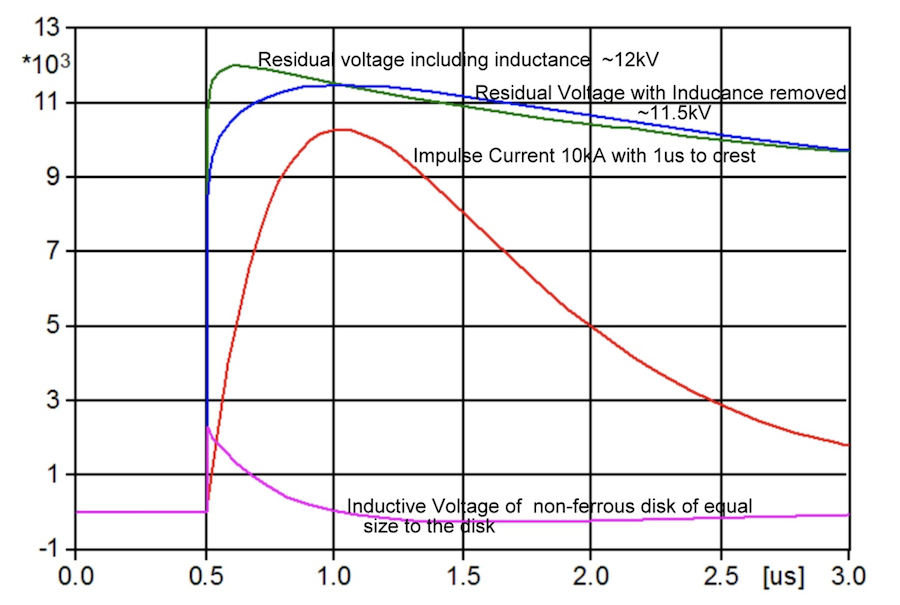
Then, a non-ferrous metallic disc of the same size is subjected to impulse and that data also stored (lowest curve). Removing the inductance effect of the disc is then simply a matter of subtracting the inductive voltage from the disc clamping voltage (shown as the blue curve). This curve represents inductance-free clamping voltage of the MOV disc.
The clamping voltage of a complete arrester is the sum of the all the disc clamping voltages plus the inductive voltage as calculated using (L) as 1 µh/meter of length in the following equation:
Arrester’s Inductive Voltage = L x arrester length x di/dt
As per IEC60099-4, the inductance free value should be the value printed in any supplier’s literature while there is no need to show the value including inductance. During a past meeting of IEC TC 37 MT4, it was decided that both values should be published to better allow users to compare arresters of similar voltage ratings but with different lengths. Finally, there was a consistent published value of clamping voltage for fast rising surges worldwide as well as a simpler test methodology in the IEEE standard.
[inline_ad_block]