Optimizing the capacity of power lines is crucial for maintaining grid stability and reliability. Factors such as ageing infrastructure, population growth, rapid technological advancements, and climate change have all heightened demand for improved grid flexibility and investment.
In this context, Dynamic Line Rating (DLR) has emerged as an applicable solution to optimize power line ampacities and facilitate the integration of renewable energy sources amid the ongoing energy transition. DLR provides a cost-effective and efficient method for enhancing the performance of existing overhead power lines.
This edited past contribution to INMR by Nurul Husniyah Abas, Mohd Zainal Abidin Ab Kadir, Norhafiz Azis and Jasronita Jasni of the Advanced Lightning, Power and Energy Research Centre at the Universiti Putra Malaysia, presents an analysis of DLR, examining its effectiveness from theoretical and practical perspectives.
The primary focus is validating the theoretical framework accredited by the Institute of Electrical and Electronics Engineering (IEEE) and the Council on Large Electric Systems (CIGRE) for DLR application. Findings reveal the presence of available line ampacities within the conductor, indicating that the transmission line can be further optimized through DLR.
Electrical power grids serve as vital components within modern society, facilitating the delivery of electricity from one location to another, enabling modern society to function. These grids are categorized into three types, depending on the distances and voltages they handle, typically ranging from 33 kV to 500 kV. However, power utilities are growing concerned regarding the necessity to enhance the transmission lines’ capacity without resorting to new constructions or structural alterations. The ageing infrastructure of these power grids significantly influences this concern. Many power lines have surpassed their intended lifespans, leading to an elevated risk of power outages due to equipment failures. Moreover, the current infrastructure may need to be revised to support the demands of revolutionary technological advancements and the increasing population.
While integrating transformative technologies such as renewable energy resources, energy storage, and electrification promises to bolster power system resilience, it also presents challenges. These include dealing with the intermittency of renewable technologies and the vulnerability to extreme weather events, necessitating a comprehensive assessment of grid modernization and resilience investments. With the additional pressure of population growth and rising energy load, managing the existing grid becomes increasingly complex. This results in constrained transmission lines, subsequently affecting the energy market higher from the cheapest grounds.
Moreover, environmental factors like climate change, natural disasters, and pandemics highlight the urgency to optimize power grids. Existing transmission lines were not originally designed to withstand such challenges. Additionally, unpredictable weather phenomena, like severe heat waves, can cause significant damage to power system infrastructure and disrupt its stability.
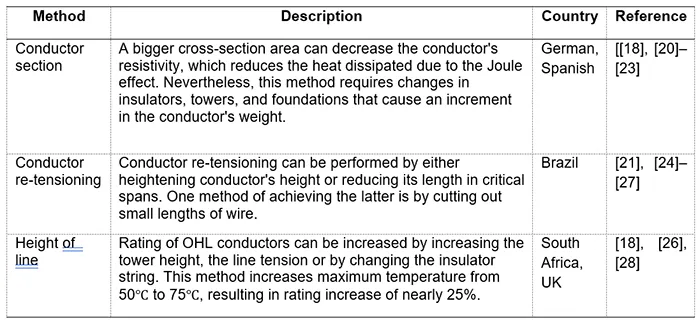
In grid optimization, two viable approaches may be considered: elevating the voltage or optimizing the ampacity. Elevating voltage provides the most significant rating boost, decreasing transmitting current at the same power and expanding the margin of ampacity limits. However, this approach has high investment costs and introduces corona effects and elevated electric fields. Therefore, this approach is only considered when the rating increase justifies the high investment costs, as seen in countries like the United States and Germany. The alternative option involves augmenting ampacity, which can be achieved through various methods, as detailed in Table 1. However, these approaches require physical alterations of the transmission lines.
Amidst this challenge, DLR is an appropriate option. DLR is a system that involves monitoring and modifying the rating of the OHLs based on real-time weather conditions and other factors. The conductor’s line rating is influenced by several factors, which can be further divided into two categories: atmospheric conditions and conductor conditions. These variables affect the conductor temperature, which can cause line elongation and sagging. Atmospheric conditions (wind velocity, wind direction, solar radiation and amount temperature) strongly influence conductor line rating. In contrast, the conductor conditions, such as the line current, sag, tension and surface properties (emissivity and absorptivity), also affect the conductor’s line rating.
Traditionally, the power sector calculates a conductor’s line rating based on worst-case weather conditions. It is known as static line rating (SLR). However, assuming that the actual rating is always more prominent than the SLR is wrong. According to studies by the power industry, many power lines may safely operate at 130% of their static-rated capacity for 90% of the year. SLR causes transmission lines to underutilize by restricting their full potential, raising operation costs. While these assumptions are conservative, there are cases where the real-time ratings are less than SLR, exposing conductors to the potential for thermal damage or an increase in the conductor’s sagging. This situation may be catastrophic to the power system, resulting in blackouts due to over-congestion.
Thus, the DLR concept has emerged as a critical solution to address these limitations. DLR facilitates the energy transition by optimizing line ampacities and integrating renewable energy sources. By accurately assessing the current thermal limits of overhead line conductors, DLR empowers grid operators to safely and effectively increase load transfer capacity. This capability is critical in accommodating the intermittent pattern of renewable energy sources like solar and wind power. Moreover, DLR can also help alleviate congestion issues in the transmission network in Malaysia, where power generation plants are concentrated and far from the main load centres.
This discussion below aims to comprehensively analyse the heat balance theories proposed by IEEE and CIGRE in optimizing line ampacity, specifically focusing on Malaysia’s unique weather conditions. The primary objective is to highlight the available margin of the 275 kV transmission line after employing the dynamic line rating (DLR) approach. By examining the available capacity and conducting a comparative analysis, this research provides valuable insights into the potential benefits of implementing DLR for optimizing line ampacities in Malaysia for efficient and reliable asset utilization.

Methodology
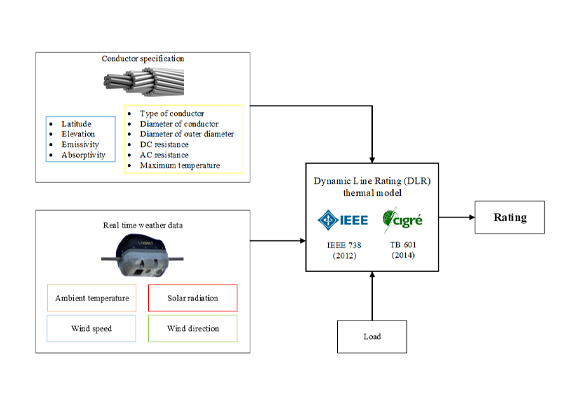
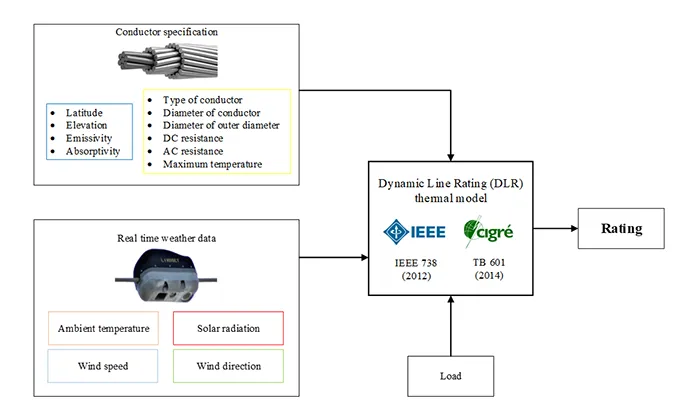
Many versions of the standards are accessible to determine the line rating of the conductor. Therefore, it is essential to clearly understand each standard’s differences and limitations before choosing the most suitable one based on the available parameters. The IEEE 738 and CIGRE TB 601 methods share a common foundation: calculating the conductor’s ampacity for steady-state and dynamic conditions using the thermal balance theory. Equation (1) and Equation (2) represent the respective thermal balance equations stated in the IEEE and CIGRE standards. Both standards consider weather parameters such as wind speed, direction, ambient temperature, and solar radiation. However, they use different approaches to calculate the rating, particularly regarding solar heat gain and convective cooling.
qC+ qr=qs+ qj (1)
Pc+Pr+Pw=Ps+PJ+PM+Pi (2)
As depicted above, the IEEE standard considers magnetic heating, corona heating, and evaporative cooling negligible factors in the line rating calculation, as their influence is minimal. Regarding the CIGRE standard, the heat balance equations include corona heating and evaporative heating but are still excluded from the line rating calculation. Previous studies have indicated that both approaches yield similar results, with percentage differences ranging from 5% to 15%. Another comparison, the IEEE standard offers a more straightforward and accessible way to calculate the line ampacity compared to the CIGRE standard.
For instance, the CIGRE standard considers the conductor’s surface temperature, whereas the IEEE standard considers the temperature constant along the length of the conductor radius. The CIGRE standard offers more details parameters, especially the conductor’s specification. Therefore, the maximum allowable current (Imax) for a conductor at its temperature limit (TCmax) can be calculated using equation (3) for IEEE and equation (4) for CIGRE standards.
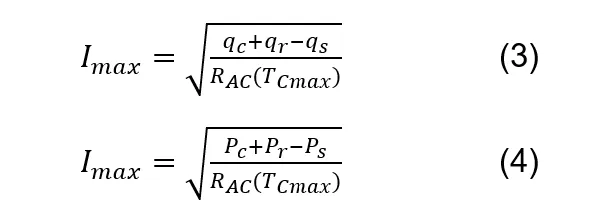
Fig. 1 illustrates the calculation methodology of the IEEE and CIGRE standards, visually representing the process. The following subsections will provide a comprehensive explanation and comparison of the computation process for each term utilized in determining the line rating, as presented in equations (3) and (4).

Case Study
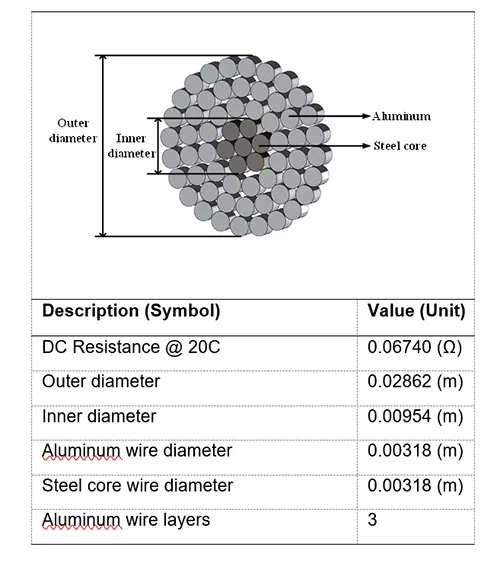
In order to study the available line capacity of conductor for grid optimization in Malaysia, a Zebra-type aluminum cable steel reinforced (ACSR) at 275 kV transmission line with a basic span of 365 meters was selected. The transmission line 3 phases, a 50 Hz double circuit with a height of 50 metres from the ground. The line direction is 3° to the North. The site for this case study is located at 275 kV PRMS-ATWR, where the critical line is detected. The specifications of the conductors used in this case study are described in Table 2.
The weather data was taken for the period of one year – January 2021 to January 2022. All the above data was analysed using MATLAB software to generate the simulated line ampacity of the conductor. The line ampacity was analysed using hourly resolutions. Three case studies were considered in the analysis and actual measured data for each case study was used. Four parameters were considered in each analysis, namely; ambient temperature, solar irradiance, wind speed, and wind direction.
The primary objective of the case study was to compare the outcomes derived from three different calculations: the IEEE calculation, the CIGRE calculation, and the calculated ampacity by the conductor sensor. All three case studies revolved around assessing the line capacity based on these different approaches. The differences between these approaches could be analysed and evaluated by comparing the results obtained from the IEEE calculation, CIGRE calculation, and calculated ampacity by the conductor sensor. This analysis aims to shed light on the respective strengths and limitations of each approach, providing valuable insights into the variations observed in the line capacity estimations obtained from the different calculation methods.
Result
IEEE 738 and CIGRE TB 601 are the two thermal methods used in this study for calculating the conductor’s ampacity and the calculations were carried out using MATLAB software. To ensure the DLR calculations accuracy, a comparison was made with the results and load current measurements obtained from the DLR sensors installed at site.
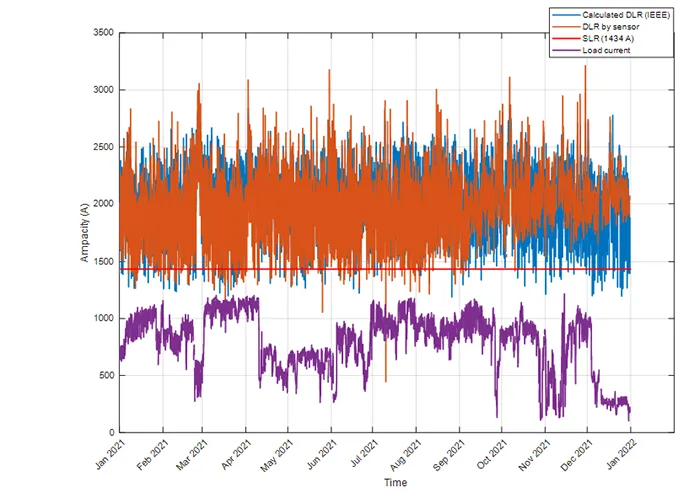
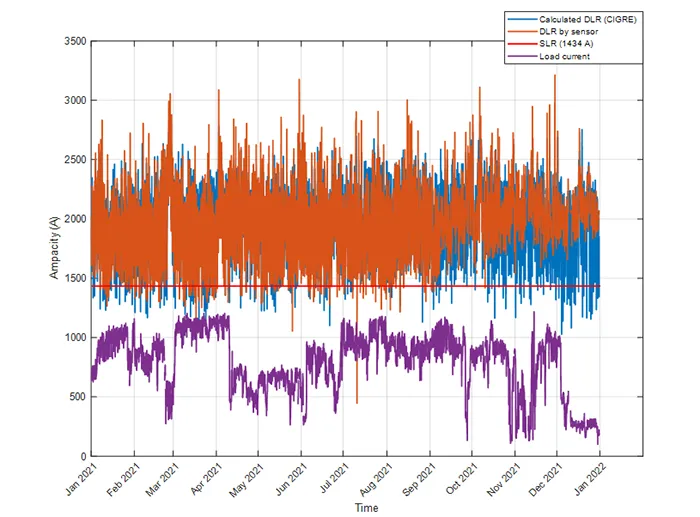
Throughout the measurement period from January 2021 to January 2022, the DLR values were analysed using the IEEE 738 and CIGRE TB 601 methods, as shown in Figs. 2 and 3. The DLR values displayed significant variability, indicating the dynamic nature of line capacity.
Upon observing Figs. 2 and 3 closely, it becomes clear that the load current (purple line) consistently stays below the SLR throughout the entire performance period. This phenomenon indicates a safe margin between the actual load and the line’s maximum capacity. However, there are specific months during the year when certain line segments (orange and blue lines) have a higher potential for congestion, as seen by the load current approaching the SLR. This situation highlights the importance of monitoring and managing line capacity during these periods to ensure reliable power transmission and become more crucial during the energy transition.
Moreover, while the computed DLR values generally surpass the SLR, there are instances where the computed DLR rating falls below the SLR. This observation implies that the conductor may reach its maximum temperature due to higher loads. By comparing the DLR, SLR, and load current, it becomes possible to assess the available capacity and identify potential congestion points.

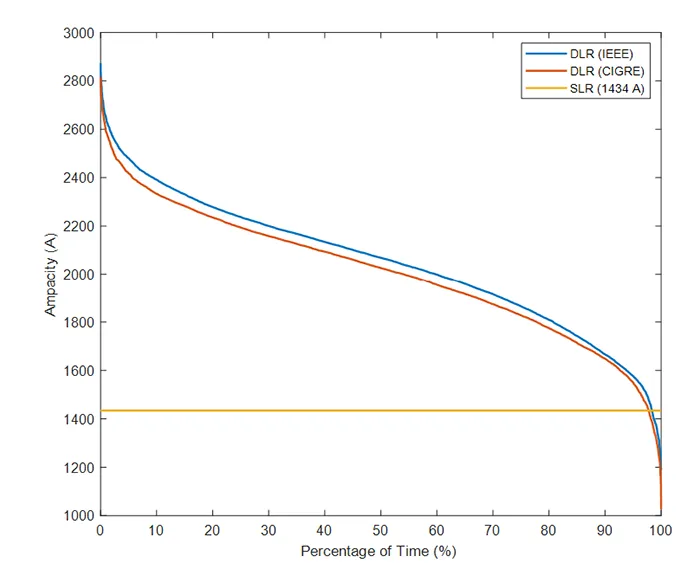
This study aimed to assess the increase in transmission capacity compared to the SLR using data obtained and analysed from the sensor. The findings reveal a substantial difference between the SLR and DLR capacity, as depicted in Fig. 4. Result clearly illustrates that the DLR system can augment transmission line capacity for over 90% of the operational time. This additional capacity can effectively accommodate integrating renewable energy sources into the existing grid without constructing new power lines, thus facilitating the energy transition. When considering rate calculations conducted at one-hour intervals, over 99% of the data points remained within the acceptable range. In terms of comparison, IEEE 738 (a) exhibited a larger margin for available capacity compared to CIGRE TB 601. However, the correspondence between the two methods was relatively strong, indicating that both approaches can be acceptable for the DLR algorithm.
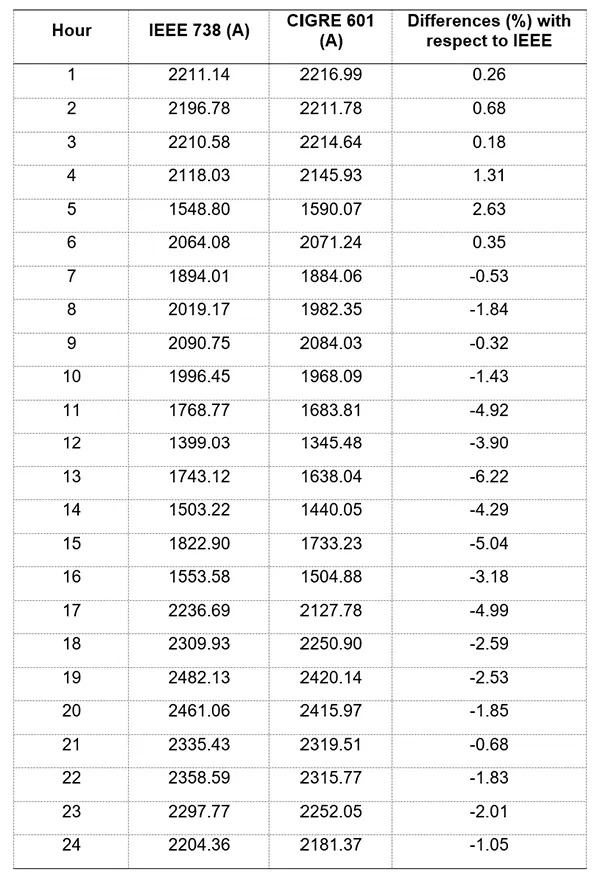

The percentage difference in DLR calculation between IEEE 738 and CIGRE TB 601 standards, focusing on the date of June 10th, 2021 reveals that the differences between the two standards are generally within an acceptable range, with variations of less than 10% observed.
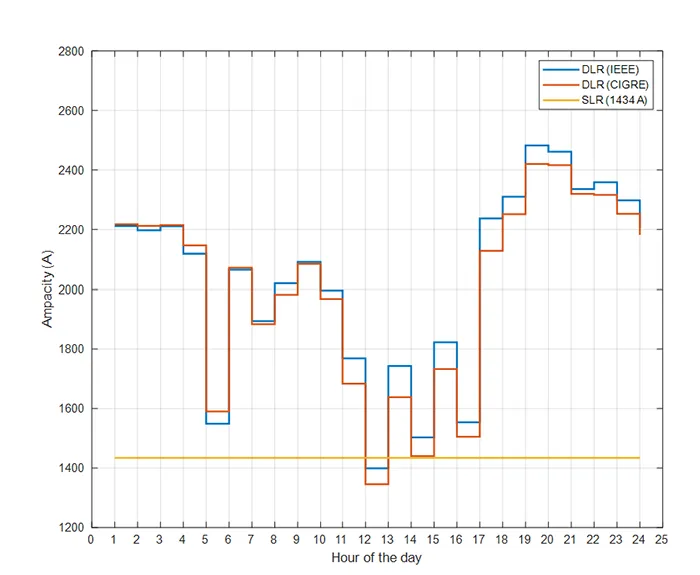
Table 3 presents the comparative analysis of DLR calculations, indicating that the variances between IEEE 738 and CIGRE TB 601 standards remain relatively small. This finding is further supported by Fig. 5, which illustrates a similar pattern of differences between the two standards. However, it is worth noting that a slightly higher divergence is observed during the time frame from 11 am to 5 pm, ranging between 4% and 6%, respectively.
The disparities during this period can be attributed to each standard’s distinct approaches used to calculate solar heating. For example, at 11 am, CIGRE TB 601 calculates the solar heating as 19 W/m, while IEEE 738 calculates it as 14 W/m. The discrepancies arise from the clearness factor, where CIGRE TB 601 accounts for a single value while IEEE 738 incorporates a clearness factor as outlined in the standard (Table 3). Additionally, CIGRE TB 601 considers the reflectance factor for the ground, which can impact the calculation of solar heating.
Despite these variations, it is important to emphasize that the overall differences between the two standards fall within an acceptable range when analysed hour by hour throughout the day. Calculated values of ampacity demonstrate similar trends and align well with each other. This result indicates that both standards provide reliable estimations of conductor ampacity, albeit with slight variations in certain hours due to differences in calculation methodologies.

Conclusions
Dynamic Line Rating (DLR) has emerged as an appropriate option for optimizing the grid without structural changes. Utilities can alleviate grid strain caused by rising demand and high electricity generation by evaluating and monitoring the weather conditions and conductor capacity.
The result affirms that the 275 kV transmission line can safely handle increased current ampacity without overheating, as determined by standard calculations and on-site data assessments.
References
[1] A. Brewer, ‘Dynamic Wind Load Modelling of High Overhead Transmission Line Towers’, p. 97, 2017.
[2] W. C. Khoo, J. Teh, and C. M. Lai, ‘Demand response and dynamic line ratings for optimum power network reliability and ageing’, IEEE Access, vol. 8, pp. 175319–175328, 2020, doi: 10.1109/ACCESS.2020.3026049.
[3] J. B. (Electric P. R. I. Paula Traynor, ‘Industry Challenges in Transmission Line Ratings’.
[4] M. El-Azab, W. A. Omran, S. F. Mekhamer, and H. E. A. Talaat, ‘Allocation of FACTS devices using a probabilistic multi-objective approach incorporating various sources of uncertainty and dynamic line rating’, IEEE Access, vol. 8, pp. 167647–167664, 2020, doi: 10.1109/ACCESS.2020.3023744.
[5] Y. Li et al., ‘Day-Ahead Scheduling of Power System Incorporating Network Topology Optimization and Dynamic Thermal Rating’, IEEE Access, vol. 7, pp. 35287–35301, 2019, doi: 10.1109/ACCESS.2019.2904877.
[6] Y. Yan, W. Zhang, H. Lin, Z. Li, and R. Tang, ‘Field validation of a weather-based dynamic rating system for transmission lines’, Proc. 2015 IEEE Innov. Smart Grid Technol. – Asia, ISGT ASIA 2015, 2016, doi: 10.1109/ISGT-Asia.2015.7387128.
[7] C. A. Taks Force Members Report, ‘Resilience Framework , Methods , and Metrics for the Electricity Sector’, IEEE Power Energy Soc. Ind. Tech. Support Leadersh. Comm. Task Force, no. PES-TR83 October, p. pgs. 1-30, 2020.
[8] L. Olatunji Ahmed, ‘Prospects of using Dynamic Thermal Rating for a Reliable Power System Network: A Review’, 2021 IEEE Int. Futur. Energy Electron. Conf. IFEEC 2021, pp. 1–7, 2021, doi: 10.1109/IFEEC53238.2021.9661878.
[9] C. Eid, P. Codani, Y. Perez, J. Reneses, and R. Hakvoort, ‘Managing electric flexibility from Distributed Energy Resources: A review of incentives for market design’, Renew. Sustain. Energy Rev., vol. 64, pp. 237–247, 2016, doi: 10.1016/j.rser.2016.06.008.
[10] H. Kondziella and T. Bruckner, ‘Flexibility requirements of renewable energy based electricity systems – A review of research results and methodologies’, Renew. Sustain. Energy Rev., vol. 53, pp. 10–22, 2016, doi: 10.1016/j.rser.2015.07.199.
[11] B. Banerjee, S. M. Islam, and D. Jayaweera, ‘Congestion management with dynamic line ratings considering network imbalance’, IEEE Power Energy Soc. Gen. Meet., vol. 2015-Septe, pp. 0–4, 2015, doi: 10.1109/PESGM.2015.7285597.
[12] D. Kladar, X. Associates, and U. St, ‘Dynamic Line Rating in the world – Overview’, no. February 2014, 2016.
[13] P. Schell, ‘Dynamic Line Rating (DLR)’, Renew. Energy Integr., no. June, pp. 405–411, 2014, doi: 10.1016/b978-0-12-407910-6.00032-6.
[14] C. Electra, ‘ELECTRA N ° 324 October 2022’, no. October, 2022.
[15] A. Gonçalves, M. C. Marques, S. Loureiro, R. Nieto, and M. L. R. Liberato, ‘Disruption risk analysis of the overhead power lines in Portugal’, Energy, vol. 263, no. PA, p. 125583, 2023, doi: 10.1016/j.energy.2022.125583.
[16] S. Küfeoǧlu, N. Gündüz, and M. Lehtonen, ‘Climate change concerns and finnish electric power supply security performance’, IEEE PES Innov. Smart Grid Technol. Conf. Eur., 2017, doi: 10.1109/ISGTEurope.2016.7856318.
[17] A. Ahmed and T. Massier, ‘Impact of Climate Change and High PV Penetration on Power Factor Profile’, 2019 IEEE Ind. Appl. Soc. Annu. Meet. IAS 2019, pp. 15–20, 2019, doi: 10.1109/IAS.2019.8911945.
[18] M. Merante, ‘Application of dynamic rating to improve transportation capability of the power systems connected to wind power plants’, no. September, p. 32, 2016.
[19] P. Denholm et al., ‘Examining Supply-Side Options to Achieve 100% Clean Electricity by 2035’, p. 161, 2022, [Online]. Available: www.nrel.gov/publications.
[20] I. Albizu, A. J. Mazón, and I. Zamora, ‘Methods for increasing the rating of overhead lines’, 2005 IEEE Russ. Power Tech, PowerTech, pp. 1–6, 2005, doi: 10.1109/PTC.2005.4524481.
[21] M. Ntuli, R. Xezile, N. Mbuli, J. H. C. Pretorius, and L. Motsoeneng, ‘Increasing the capacity of transmission lines via current uprating: An updated review of benefits, considerations and developments’, Proc. 2016 Australas. Univ. Power Eng. Conf. AUPEC 2016, 2016, doi: 10.1109/AUPEC.2016.07749338.
[22] D. Sanchez and C. Alonso, ‘Increase in Transmission Capacity in High-Voltage Power Lines on the Levante (Eastern Spain) Coastal Path’, 2004.
[23] R. Benato et al., ‘Highly efficient overhead line innovative conductors with reduced joule power losses’, 2017 AEIT Int. Annu. Conf. Infrastructures Energy ICT Oppor. Foster. Innov. AEIT 2017, vol. 2017-Janua, pp. 1–6, 2017, doi: 10.23919/AEIT.2017.8240504.
[24] S. Hammad, A Stephen, R Gaunt, T Muftic, D Marais, R Naidoo, P Narain, ‘AC to DC Conversion and Other Techniques To Uprate Transmission Lines Based on Input From Planners’, Cigre Sess., vol. B2-104, 2008.
[25] R. Baldick and R. P. O’Neill, ‘Estimates of comparative costs for uprating transmission capacity’, IEEE Trans. Power Deliv., vol. 24, no. 2, pp. 961–969, 2009, doi: 10.1109/TPWRD.2008.2002990.
[26] C. R. Stephen and D. Muftic, ‘Determination of the thermal rating and uprating methods for existing lines’, Cigre Sess. 22-305, 2000.
[27] J. C. d. Saboia Stepha and C. Ferreira Costa, ‘Uprate and Upgrade of Overhead Transmission Lines Methodologies and Reliability’, 2008. doi: 10.1109/PESGM.2012.6345361.
[28] S. P. Hoffmann, A. M. Clark, and N. G. Transco, ‘The Approach to Thermal Uprating of Transmission Lines in the UK’, 2004.
[29] M. Zafran, M. N. Arbab, and M. U. K. Khan, ‘A Case Study on Alleviating Electric Transmission Congestion Using Dynamic Thermal Rating Methodology’.
[30] L. Racz, G. Gabor, and B. Nemeth, ‘Different Approaches of Dynamic Line Rating Calculations’, 7th Int. Youth Conf. Energy, IYCE 2019, pp. 7–12, 2019, doi: 10.1109/IYCE45807.2019.8991570.
[31] S. Vidrih, J. Kosmac, and T. Tomsic, ‘Dynamic thermal rating system in slovenian transmission power system’, 17th IEEE Int. Conf. Smart Technol. EUROCON 2017 – Conf. Proc., no. July, pp. 810–814, 2017, doi: 10.1109/EUROCON.2017.8011222.
[32] L. Rácz, D. Szabó, G. Göcsei, and B. Németh, ‘Grid Management Technology for the Integration of Renewable Energy Sources into The Transmission Ssystem’, 2018 7th Int. Conf. Renew. Energy Res. Appl., 2018.
[33] F. A. Gomez, J. M. Garcia De Maria, D. G. Puertas, A. Bairi, and R. G. Arrabke, ‘Numerical Study of Thermal Behaviour of Bare Overhead Conductors in Electrical Power Lines’, 2011, no. 1, p. 281.
[34] E. Siwy, ‘Risk Analysis in Dynamic Thermal Overload Line Rating’, pp. 1–5, 2008.
[35] S. Talpur, C. J. Wallnerstrom, P. Hilber, and S. N. Saqib, ‘Implementation of dynamic line rating technique in a 130 kV regional network’, 17th IEEE Int. Multi Top. Conf. Collab. Sustain. Dev. Technol. IEEE INMIC 2014 – Proc., pp. 477–482, 2014, doi: 10.1109/INMIC.2014.7097387.
[36] Consentec GmbH, ‘The Benefits of Innovative Grid Technologies Final Report commissioned by currENT’, no. December, 2021, [Online]. Available: http://www.consentec.de
[37] N. Viafora, J. G. Moller, R. A. Olsen, A. S. Kristensen, and J. Holboll, ‘Historical data analysis for extending dynamic line ratings across power transmission systems’, 2018 Int. Conf. Probabilistic Methods Appl. to Power Syst. PMAPS 2018 – Proc., pp. 1–6, 2018, doi: 10.1109/PMAPS.2018.8440449.
[38] T. Konstantinou, N. Savvopoulos, and N. Hatziargyriou, ‘Probabilistic Ampacity Forecasting for Overhead Transmission Lines’, SEST 2019 – 2nd Int. Conf. Smart Energy Syst. Technol., 2019, doi: 10.1109/SEST.2019.8849018.
[39] O. Dzobo and H. Tazvinga, ‘Impact of Weather Conditions on Line Ampacity of Overhead Transmission Lines’, 2019 9th Int. Conf. Power Energy Syst. ICPES 2019, pp. 4–8, 2019, doi: 10.1109/ICPES47639.2019.9105637.
[40] S. D. Kim and M. M. Morcos, ‘An application of dynamic thermal line rating control system to up-rate the ampacity of overhead transmission lines’, IEEE Trans. Power Deliv., vol. 28, no. 2, pp. 1231–1232, 2013, doi: 10.1109/TPWRD.2012.2234940.
[41] A. Dino, A. Ketley, and G. Mcdougall, ‘Dynamic Transmission Line Rating Technology Review’, no. July, 2009.
[42] IRENA, ‘Dynamic line rating’, Innov. Landsc. Br., p. 20, 2020, [Online]. Available: https://www.irena.org/-/media/Files/IRENA/Agency/Publication/2020/Jul/IRENA_Dynamic_line_rating_2020.pdf
[43] L. Dahlgren, ‘Case Study on Applications of Measurement Equipment for Dynamic Line Rating’, 2020, [Online]. Available: http://urn.kb.se/resolve?urn=urn:nbn:se:kth:diva-284242
[44] M. H. A. Aziz, N. S. Miswan, F. A. Farah, M. S. Muhamad Shokri, M. N. Noran, and A. A. Rahim, ‘Pilot project on dynamic line rating (DLR) system for optimal use of tenaga nasional berhad (TNB) grid capacity’, Proceeding – 2nd Int. Conf. Technol. Policy Electr. Power Energy, ICT-PEP 2020, vol. 3, pp. 77–81, 2020, doi: 10.1109/ICT-PEP50916.2020.9249936.
[45] J. Cardenas, S. Dominguez, and R. Kommu, ‘Experiences in dynamic line rating (DLR) using a wireless line monitoring system (ILMS)’, IET Conf. Publ., vol. 2020, no. CP771, pp. 8–13, 2020, doi: 10.1049/cp.2020.0140.
[46] IEEE Power Engineering Society., IEEE standard for calculating the current-temperature relationship of bare overhead conductors, vol. 2006, no. January. 2012.
[47] B. 4. CIGRE, Guide for Thermal Rating Calculations of Overhead Lines, no. December. 2014.
[48] J. Teh, ‘Analysis of Dynamic Thermal Rating System of Transmission Lines’, pp. 1–215, 2016, [Online]. Available: https://www.research.manchester.ac.uk/portal/files/59969878/FULL_TEXT.PDF
[49] L. Staszewski and W. Rebizant, ‘Balance Concepts for Line Ampacity Considerations’, 2010 Mod. Electr. Power Syst., pp. 1–4, 2010.
[50] CIGRE, ‘Guide for selection of weather parameters for bare overhead conductor ratings’, Cigre Work. Gr., no. August, pp. 1–55, 2006.
[51] A. Arroyo et al., ‘Comparison between IEEE and CIGRE thermal behaviour standards and measured temperature on a 132-kV overhead power line’, Energies, vol. 8, no. 12, pp. 13660–13671, 2015, doi: 10.3390/en81212391.
[52] M. S. M. Shokri, F. A. M. Kasran, M. H. Abdul Aziz, N. S. Miswan, M. N. Noran, and A. A. Rahim, ‘Dynamic Line Rating (DLR) by Weather-Based Calculation for Power Grid Optimization in Tenaga Nasional Berhad (TNB)’, HONET 2020 – IEEE 17th Int. Conf. Smart Communities Improv. Qual. Life using ICT, IoT AI, pp. 113–117, 2020, doi: 10.1109/HONET50430.2020.9322810.