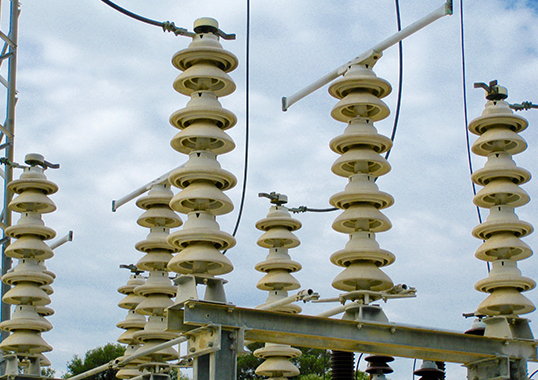
ISA Intercolombia monitors lightning activity on its overhead transmission lines using data from the Colombian Total Lightning Detection System (CTLDS), which is based on LINET (LIghtning NETwork) technology. This data enables advanced analytics to assess lightning impact and develop strategies to reduce its severity across the company’s nearly 12,000 km of transmission infrastructure.
As discussed in this edited contribution to INMR by R. F. Dickson, L. Porras, D. Aranguren and S. Mejía, an expert system was developed, integrating modules for information, gathering real-time monitoring and prediction. The monitoring and information modules generate near-term failure predictions using lightning characteristics such as density, current, polarity, and multiplicity.

This lightning monitoring and prediction tool enhances the supervision and control of ISA Intercolombia’s transmission assets. It boosts situational awareness at the Control Center, helping engineers respond more effectively to lightning-caused outages. Faster response times can reduce service interruptions, improve system reliability, and lower annual asset unavailability—ultimately benefiting the company’s operational performance and profitability. When a risk alert is issued, the Control Center can proactively assess system conditions, implement mitigation strategies, and coordinate restoration efforts.
The tool also aids decision-making by providing real-time diagnostics of failure causes and weather conditions during outages. This allows for immediate action to restore service or conduct deeper analysis using oscillograph data, especially for failures not caused by lightning. Since lightning is a leading cause of transmission line outages, the system indirectly helps monitor other risks like wildfires or vegetation interference. Moreover, the system supports right-of-way maintenance by warning personnel about lightning threats, helping them decide whether to proceed with or to postpone work. The insights generated also support engineering and project teams in designing new transmission lines.
Transmission System
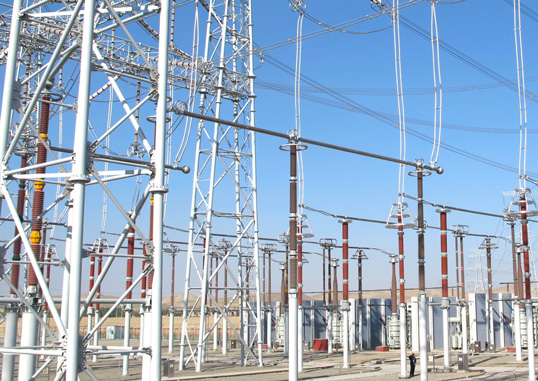
Colombia’s power transmission system is composed of various power utilities, including ISA Intercolombia, which operates approximately 12,000 km of transmission lines nationwide. These lines are segmented by different voltage levels, as shown in Table 1.
Considering that one of the most important duties of power utilities is to ensure the reliability and availability of assets, it is essential to evaluate all possible causes that could affect their operation. Based on historical data, Fig. 1 describes the four most recurrent causes of transmission line failures over a 10-year period (2014–2024).
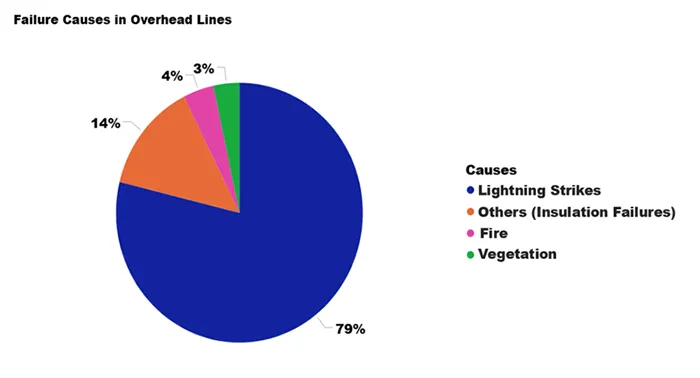
According to the previous figure, failures caused by lightning account for 79% of all transmission line failures and with respect to lightning activity, the Table 2 shows the number of lightning strokes detected in the total Colombian territory (1,142.000 km2) varying from 23.9 million in 2021 to 46.7 million in 2023. Lightning incidence presented an increase during the four-year period with a very high value reported in 2023 mostly influenced by the La Niña Phenomenon that marked the prevailing raining conditions in that period. As a reference parameter, maximum peak currents are also given in Table 2. In particular, the number of strokes within a 10 km buffer around the ISA´s power lines vary from 2.99 million in 2021 to 8.5 million in 2023.
As described, the power line influence area´s strokes vary from 12.5 to 18.2% of the total lightning activity detected in the entire territory during the last four years. Regarding the magnitude of lightning currents within the 10 km buffer around transmission lines (Table 2), the maximum discharge current has been increasing over the past four years, reaching a peak of 369 kA in 2024. It suggests not only a rise in the number of lightning strokes, but also an apparent increase in their maximum current, meaning that each year this phenomenon could pose a greater threat to transmission systems.
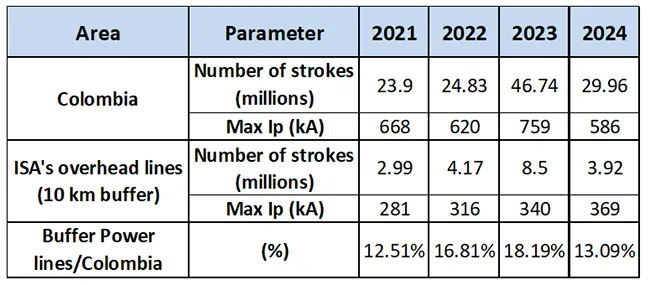
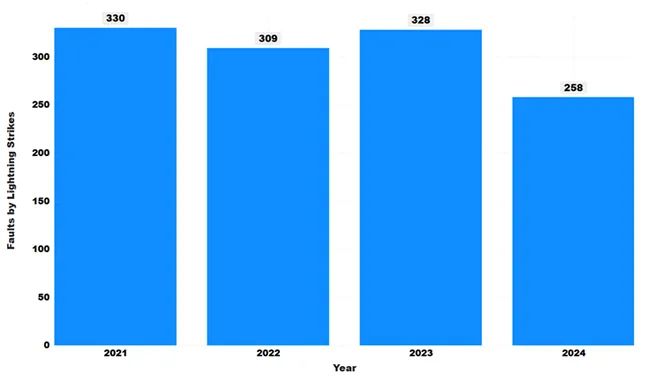
Fig. 2 provides the number of failures caused by lightning over the same four-year period (2021–2024). Despite the variations observed in the number of lightning strokes over the years, lightning-related faults tend to remain stable each year except in 2024, which showed a decrease. This reduction may be due to improved classification of fault causes in transmission lines, resulting from better data interpretation enabled by analytics and enhanced accuracy of the lightning information system.
Given the annual behavior of both lightning and the resulting failures, a deeper analysis per month is illustrated in the Figs. 3 and 4 to identify stronger correlation between these variables.
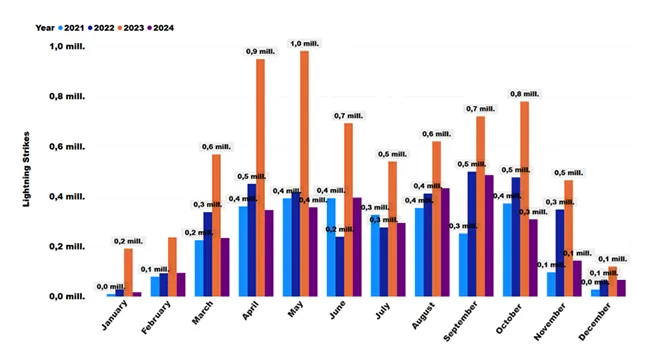
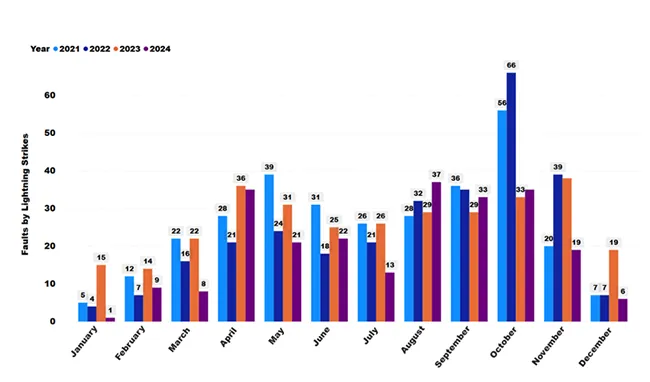

Although, as previously mentioned, 2023 experienced an abnormally high number of lightning strokes, it can be observed that the behavior of failures tends to follow the peaks and valleys of lightning activity over months. This indicates that lightning-related faults are, in some measure, influenced by lightning density. In addition, Fig. 4 provides a detailed overview of the months exhibiting elevated faults, primarily driven by lightning strikes. The most impacted months are April, May, and October.
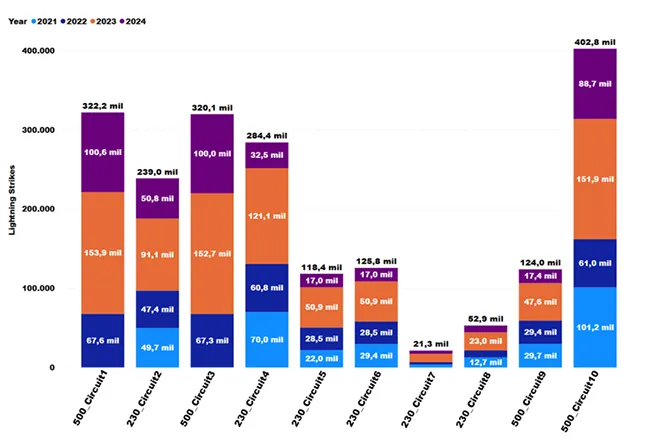
Figs. 5 and 6 present complementary perspectives on lightning activity and its impact on electrical infrastructure. Both figures cover the same period and circuits, yet they emphasize different trends. Fig. 5 illustrates the distribution of lightning strikes across the electrical circuits with the highest failure rates, while Fig. 6 presents the failure rates of these same circuits, normalized per 100 km per year.
A comparison of the two figures reveals that a high density of lightning strikes does not necessarily correlate with higher fault rates. This observation suggests that other factors—such as the quality of grounding systems, the presence of surge arresters, tower and insulation design, and the effectiveness of lightning detection and monitoring systems—play a significant role in mitigating lightning-related faults.
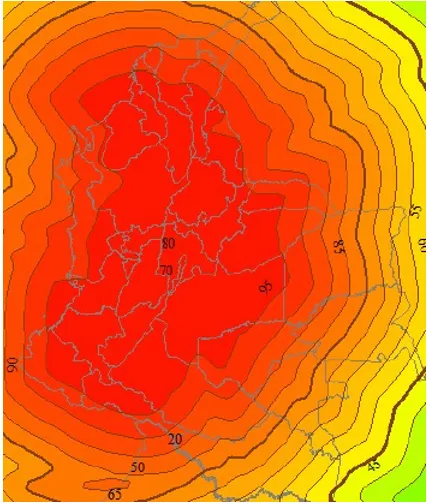
Fig. 6 further indicates that the transmission line “500_Circuit1,” which is the most susceptible to lightning-related faults, operates at 500 kV and is situated in a region with a high lightning strike density—reaching a peak of 55 flashes/km²/year, as shown in Fig. 7. Additionally, it is observed that some 230 kV lines, despite experiencing fewer lightning strikes, exhibit failure rates comparable to those of the 500 kV lines. This suggests that these 230 kV lines may possess specific vulnerabilities—such as insulation deficiencies—that increase their susceptibility to faults. As a result, these lines should be closely monitored and evaluated for potential improvements.
Lightning Detection System
The analysis based on lightning data from the Colombian Total Lightning Detection System (CTLDS), illustrated in Fig. 1, has improved the precision in determining the true causes of failures. The CTLDS comprises 24 sensors, and its effectiveness has been reported in multiple studies, in accordance with the evaluation procedures described in IEC62858.
The system achieved an average location accuracy of 0.182 km and a detection efficiency of 97% for lightning-caused failures in power lines. These results meet the IEC 62858 standards, which recommend a detection efficiency above 80% and a location accuracy within 500m. Additionally, Betz [6–7] has presented performance evaluations of LINET (LIghtning NETwork) technology and comparisons with other lightning detection systems worldwide.
Efficiency of Lightning Detection Systems
The effectiveness of the Lightning Location Systems (LLS) largely depends on factors such as the number of sensors, the distance between them (baseline), and their geographic distribution across a region. Detection Efficiency (DE) is generally expected to be high when a lightning flash is captured by at least six sensors positioned in different directions. However, in real-world scenarios, DE can be influenced by additional factors such as complex terrain, ground conductivity, local noise, and physical obstructions (CIGRE TB376 WG c4.404.
To assess variations in DE across the coverage area, Relative Detection Efficiency (RDE) methods are used. These methods help identifying regional deviations in detection performance. DE maps, whether theoretical (based on network layout) or empirical (based on peak current data), reveal actual performance differences that may impact failure detection (Figs 9 & 10). As a result, RDE calculations are integrated into failure correlation processes and are crucial for timely and accurate failure analysis and reporting.
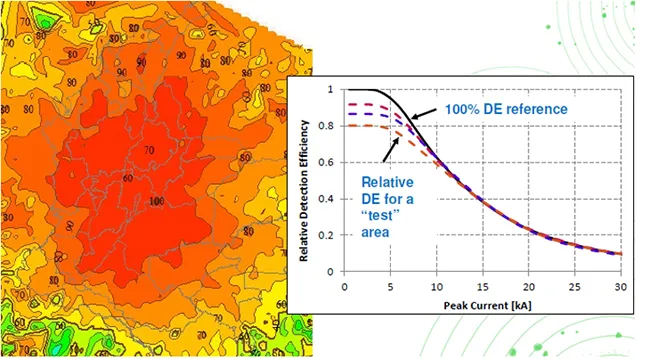

Detection Efficiency is of crucial importance on the correlation criteria since when the detection efficiency is higher than 95%, the correlation is precise in both time and location. Nevertheless, when the detection efficiency is lower than 80%, a miscorrelation may be obtained. To address this limitation, satellite-based lightning mapping, such as that provided by the Geostationary Lightning Mapper (GLM), is employed. Due to its measurement principle based on optical sensing is highly affected by atmospheric conditions, a systematic combination of both ground-based and satellite lightning detection systems is proposed to obtain reliable failure analytics even when DE is reduced.
Therefore, the correlation module integrates two advanced lightning detection systems to enhance fault cause analysis. The first one is based on LINET (Lightning Detection Network) technology, a high-precision ground-based system. The second system is the Geostationary Lightning Mapper (GLM), an optical sensor onboard NOAA’s GOES satellites. GLM operates from geostationary orbit and continuously monitors total lightning activity.
This correlation method, which consists of two lightning detection systems, sometimes supports the correlation of failures that are not caused by lightning, such as those resulting from vegetation interactions with overhead conductors. A real example will be illustrated later.
Failure Cause Estimation Tools for Transmission Lines
With the ongoing energy transition and rapid expansion of transmission networks, current power reliability standards require faster fault detection, reporting, and restoration. This means that when a transmission line goes out of service, it’s essential to accurately determine the root cause of the failure. Lightning Detection Systems support real-time decision-making by enabling a quick online assessment of whether lightning was responsible and pinpointing the strike location at the time of the outage, allowing for immediate corrective action. Given that around 79% of transmission line failures in Colombia are due to lightning, high-precision total lightning detection systems are crucial. They make it possible to identify the specific tower affected and confirm the true cause of the fault.
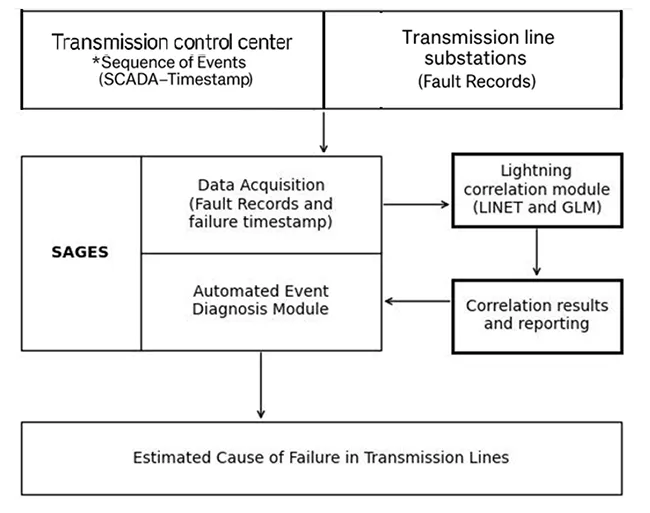
At ISA INTERCOLOMBIA, a Substation Automated Equipment Management System (SAGES) plays a critical role in supporting real-time operational activities (see Fig. 11). This system automatically retrieves fault records from both substations associated with a transmission line following a disturbance. Utilizing this data, SAGES executes fault location algorithms and computes the corresponding fault impedance. These impedance values, along with other critical fault characteristics and data from the lightning correlation module, are then processed through a decision matrix. This integrated analysis enables the system to accurately identify the root cause of the fault, improving diagnostic accuracy and supporting timely restoration efforts.

Lightning Correlation Module
The correlation method (as described in Fig. 12) consists in processing time of failure with a precision of milliseconds and using a correlation area expanded to the complete line extension from SUBSTA to SUBSTB. With this method, the failure location from one line end is not used, which minimizes the correlation processing time and avoids the errors involved in the location calculation.
![]()
The correlation assessment is based on an index denoted as SCORE, given by:
SCORE=Y1 (t)×Y2 (R) (1)
Y1 (t) and Y2 (R) are time and distance functions, given as follows:
![]()
where,
Y1 (t) is the SCORE time function with a range of [0, 1].
Y2 (R) is the SCORE distance function with a range of [0, 1]
t is the absolute time difference between the failure and the stroke detection time in seconds.
R is the radial distance from the stroke location to the transmission line in km.
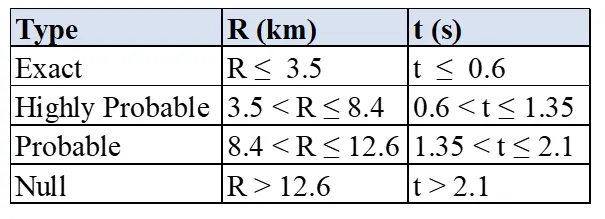
σt y σR are smoothing parameters for both time and distance differences, which are defined based on experimental errors from real correlations over the Colombian power transmission system (Time error of 600 ms and radial distance error of 3.5 km for exact correlations – Table 4), when comparing lightning data with protection relay data.
SCORE assessment is performed as given in Table 3:
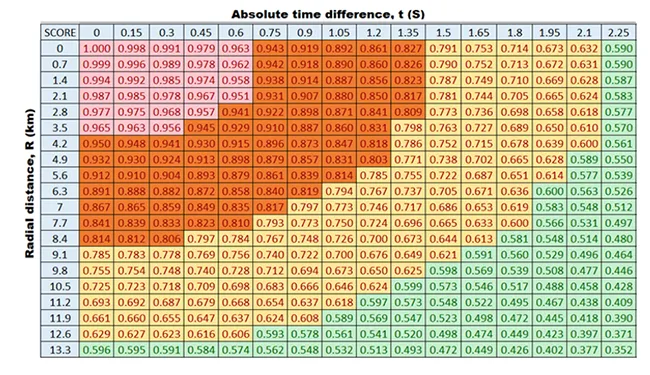
According to Table 3, SCORE values in the range [1.00, 0.951] indicate an exact correlation (highlighted in red). Values between [0.95, 0.80] suggest a highly probable correlation (highlighted in orange), while those in the range [0.78, 0.60] represent a probable correlation (highlighted in yellow). Values below 0.59 indicate that correlation is not possible (highlighted in green).
In this method, the correlation determining variable is the time absolute difference t, since it takes advantage of the GPS synchronization that exists between the lightning detection network and the protection relays together with the Supervisory Control and Data Acquisition (SCADA) system, which provide the control center personnel with the sequence of events (SOE) that occur in the power system, with a time stamp in milliseconds.
In this way, during a transmission line failure, the control center performs correlations using the time stamp of the first signaling of the SOE protection operation, which is instantaneous during the occurrence of a failure. In most of the times, the time errors between the SCADA systems, the electrical protections and the lightning detections are less than 100 ms. Radial distance errors, which are the sum of the tower geographic error and the stroke location errors (mean stroke location error less or equal to 500 m) is approximately 3.5 km for exact correlation (see Table 4). This correlation method allowed improving the failure-cause classification for transmission lines. Given its accuracy, it is a very important input for the root cause analysis applied to substation equipment and transmission lines.

Processing & Reporting
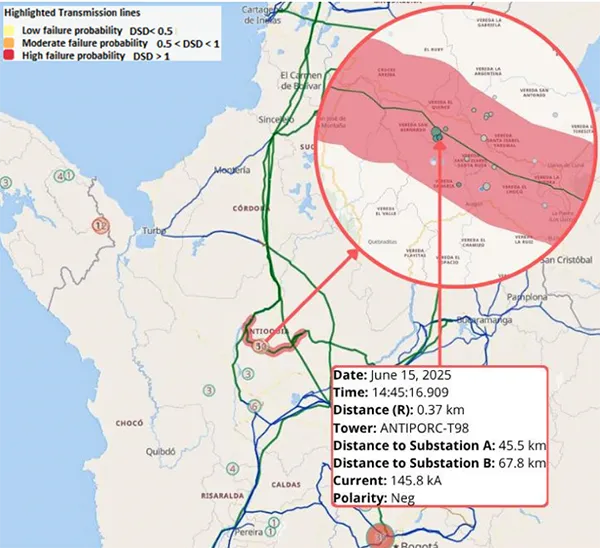
A reporting module allows querying the lightning activity over a transmission line (within a perimeter of 5 km, along the entire length of the circuit), a substation or a specific geographic coordinate. Failure date and time (with a resolution in milliseconds) are the input data, with the selection of a given affected asset (line or substation), with several output modes such as e-mail or visual interface. Reports are generated in standard formats (such as PDF) and are automatically delivered to operators and decision makers. A correlation example is given in Fig. 13.
In Fig. 13,
• Date: failure timestamp with precision in milliseconds
• Current: Stroke peak current, in kA (ND: Not determined, due to this stroke was detected by GLM).
• Dist (R): Perpendicular distance from the stroke location to the affected transmission line, in km.
• Dist (SUBST A): Distance from Substation A to the failure location, in km.
• Dist (SUBST B): Distance from Substation B to the failure location, in km.
• Tower: Closest transmission tower to the failure stroke
• Score: correlation index used to evaluate the correlation quality
As described in the example of Fig. 13, a strong correlation was found between the failure time and location with a flash detection composed by a first stroke with a peak current of 145.8 kA followed by a series of subsequent strokes within a flash duration of 236 ms detected in a distance range from 370 to 3360 m. The SCORE in this case provided a result of 1 corresponding to a “Exact” correlation according to the SCORE sensitivity evaluation of Table 4.
Using Geostationary Lightning Mapper (GLM) Data to Identify Vegetation-Induced Faults
A real case in the Colombian transmission system is illustrated below, where a 500 kV circuit failed on Jan. 6th at 13:30 due to arcing through vegetation. This failure was uniquely correlated using GLM, with the following characteristics:
• No rainfall or thunderstorms were observed in the area surrounding the circuit within a one-hour time window (Fig. 14).
• No correlation was detected using LINET (Lightning Detection Network) technology, a high-precision ground-based system.
• The correlation using GLM was exact (Figure 15).
• The fault location algorithm, based on measurements from both ends of the transmission line, yielded 47.23 km from Substation A—similar to the 47.35 km reported by the GLM system.
• Failure analysis based on fault records indicated a high-impedance fault (10 Ohms) with characteristics consistent with vegetation interference.
• After a transmission line inspection, a Guadua—native bamboo species—was found very close to the faulty conductor, being identified as the cause of the failure (Fig. 16).

Real-Time Supervision
Real-time supervision module is a graphic interface that monitors lightning activity over the transmission lines (see Fig. 17). Lightning data from the CTLDS feeds the systems to perform a variety of analytic tasks based on the Dynamic Stroke Density Method introduced by Pérez et al. as a new dynamic risk function for power transmission lines.
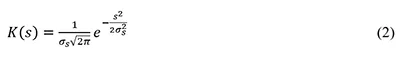
The Dynamic Stroke Density DSD during an active thunderstorm with respect to a specific position x of the power line is given by eq. (1) where N is the number of strokes in a given period of time, Ki (s) is a gaussian kernel function for distance and Fi (I) is a sigmoid function for the stroke peak current.
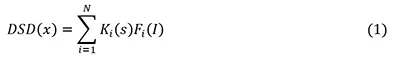
The Gaussian kernel function Ki (s) is given by eq. (2) where σs is a “smoothing factor” of distance and s is the distance from a given stroke to the position x.
The sigmoid function for the stroke peak current Fi (I) is given by eq. (3) where I is the stroke peak current, IBFO is the critical peak current for back flashover of the line position x and σc is a “smoothing factor” of current. The critical peak current for back flash over can be estimated by its simplified form IBFO=3CFO/((1/3)ZT+(2/3) RT ) where CFO is the critical flash over voltage of the insulation at the position x, ZT is the surge impedance of the tower and RT is the ground resistance.
Note that the previous formulation supposes that the higher the lightning peak currents detected in an approaching thunderstorm, the higher the risk, since typically most transmission line failures are due to back flashovers caused by direct lightning strikes overhead ground wires with very high peak currents; further considering that once a high current stroke has been detected, there is a higher probability that another high current stroke will occur again. In addition, previous assumptions result more applicable for high voltage systems, i.e. nominal voltage higher than 220 kV, and needs to be re-formulated for lower voltage ones. In any case, the influence of the detected stroke peak currents will be reflected in the values taken by σc.
The DSD for the complete path of a transmission line can be defined as the integral of the function given in (1) along the total length of the transmission line. In discrete form and considering ∆l as a constant span between subsequent transmission towers, DSD is given by (4) where N is the number of strokes in a period of time, M is the number of line segments, ∆l is the length of the line segment (span between subsequent towers), sij is the distance between the stroke i and the segment j, Ii is the peak current of the stroke i and IBFOj is the critical current for back flashover in the segment j. For simplicity, eq. (4) is written in terms of the gauss error function erf.
DSD behavior during a real lightning disturbance event in a transmission line is illustrated in Fig. 18. In this case, a 500kV transmission line with 415 towers and 212 km in central Colombia reported a failure at 21:57 local time on 21 July 2018.
The DSD risk function is used to estimate the power failure risk by considering both the lightning hazard time-space dynamic evolution and the line vulnerability, where a simplified thumb rule for situational identification is given by: i) DSD < 0.5 (Low failure probability), ii) 0.5 < DSD < 1 (Medium failure probability), iii) DSD > 1 (High failure probability).
The main functionalities for the real-time monitoring are: i. graphical identification of lightning activity on transmission lines, ii. efficient calculation of failure probability on lines and fast identification of affected assets, iii GIS data structure for precise information deployment about paths, characteristic, physical and electric data relevant for the power line performance, iv. GIS data structure for lightning and meteorological data analyses.
Fig. 19 illustrates the process diagram of the lightning-caused failure forecast for power lines. Detailed tower physical characteristics are assimilated and loaded in a dynamic database (DB-Towers) which is used to compute the vulnerability indexes at every tower site. As previously mentioned, the DSD risk function is based on a gaussian kernel computation supported on the real time lightning detection and the lightning forecast obtained from adapted weather forecast models. Vulnerability parameters and DSD modeling are combined to compute the failure risk at a given tower site. The failure history and continuous monitoring support a learning loop to continuously improve forecast skills.
Fig. 20 describes the method used to evaluate the prediction skill of the previously described model. It uses a ROC curve based on the True Positive Rate – TPR and False Positive Rate FPR according to different DSD thresholds. The prediction skill is given by the Area Under the Curve – AUC as illustrated in Figure 20. As can be noted in the example, AUC of 0.95 for a 230 kV line is obtained whereas an AUC of 0.79 is found for a 500 kV line, both in mountainous conditions.
This method is currently used to evaluate the prediction performance for different power lines under different conditions and to improve the model itself by considering additional predictive variables related to the thunderstorm physical characteristics, orographic conditions, seasonal patterns, constructive characteristics and protection elements of the power line, among many others.
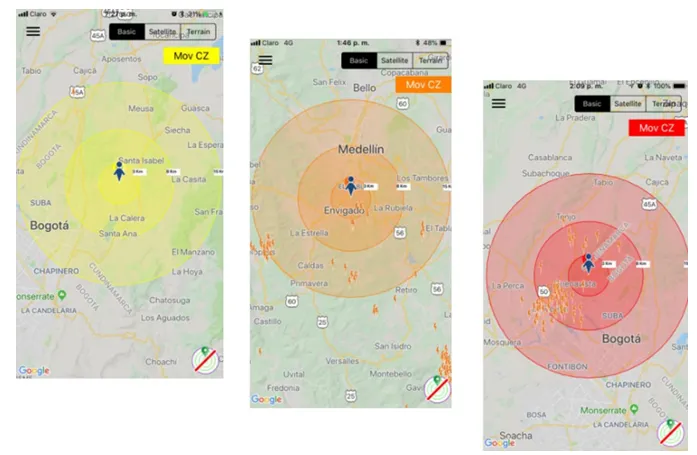
Safety Application for Right of Way Activities
Safety issues related to lightning strikes during right-of-way (ROW) activities in transmission lines are critical due to the high energy and unpredictability of lightning events. Workers during routine patrols are provided with a mobile application, which alerts them about lightning activity nearby.
As depicted in Fig. 21, three warning areas are used to trigger alerts; the smaller one is the Area Of Concern AOC, where a lightning flash has the potential to affect people safety, the medium one is the Warning Area WA, where lightning detections are used to trigger alerts to prevent people in risky activities in AOC, in this case, personnel should suspend activities and begin seeking shelter and, the Coverage Area CA, which is used to monitor close thunderstorms without risk. Red, orange and yellow colors are used to indicate the warning level related to AOC, WA and CA.
Conclusions
This study presents an Expert System designed to analyze data and predict lightning-induced failures in transmission lines, with the objective of enhancing the reliability and operational efficiency of the electric service provided by ISA INTERCOLOMBIA. A key contribution of the system lies in its ability to identify root causes of failures, enabling proactive and informed decision-making to support preventive and predictive maintenance strategies that meet or surpass regulatory quality standards. Ensuring personnel safety and optimizing operation and maintenance costs are also central goals.
The system’s centralized architecture is highly scalable and adaptable, allowing it to be configured for individual transmission lines or other electrical assets based on their specific technical parameters. To support more integrated, secure, and reliable transmission system operations, the platform incorporates advanced correlation techniques and analytical modules for real-time monitoring and short-term prediction (nowcasting within 1 hour). The predictive algorithms are capable of processing large volumes of complex data autonomously, delivering effective performance that is expected to improve further with the development of specialized models tailored to meteorological and electrical dynamics.
References
[1] Aranguren D., Inampues J., López J., Torres H., Betz H. Cloud to ground lightning activity in Colombia and the influence of Topography. Journal of Atmospheric and Solar-Terrestrial Physics.
https://dx.doi.org/10.1016/j.jastp.2016.08.010. 2016
[2] IEC62858. Lightning densities based on lightning location systems (LLS) – general principles. International Electrotechnical Commission, 2015.
[3] Aranguren D., González J., Cruz A., Inampués J., Torres H., Sarmiento P. Lightning strikes on power transmission lines and lightning detection in Colombia. 2017 International Symposium on Lightning Protection (XIV SIPDA), Natal, Brazil, 2017.
[4] Gonzalez J., Aranguren D., Inampués J., Cruz S., Torres H., Gomez J., Arango C., Asenjo F. Lightning Information Management Systems, a Useful Tool to Make Accurate Decisions. Study Case: Chivor – Rubiales Transmission Line. International Conference on Lightning Protection 2018, Rzeszow, Poland.
[5] Pérez E., Espinosa J., Aranguren D. On the Development of Dynamic Stroke Density for Transmission Line for Power System Operational Applications. International Journal of Electrical Power and Energy Systems, Volume 116, March 2020, 105527.
https://doi.org/10.1016/j.ijepes.2019.105527
[6] H. Höller, H.-D. Betz, K. Schmidt, R. Calheiros, P. May, E. Houngninou, G. Scialom. “Lightning characteristics observed by a VLF/LF lightning detection network (LINET) in Brazil, Australia, Africa and Germany”. Atmos. Chem. Phys., 9, 7795-7824, 2009.
[7] Betz, H.-D., “Utilization of Lightning Data for Recognition and Nowcasting of Severe Thunderstorms”, EGU General Assembly, May 02-07, Vienna, 2010.
[8] L. Porras, R. Dickson, G. Fonseca, and D. Aranguren, “Supervision and Forecast of Lightning Threat on Transmission Lines,” presented at the CIGRE Session, Paris, France, Paper 11736, 2024.
[9] R. Dickson and D. Aranguren, “Performance of Lightning Detection Systems for the Identification of Failure Causes in Transmission Lines,” presented at the CIGRE Session, Paris, France, Study Committee C4 – Power System Technical Performance, PS3, Q3.4, Oral contribution, 2024.