IEEE Technical Guide 1410 on improving lightning performance of distribution lines saw several key improvements when its was updated over a decade ago. Because the experts involved at the time had roots in the world of lightning and system transient modeling, the Guide contained equations and estimates not usually found in such documents and has remained a source of valuable help in evaluating lightning performance data. For example, engineers can estimate the degree of improvement in lightning performance of distribution lines without having to run complex transient modeling software.
This edited past contribution to INMR by arrester expert Jonathan Woodworth outlined some of the main details and applied this to the case of distribution lines in the State of Florida.
Direct Strike Flashover Rate for Distribution Lines
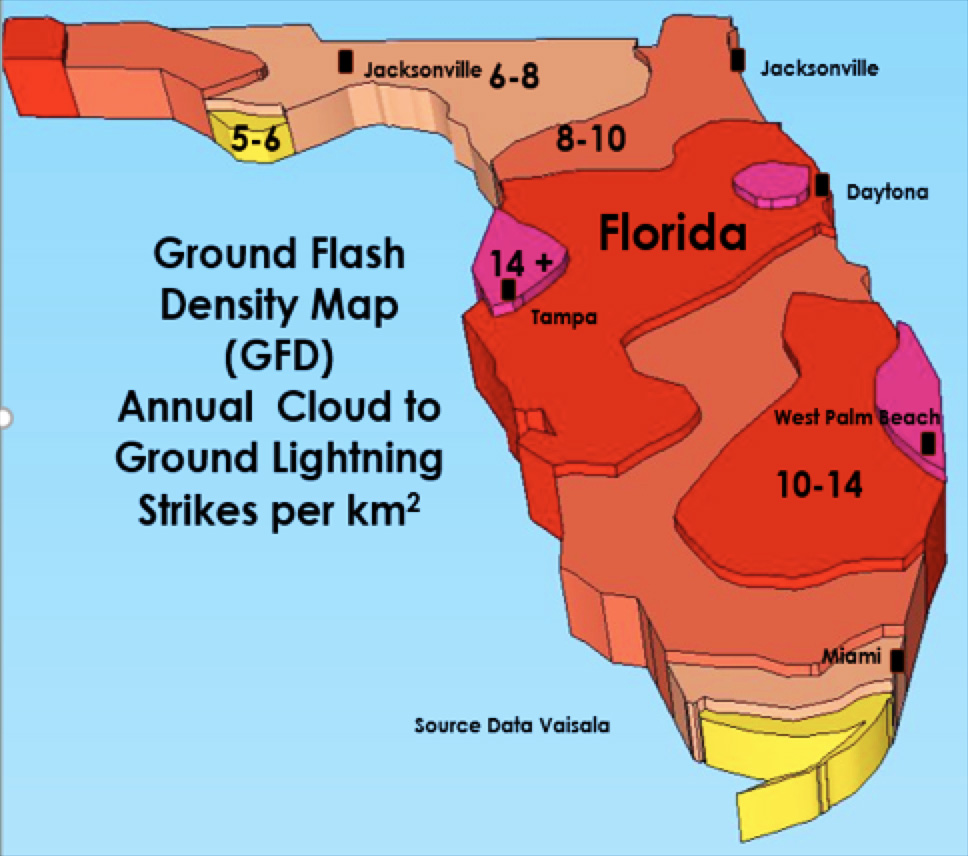
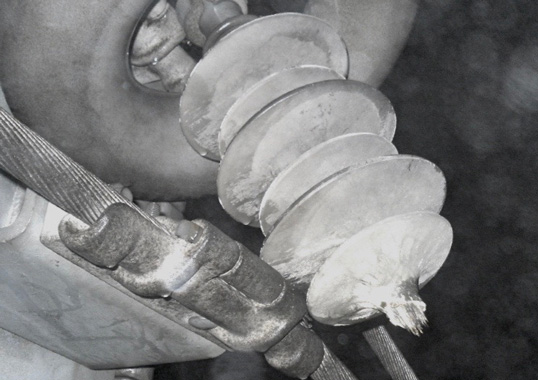
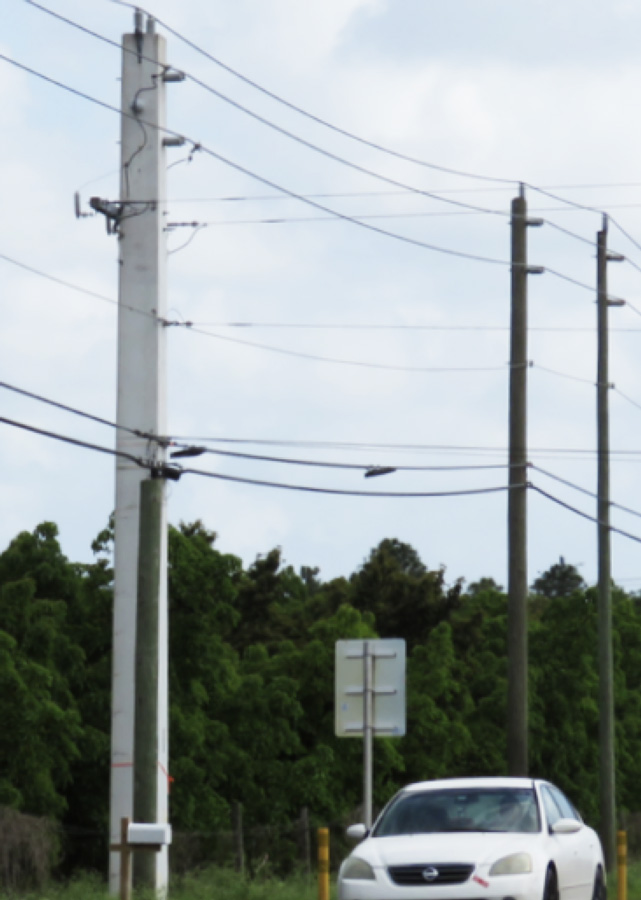
Since distribution lines are seldom shielded with OHGW, direct strikes occur in high lightning areas. To determine flashover rate of a line equipped with arresters, one only need know height, width, location of arresters and ground flash density (GFD). Fortunately, there are numerous sources that offer lightning GFD for areas of interest worldwide. For example, IEEE TG 1410 offers a map of the continental U.S. and shows that, in the case of Florida, GFD ranges from 5 to +14 flashes/km2. For a typical 10 m high line of 1 m width in the south-central region where there are 5 m trees to the left and a highway to the right, the number of strikes could be calculated using equation 7:
Nhits=GFD *(28*(Height).6+Width)/10
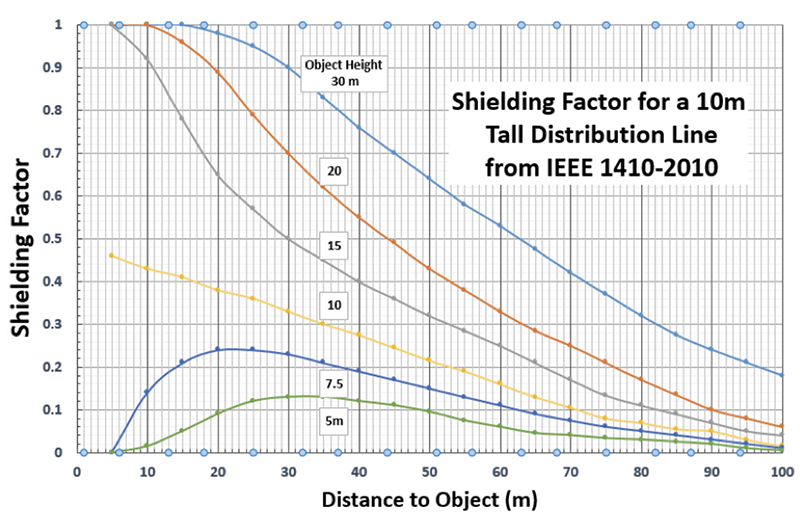
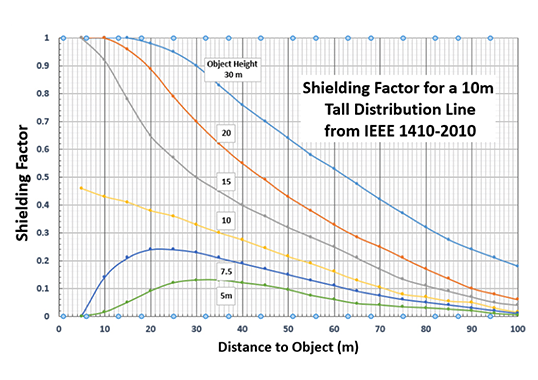
The calculation yields a hit rate of 15.75 times/yr for every 10 km of line. But since objects on either side of the line provide some shielding, they must also be considered. Again, IEEE 1410 provides a set of equations to assess this. Allowing for the shielding provided by 5 m trees located 10 m from poles on one side and 5 m trees on the other side of the highway, about 60 m to the right, one can use equation 9:
Nhits–shielded=Nhits*〈1-(Sfleft+Sfright)〉
Now, annual hit rate drops to 14.5 direct strikes/yr. If the trees to the left were 10 m tall, strike rate would decrease to 8.03/yr while if the trees were taller than the line (e.g. 15 m), it would effectively be shielded from direct strikes with a hit rate of only 0.31/yr. Clearly, environmental shielding has significant impact on lightning hit rate. If trying to reduce outages due to lightning, equipping the line with arresters would be a good strategy.
Direct Strike Outage Rate of Distribution Line Protected by Arresters
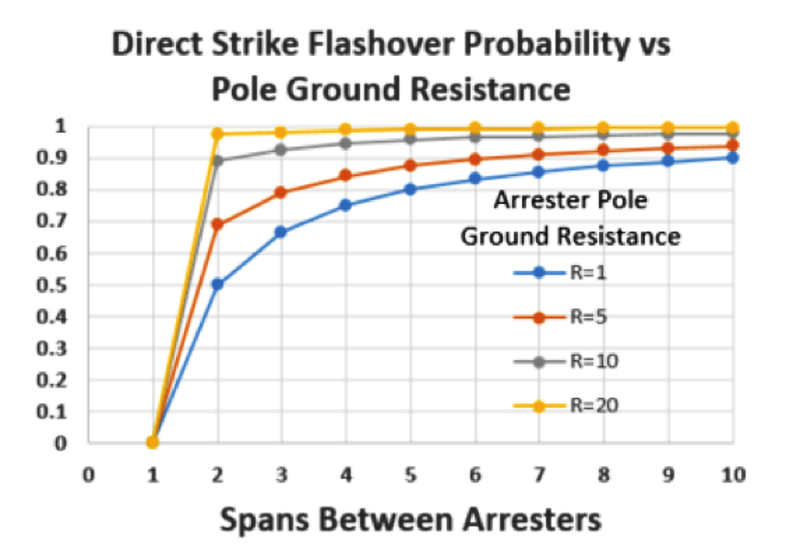
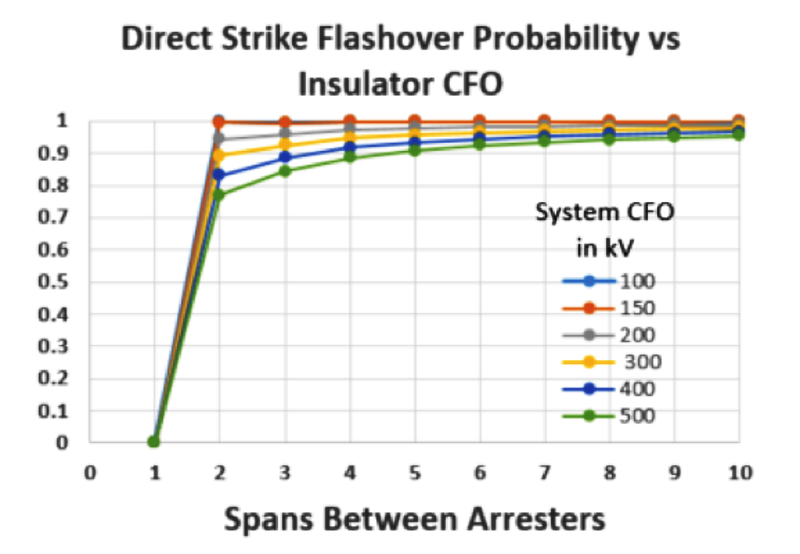
IEEE 1410 contains formulas to calculate the impact of arrester spacing on line flashover rates from direct strikes. When deciding to use arresters to improve performance, a key question is what installation density will provide greatest benefit. For example, it has long been common practice among rural utilities in the U.S. to install arresters every 4 to 5 spans. It is not clear where this policy originated but equations B20, 21 and 22 in IEEE 1410, show that this practice has virtually no impact on distribution system protection (see Figs. 4 and 5), with only limited impact on direct strike flashover probability. There is however improvement by adding arresters to every pole.
Indirect Strike Outage Rate for Unprotected Distribution Lines
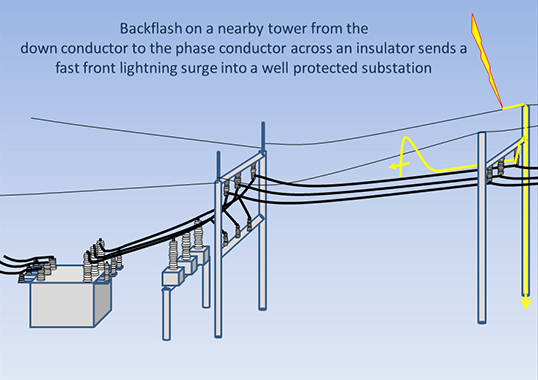
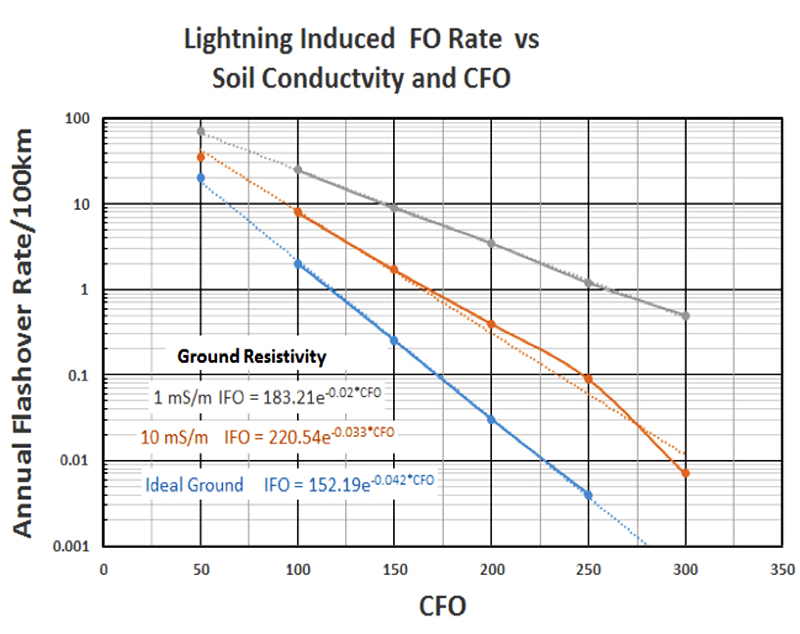
Lightning strikes nearby objects more often than a line directly and the impact of this is also treated in IEEE 1410. Two factors that control outage rate of distribution lines from nearby strikes are the CFO of insulators and the resistivity of the earth. Fig. 6, derived from data in IEEE 1410, indicates that for a GFD of 1, line outage rate due to nearby lightning is about 1.8/yr/100 km. This translates to 2.5 flashovers annually on the 10 m line in Florida having a GFD of 14 and a CFO of 150 kV. Depending on objectives, such line may or may not be a good target for arrester protection from indirect strikes.
Indirect Strike Outage Rate for Distribution Lines Protected with Arresters
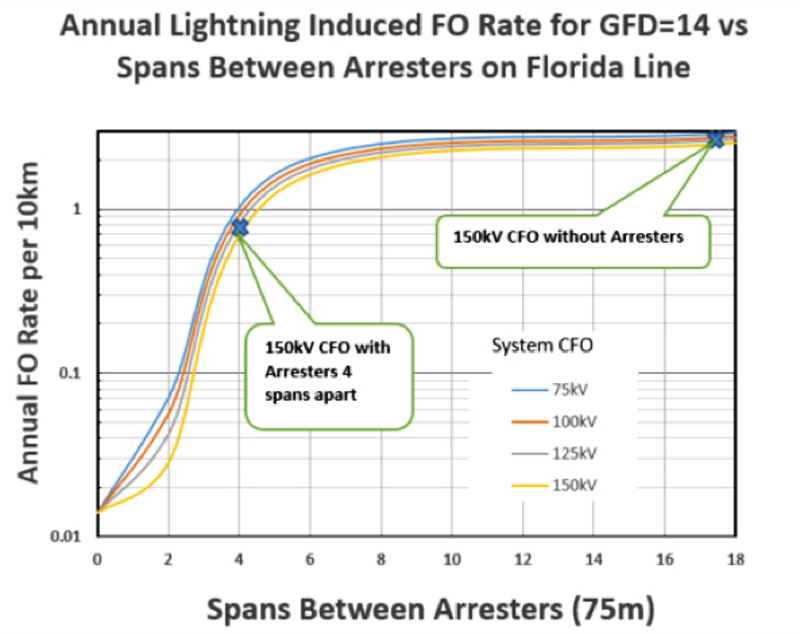
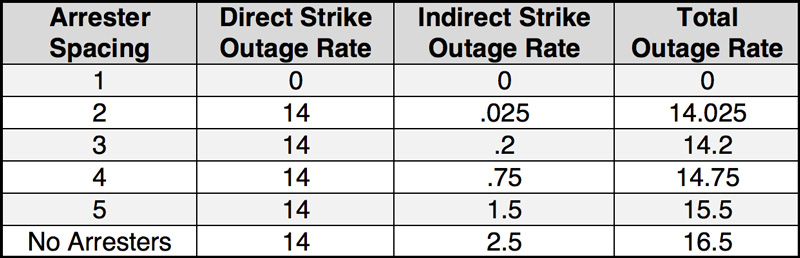
The Working Group at the time quantified lightning caused flashover rate using computer simulations. Fig. 7, based on graphics in IEEE 1410, shows that an arrester spacing of 4 spans has limited impact on line outage rate. With ground resistivity of 10 mS/m (as in Florida), a 150 kV CFO, a GFD of 14 and line length of 10 km, installing arresters every 4th span reduces outage rate from 2.5 (with no protection) to 0.75 flashovers annually – or about once every 1.5 yrs. But installing arresters every 2 spans would lead reduce the indirect strike outage rate to only once every 30 yrs. For final line analysis, both direct and indirect strike outage rates need to be combined for the total outage rate (see Fig. 8 in this example).
[inline_ad_block]