[inline_ad_block]
Increasing market integration between countries and introduction of renewable energy sources on a larger scale has resulted in a growing demand for enhanced capacity in transmission systems. As a consequence, several utilities in Europe and elsewhere have been uprating or building new overhead lines and substations. Several feasibility studies have been performed related to different uprating alternatives, including conversion of OHL from AC to DC operation and this recent contribution to INMR by Andreas Dernfalk, Jan Lundquist and Igor Gutman presented typical approaches along with case studies.
Uprating Alternatives, Drivers & Constraints
Before conversion to DC is considered, possible AC line uprating options should be evaluated in regard to efficiency and cost. For example, phase-shifting transformers or FACTS can be applied to redistribute power flow between individual lines and improve transmission capability, respectively. Alternatively, capacity can be increased by introduction of dynamic thermal rating schemes, allowing higher conductor operating temperatures, or re-conductoring with high temperature low sag (HTLS) conductors. Yet another possibility, typically resulting in greater increase in capacity but at higher cost, is uprating to higher AC voltage. These AC uprating options will usually be less expensive than conversion to DC per additional MW of power capacity. However, AC uprating seldom achieves the same capacity increase as DC conversion or the system benefits of DC transmission. The main reasons why DC is generally considered the most efficient way of gaining major increases in power transfer capability include:
• DC lines can be operated at their thermal limits, without stability constraints;
• DC corona effects are less pronounced, especially under wet conditions, and this can allow comparatively high operating DC voltages;
• Line insulation is more effectively utilized by constant DC voltage.
Utility interest can be explained by two factors:
1. Increasing lead times and difficulty in obtaining right-of-ways for new transmission lines due to public resistance;
2. Development of voltage source converters (VSC) for HVDC, making introduction of DC more attractive since VSCs also support the AC system.
Major constraints for AC to DC line conversion are:
• High cost of converter stations;
• Enhanced performance requirements for insulators operating in polluted service areas.
Corona & Field Effects
Corona and field effects of DC transmission lines include audible noise (AN) level, radio interference (RI), corona loss (CL) as well as electric field and ion current density in the vicinity of a line. Effects will depend on configuration and positioning of conductors and also on DC voltage level. Corona and field effects of DC lines are significantly different from AC, e.g. corona activity increases in rain but, due to formation of space charges, AN and RI levels are lower while increase of corona loss is limited compared to AC. Based on past research dealing with subjective evaluation of DC corona audible noise, it has been recommended that a 40 dBA limit be applied for the L50 AN level at the edge of a right-of-way for DC lines in fair weather. There are empirical formulas for calculating AN L50 level of DC lines under such conditions. The RI limit of a DC line should be evaluated on the basis of the signal to noise ratio (e.g. 20 dB) in order not to influence broadcast reception, the same way as for AC lines. There are also empirical formulas (i.e. BPA and Anneberg) while formulas from EPRI and CISPR permit direct calculation of the RI L50 level of DC lines in fair weather. While DC corona loss is larger in rain than in fair weather, this increase is much less than for AC lines. Fair weather CL should be confirmed when evaluating the feasibility of AC to DC conversion although its magnitude relative to conductor ohmic losses is usually small. There are also empirical formulas for calculating CL in foul and fair weather.
Electric fields for DC lines are different from AC electric fields in regard to effect on the public. Static electric fields produced by DC lines do not produce significant electric fields or currents inside the body that might cause biological effects. The remaining effects of DC electric fields are the ions produced by corona and their charging effects on hair and skin, and the possibly annoying microshocks occurring when touching charged or grounded metallic objects under a line. It is recommended that field intensity as well as ion current density be limited at ground level since the perception of electric field depends on a combination of the two. In order to avoid adverse effects from the electric field and ions, some utilities are applying electric field limits of 25 to 40 kV/m under a line, sometimes combined with an ion current density limit of 100 nA/m². It should be noted that DC electric fields and ion currents at ground level depend on conductor sag as well as on climatic conditions such as wind. Therefore, the probability of exceeding certain levels should be considered for any limits imposed. Ground-level electric field and ion current density under DC transmission lines depend primarily on the operating voltage, conductor bundle configuration and minimum height of the conductors (conductor sag). Any restriction on DC voltage from the point of view of electric field effects can be estimated using any of several existing methods.
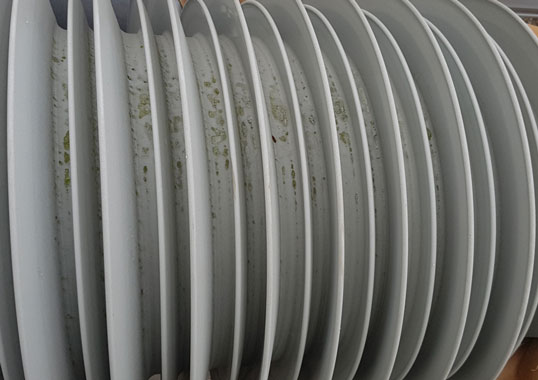
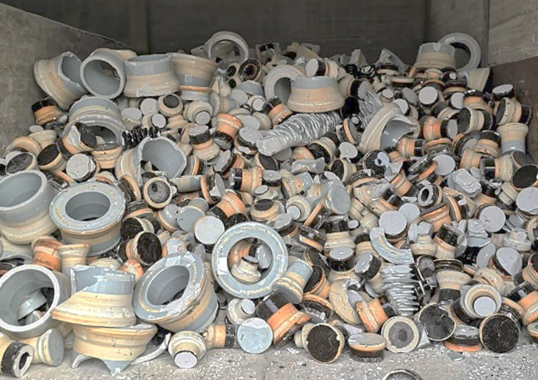
DC Insulator Dimensioning
Typical AC glass or porcelain cap & pin insulators cannot be used for long-term DC operation due to issues of corrosion and ion migration. When replaced by composite or special DC glass insulators, it is important to consider that sensitivity to pollution is more pronounced under DC compared to AC. A statistical method for insulator dimensioning is typically applied to make optimal use of the space available for new DC insulators.
Required Insulator Length
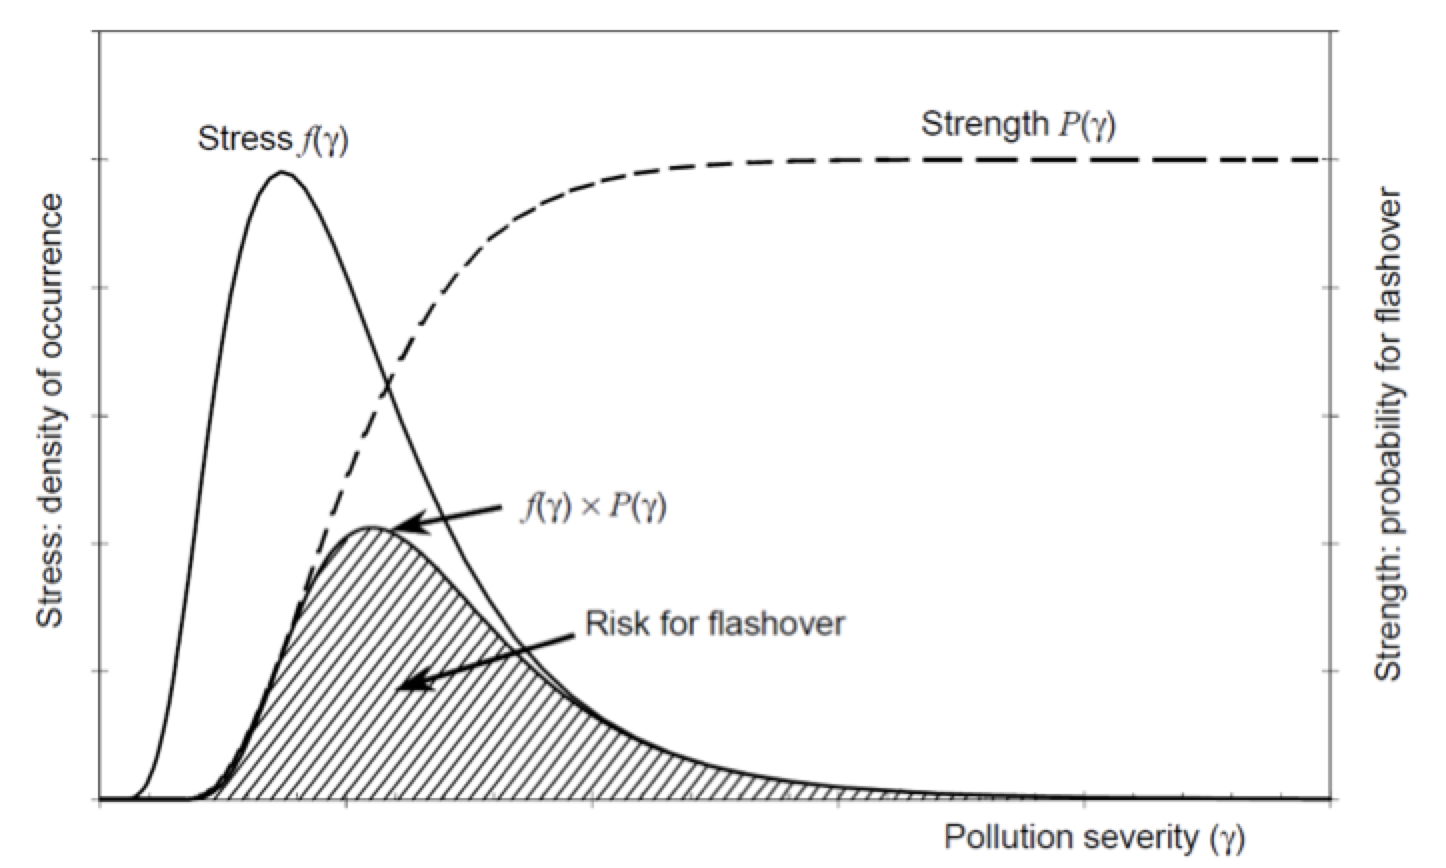
This process entails selection of dielectric strength of an insulator with respect to voltage and environmental stresses (stress/strength concept) in order to fulfil a specific availability requirement. This is done by evaluating risk of flashover of the various insulation options and selecting those yielding acceptable performance. In this context, insulator performance is typically quantified in terms of Mean Time Between Flashover (MTBF).
CLICK TO ENLARGE
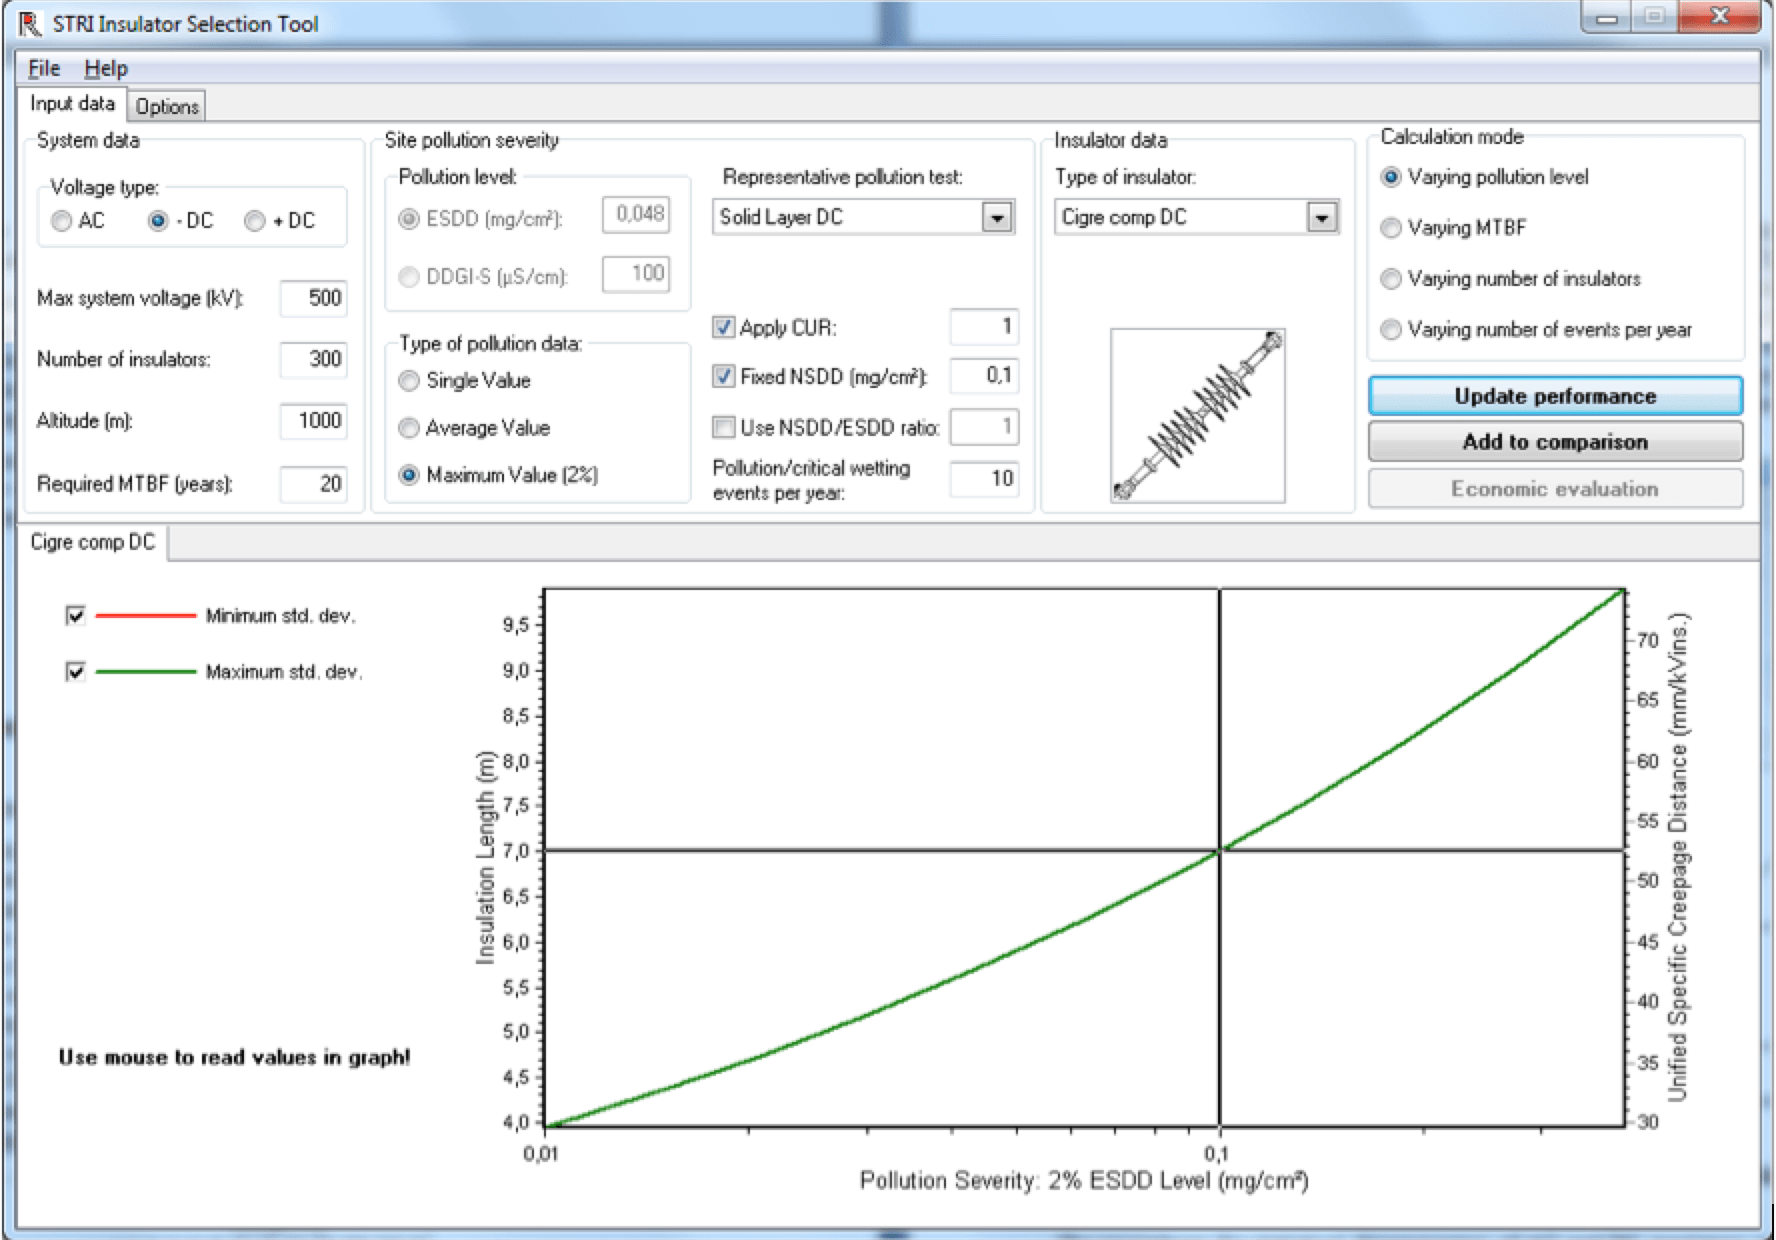
Practically, statistical dimensioning of insulators with respect to pollution can be performed by means of dedicated software such as the Insulator Selection Tool (IST). This program allows users to calculate e.g. required insulator length to obtain a given MTBF as a function of pollution level (see Fig. 2). Site severity distributions are normally characterized by 2% values of ESDD/NSDD distributions, while flashover strength of any specific type of insulator is derived from laboratory test results. The calculations take into account number of parallel insulators and number of pollution events.
Procedures for statistical dimensioning of AC and DC insulators are identical, however inputs are different since there is a difference in pollution catch between insulators energized by AC and DC voltage due to electrostatic charging. This effect can have a large impact on Site Pollution Severity (SPS), especially in areas of low wind. For coastal areas where pollution accumulates rather quickly and is deposited by strong winds, influence of electrostatic charging is lower. There is a procedure for estimating DC ESDD based on AC ESDD. Due to the fact that the normally hydrophobic properties of a composite insulator surface are intentionally suppressed during testing, results represent a ‘worst case scenario’. Nevertheless, it has be kept in mind that the pollution performance curve does not represent any specific or typical insulator profile. It is therefore highly recommended to verify the pollution performance of whatever DC insulators are selected by representative laboratory tests for the specific service conditions before final decisions are taken.
CLICK TO ENLARGE
Required Clearance to Ground
Maximum attainable power transfer capacity of a converted OHL is given by two factors: maximum DC voltage and maximum conductor current. Maximum voltage is limited by corona and field effects and also by the required insulator length with regard to pollution performance. Maximum current, on the other hand, is limited by maximum allowed conductor temperature or maximum sag with respect to required ground clearance. Required conductor clearance to ground is further determined by the arcing distance of the insulators. Consequently, required insulator length and required clearance to ground are interrelated via DC voltage level.
Maximum Power Capacity
Maximum power capacity is determined by the recommended limits of corona and field effects as well as by requirements on insulator length and clearance to ground. Due to the coupling between required insulator length and required clearance to ground, maximum power capacity is found by applying a set of selected DC voltage levels in a step-by-step procedure comprising:
• Calculation of required insulation length based on pollution performance requirements;
• Determination of required clearance to ground based on the insulator arcing distance;
• Determination of maximum conductor temperature as limited by allowable conductor sag or other restrictions;
• Calculation of maximum power capacity for the selected DC voltage level.