While all bushing technologies applied these days are characterized by very high operational reliability, there is now a trend toward greater awareness of their safety aspects. The result has been a greater focus within the industry on advancing dry technology to further improve its service reliability.
This edited 2022 contribution to INMR by Laura De Fina and colleagues at GE Grid Solutions in Italy describes research and testing carried out to verify dry RIP bushing reliability as well as to assess various design criteria to assure long service life

Technologies & Trends
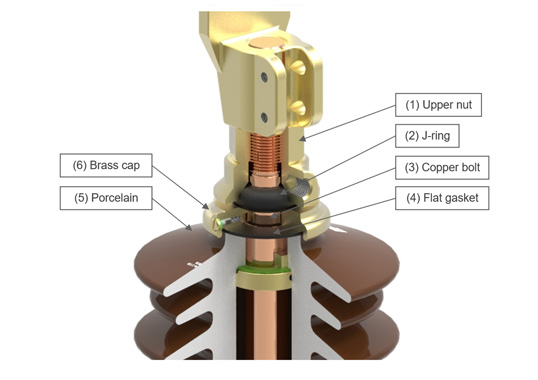
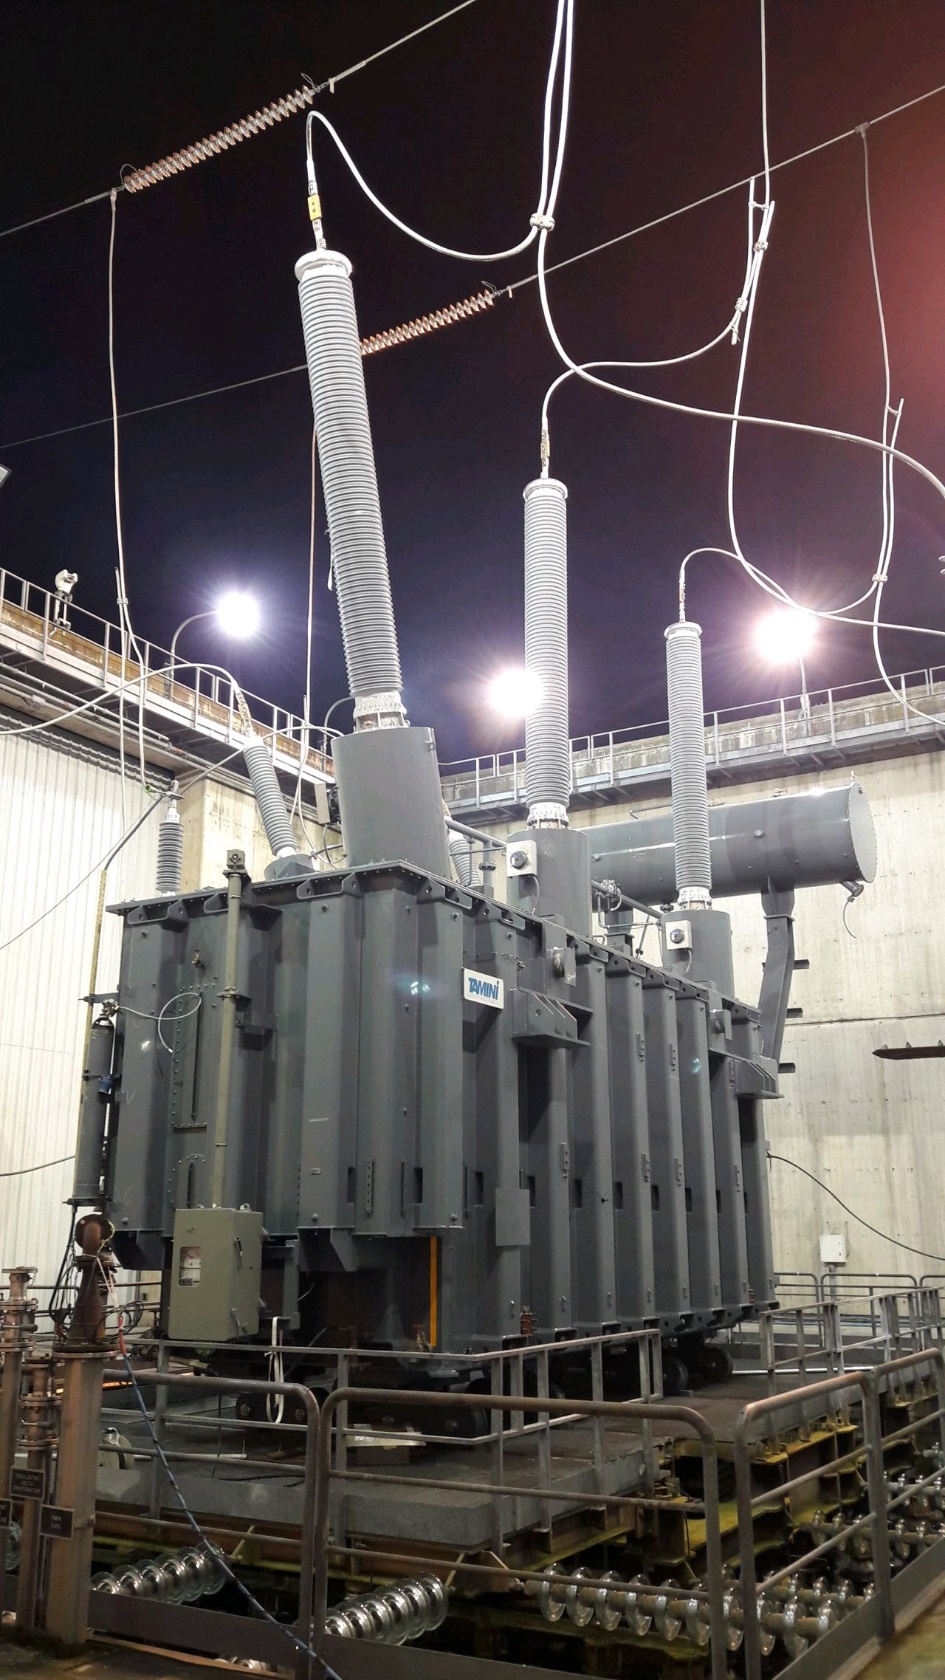
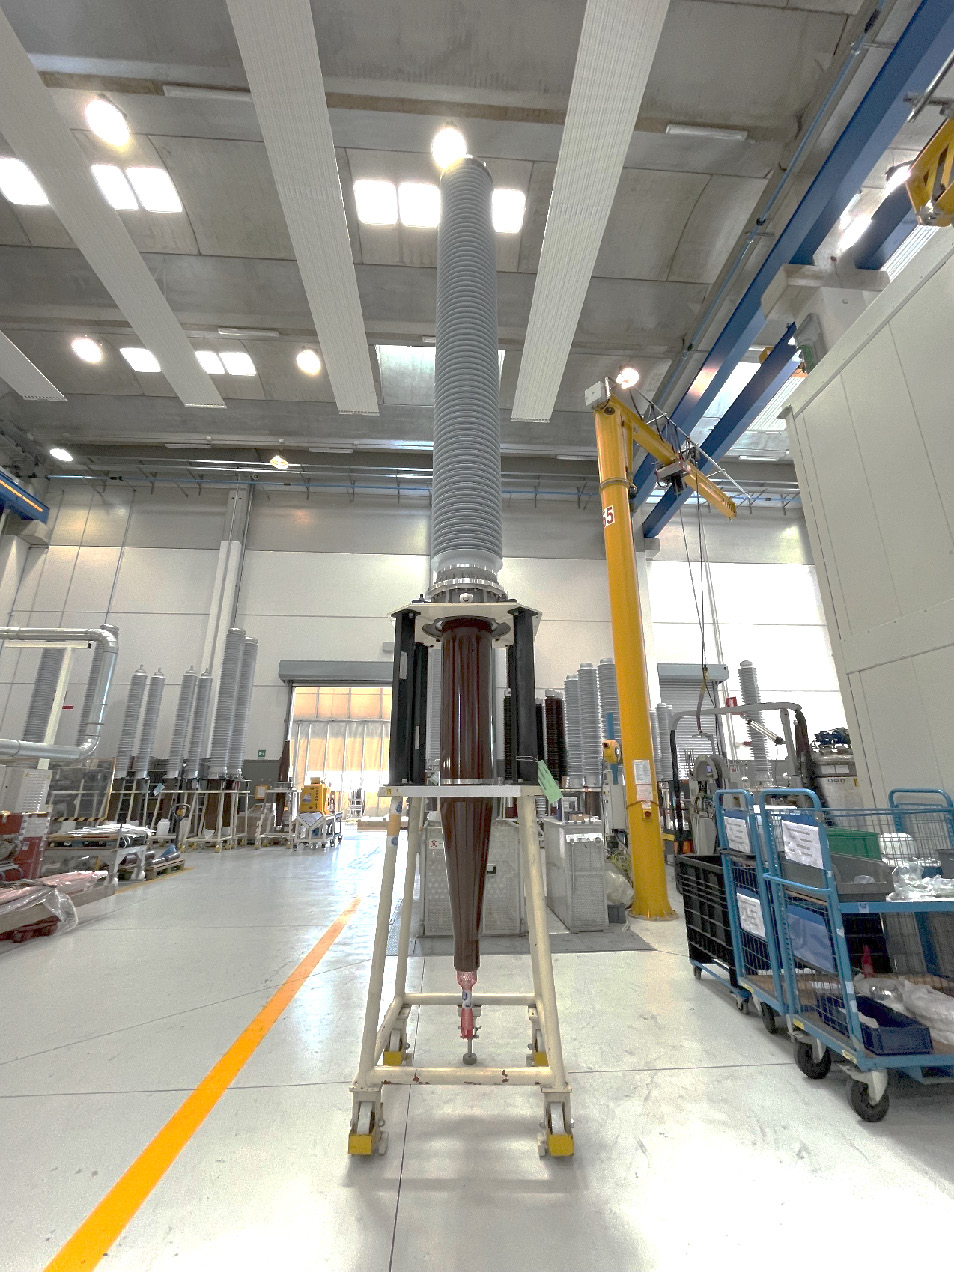
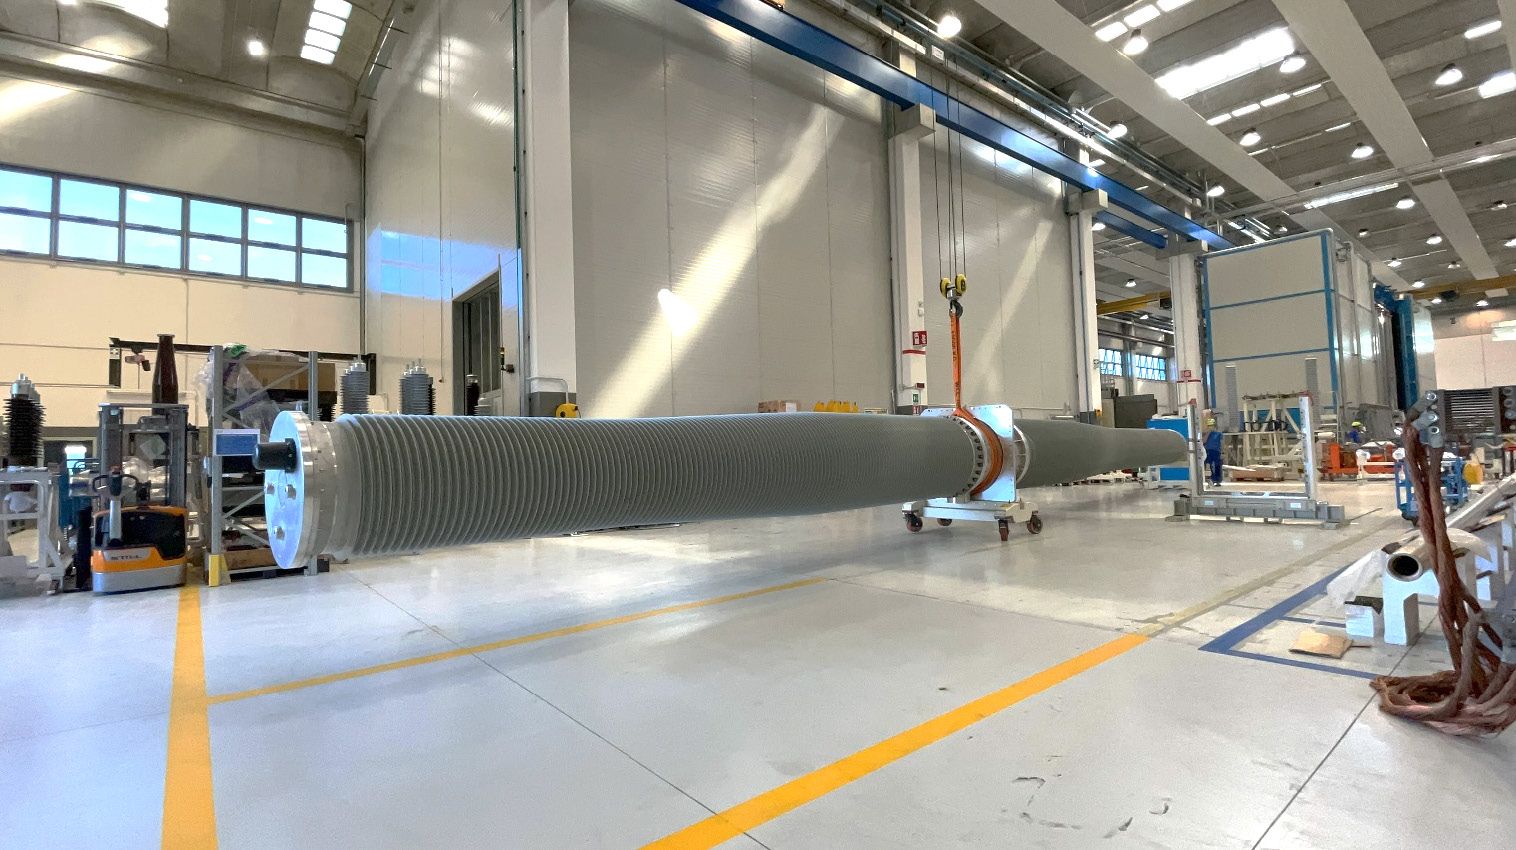
Bushings are devices that enable one or more conductors to pass through an earthed partition, such as a wall or tank, and insulating the conductors from this. In the most common application, the tank is that of HV power transformer. Although not among the costliest of its components, bushings nonetheless have an important influence on a transformer’s service reliability.
The characteristics required of a bushing to perform efficiently in service are:
• good thermal dissipation behavior to avoid overheating and preventing ageing phenomena during normal operation and in situations of overload. In addition, the conductor must have a proper design to also meet the thermal short time current that can be superimposed on continuous operation at rated current;
• reliable internal and external electrical insulation under rated voltage and service overvoltage, under all environmental conditions and especially under pollution;
• adequate mechanical strength, taking into proper account conductor and external connection to short circuit forces, seismic events, wind and ice.
The main bushing technologies in regard to their internal insulation include: oil-impregnated paper (OIP); resin-impregnated paper (RIP); resin-impregnated synthetic (RIS); and SF6. Each offers advantages but also comes with certain disadvantages.
OIP technology, for example, consists of a condenser core wound using kraft paper and subsequently treated and impregnated with oil. This offers very good heat exchange due to the thermal properties of oil as well as the possibility to have oil circulation cool the conductor. Moreover, analysis of dissolved gases is an established diagnostic tool for this technology to allow any necessary preventive maintenance. On the other hand, OIP bushings have an insulation class A up to 105°C, which is lower than that of RIP and RIS bushings.
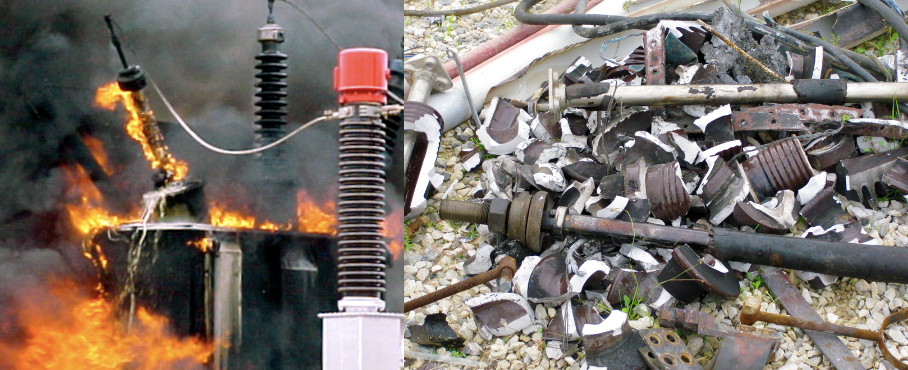
The OIP solution has the longest service experience and is still the most widely used worldwide. Still, its main disadvantage comes from the safety and environmental points of view since, even if rare, there remains a risk of possible leakage and flammability in the event of accidents. Furthermore, since porcelain is still used in most OIP applications, explosion of the housing could occur following an internal fault, with risk that dangerous shards are projected toward people and nearby equipment. This risk is prevented when composite insulators are used as the bushing housing. Indeed, the key motivations behind a transition to silicone composite housings in place of porcelain has been the reduced risk to personnel and other apparatus, better pollution performance and easier handling because of reduced weight.
RIP and RIS bushing technologies offer higher mechanical stability compared to OIP bushings. While their heat exchange behavior is less proficient than oil-impregnated paper bushings, this is compensated for by the possibility to operate them at higher temperatures because of their different thermal insulation class E, i.e. up to 120°C. Additional advantages of RIP and RIS are non-flammable materials and lower risk from the explosion point of view, thereby allowing use of either ceramic or composite housings. However, composite housings are now more commonly used because of their hydro-repellent silicone material which allows improved pollution performance.
A disadvantage of RIP & RIS technologies is their presently higher cost. Dry technology is in general more expensive than an OIP solution with the extent of the price increase depending on voltage range.
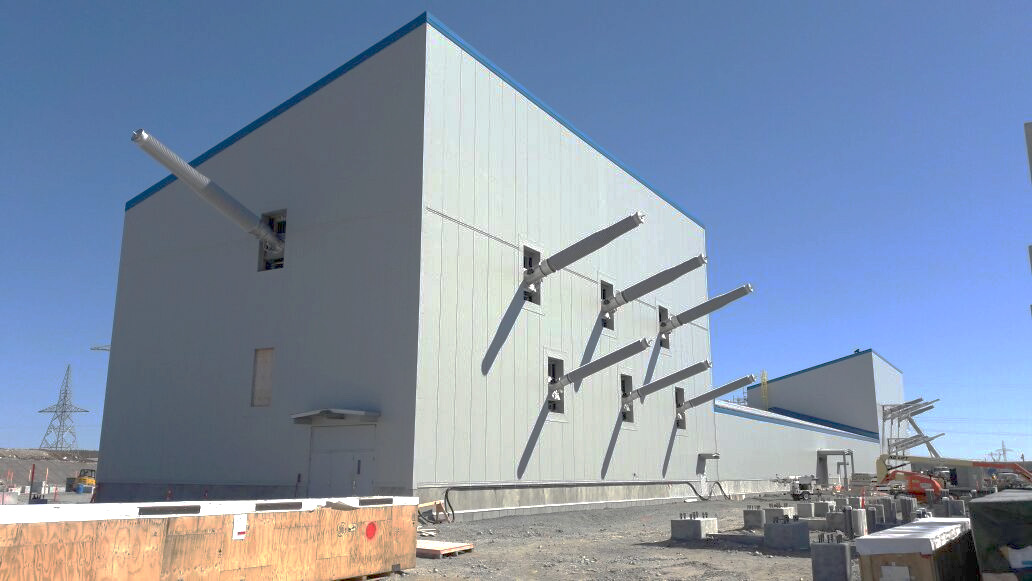
Traditional gas bushing technology uses sulfur hexafluoride as the internal insulation medium and is widely used for bushings installed in GIS, GIL, dead-tank circuit breakers as well as in DC applications for transformers and trough wall-bushings. In converter transformer bushings, the SF6 is used in combination with RIP to provide a reliable hybrid solution up to 530 kV that can also reduce the space required in a valve hall. Application of SF6 technology for wall bushings can used to the highest voltage levels.
According to recently published market research, the global transformer bushings market is forecast to experience strong growth during the period between 2020 and 2030. Key drivers contributing to the growth will be:
• grid transition and interconnection with renewable energy;
• rapid urbanization activities;
• increasing industrialization in various economies.
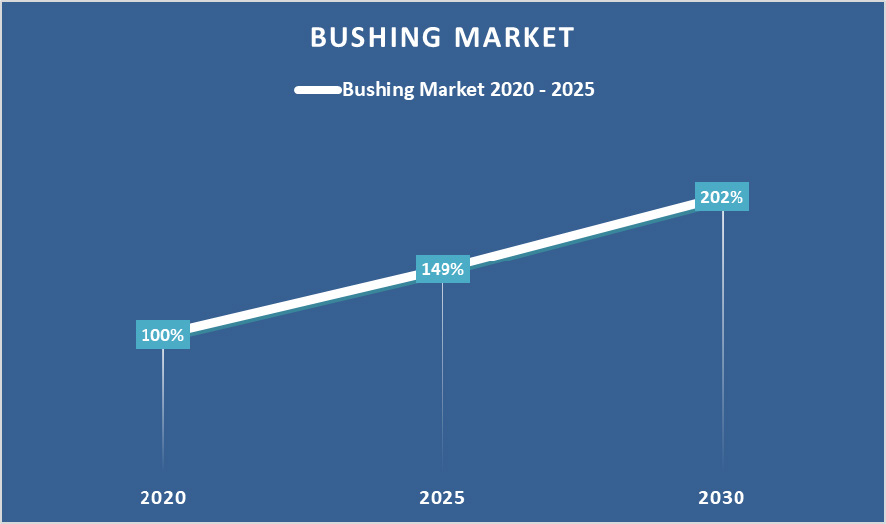
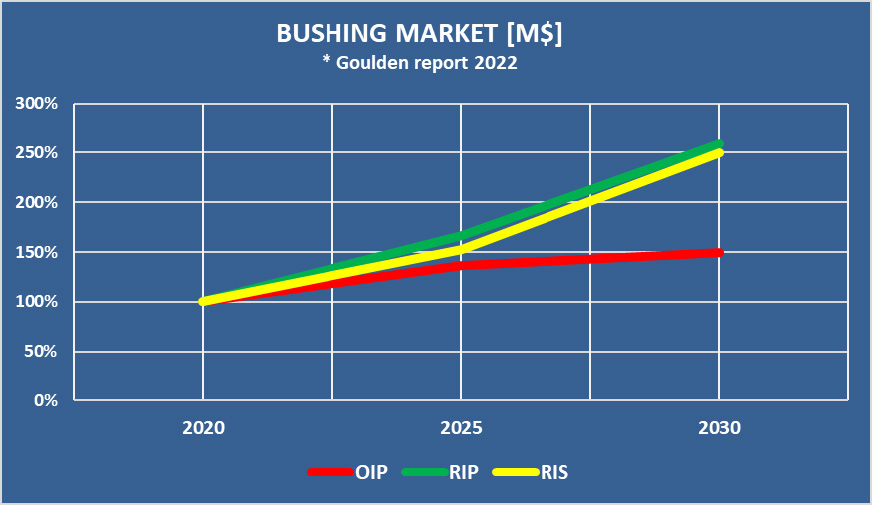
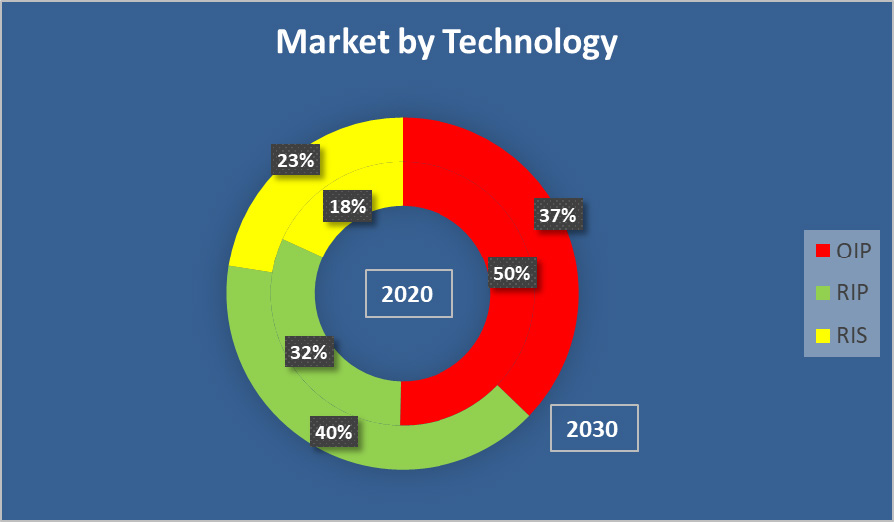
In regard to alternative bushing technologies, the general market trend is shown in Figs. 9 and 10. Estimated growth of RIP and RIS technologies will be higher than for the OIP solution and this will require increasing R&D to assure reliable dry solutions, possibly reducing cost as well.

Bushing Reliability
Bushings are a crucial component for transformers. Although their share of total transformer cost is in the range of 3 to 5%, they are among the most frequent cause of transformer failures. In fact, bushing failure during service could lead to transformer failure. For this reason, bushing test levels prescribed by most relevant standards are higher than for the transformers.
Bushings are designed to support high as well as low temperatures, mechanical static and dynamic loads or some combination of these, overvoltages and harsh service environments with adverse conditions (e.g. heavy contamination). As such, bushings design must consider the following stresses:
• Thermal
• Electrical
• Mechanical
• Chemical & various contaminants
Moreover, these stresses have to be considered non-independent since synergy among them is also a possibility. As such, R&D activities to improve dry bushing design and reliability need to cover the following aspects:
• Internal insulation design;
• External insulation design;
• Mechanical design.
Internal Insulation Design & Tests
Dry type condenser bushings are produced by wrapping paper (or synthetic material) on a central tube or conductor as thin metal foil electrodes of certain lengths are inserted to grade radial and axial voltage stress so as not to exceed design limits.
To assess reliability of electrical insulating materials subjected to service voltage stress, accelerated ageing tests were performed on RIP specimens under multiple stresses, including thermal and electrical in order to represent service conditions. One approach to accelerate the ageing process is by increasing the frequency of the applied voltage. Similarly, ageing of DC RIP bushings has been evaluated through a DC voltage endurance test to assess reliability for DC applications. Accelerated ageing tests were conducted to verify reliability of RIP insulation by applying increased stresses for sufficient time duration to represent bushing stress over its service life. The samples were submitted to these selected stresses up to discharge or alternatively for a time comparable to the required equivalent life.
To evaluate the samples behavior the following condition have been applied:
• oven with controlled temperature at 90°C
• three different voltage/electrical gradient levels (kV) increased compared with design criteria
a) |E1_test|=140 % |Eradial|max design
b) |E2_test|=175 % |Eradial|max design
c) |E3_test|=230 % |Eradial|max design
The temperature of 90°C has been selected as a temperature that the insulation can experience in service as a maximum average.
To reduce test time and accelerating the aging, the frequency of the applied voltage has been increased from 50 Hz to 5 kHz, assuming the following relation between the life at power frequency f, Lf and the life Lh, at the test frequency, fh:
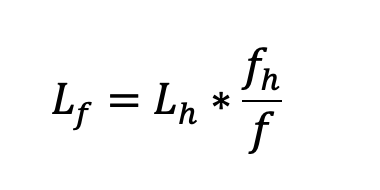
For RIP specimens under test, being the service frequency 50 Hz, and the test frequency 5000 Hz, the time to failure is estimated 100 times the test times.
The not failed aged samples, have been then tested at lightning voltages (1.2/50 s) to define the decrease of the sample performance following ageing.
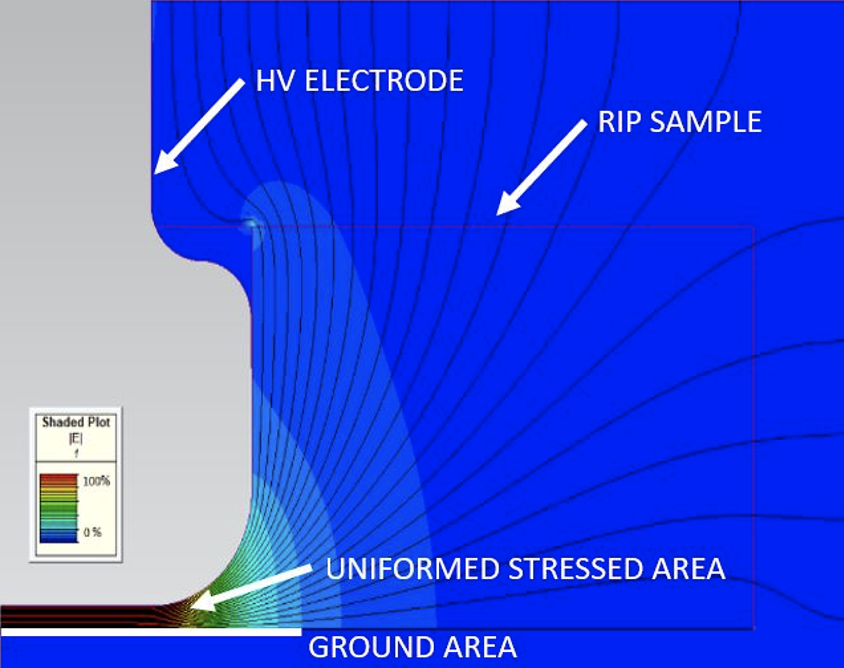
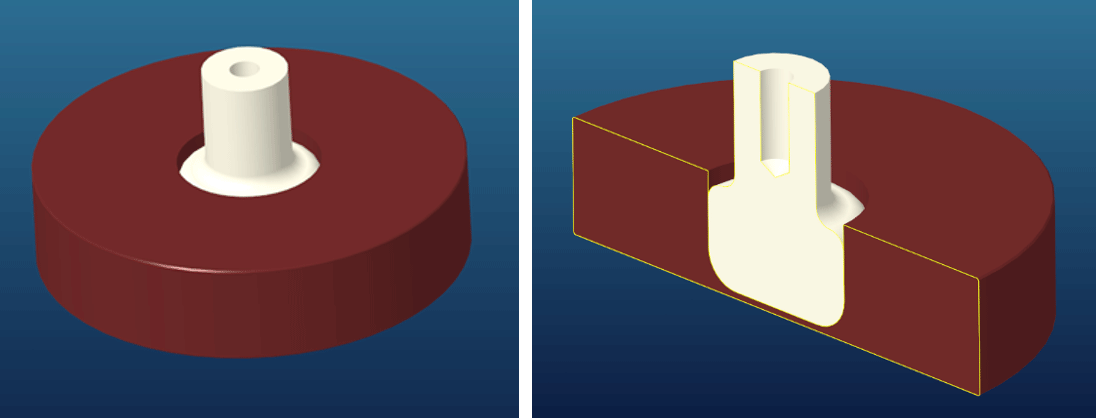
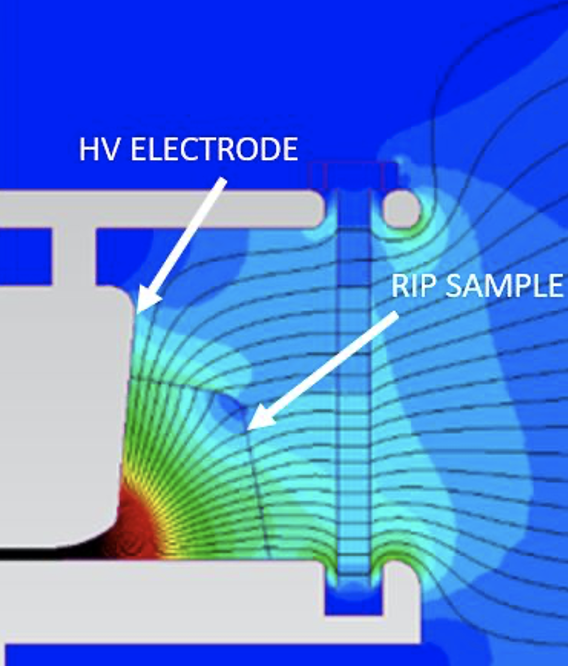
In regard to methodology, RIP specimens have been manufactured from RIP material used for GE standard production: they have been machined in such a shape for having a central uniform stress area. The RIP thickness in the uniform stress area is the average thickness between two conductive layers in the bushing condenser core. Several finite element analyses have been carried out to fine tune the electrode and sample profiles (Fig. 10).
The external surfaces of the uniform stress area have been metallized with a graphite paint to allow good electrical contact with the HV and ground electrodes with minimum risks of surface discharges. To avoid partial discharge activities also inside the oven compartment, the HV electrodes are rounded on the air side and toward the specimens, as shown in Figs. 12 & 13.
A distribution line has been built for the test, to supply test voltage to up to five specimens in parallel inside the oven through a PET “bushing” with air shields on both sides, inside the oven and outside (Fig. 14).
A set of wires has been put in place to connect the bushing terminals to specimens’ air side electrodes. During the whole test, oven temperature has been set at 90°C while voltage and frequency on the specimens constantly monitored. Moreover, a system for measuring partial discharge has been used to record in advance any insulation aging signs. The measuring system is connected to the ground electrodes of the specimens and continuously measuring and recording the discharges, at same time a circuit board records the voltage measurements.
As results and conclusion, for all voltage levels the tests have been stopped at 5000 hours, which corresponds to 57 years of service, according to the assumptions above. No partial discharge activities have been measured on specimens without defects. Concerning the three-voltage level and samples:
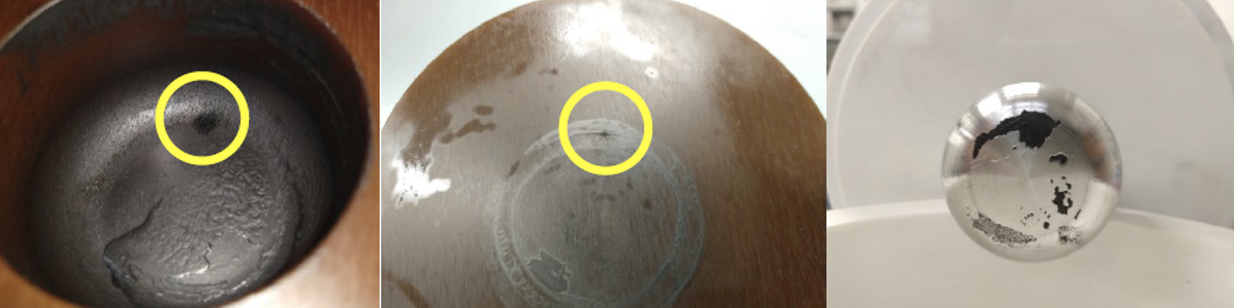
• At |E1_test|=140 % |Eradial|max, two out of five samples tested failed due to metallization process issues at the initial stage of the test, and they have not been considered.
• At |E2_test|=175 % |Eradial|max, one out of five failed just after energization due to material defect.
• At |E3_test|=230 % |Eradial|max one out of five failed effectively due to material aging after an equivalent time of more than 36 service years.
No failure was observed on samples without defects with voltage stress up to 175% of the service stress for an equivalent service life duration of 57 years, much bigger than the average required for bushing life (30 to 40 years), confirming the conservativeness of the actual design criteria.
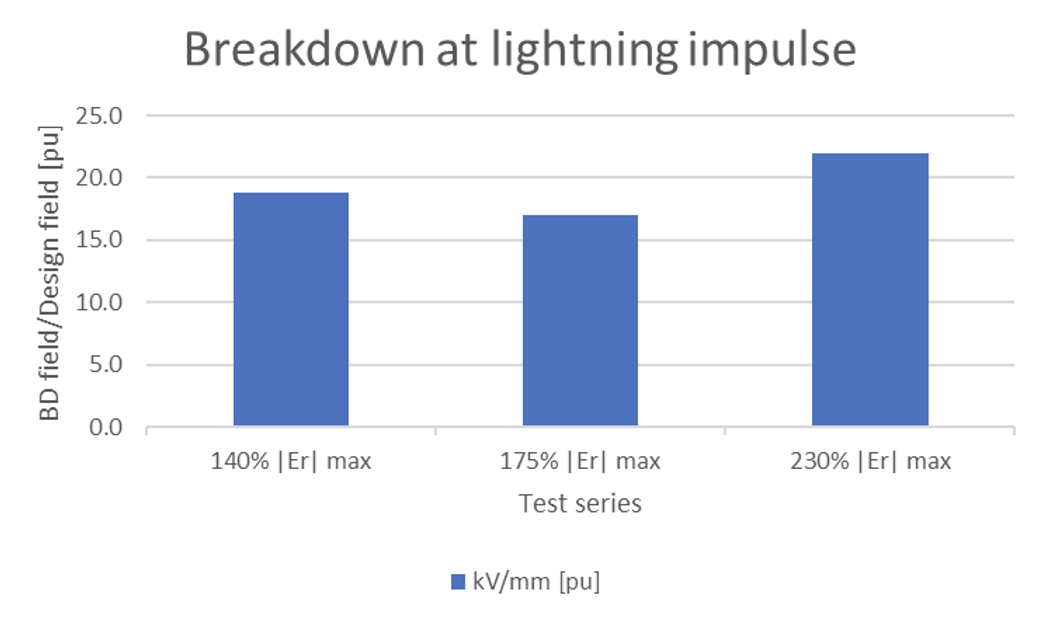
Lightning breakdown tests have been performed on aged specimens after the accelerate life tests as per [3]. A series of sets of three waves of equal peak voltages have been applied starting from 110 kVpk and increasing by steps of 5 kVpk. The breakdown voltage values (BD) show that there is not a significant difference among specimens aged at different stress values, as shown in Fig. 17.

DC Voltage Endurance Testing on RIP Samples
To have a proper material characterization for DC application, a DC voltage endurance tests on epoxy impregnated paper material have been performed at 90°C to consider multiple stresses: electrical and thermal.
As for AC life tests, the temperatures of 90°C has been selected as the maximum average temperature that the insulation can experience in service.
Tests have been performed at Super Grid Institute in Villeurbanne France.
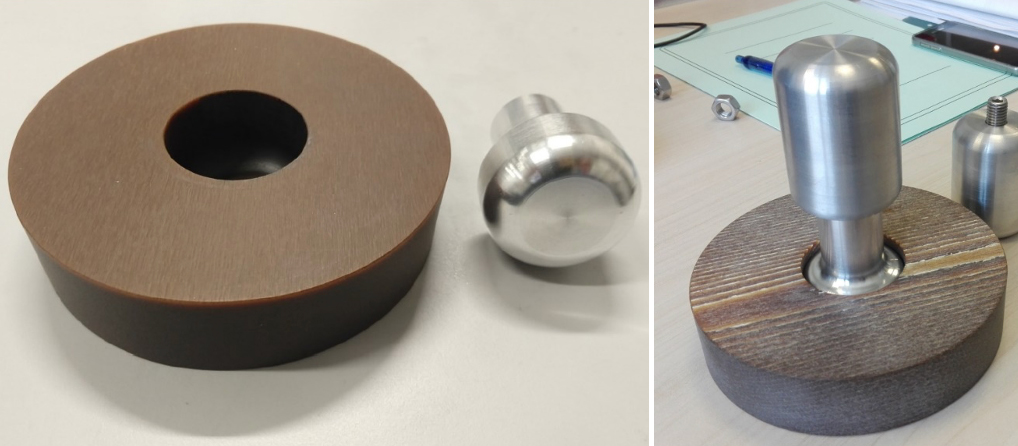
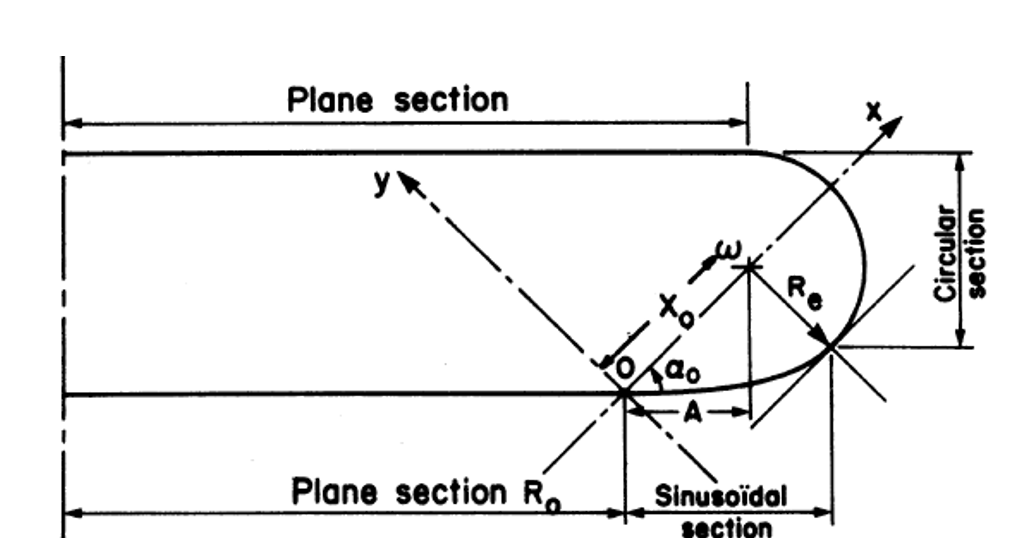
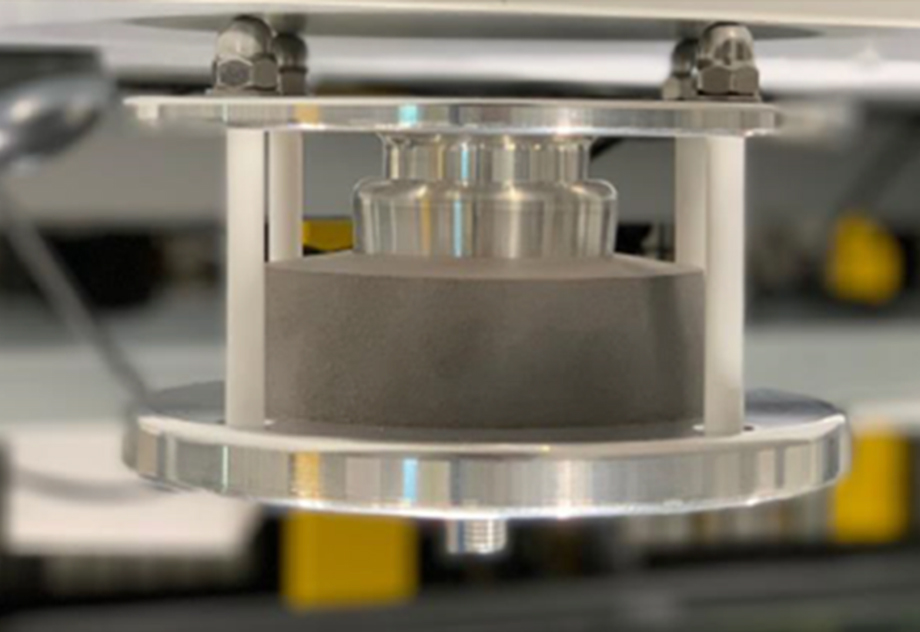
As in tests described before, RIP specimens have been machined from RIP material in such a shape to have a uniform stress area and to minimize the possibility to have surface discharges. The sample surfaces in contact with electrodes have been metallized to allow a good electrical contact between electrodes and sample surfaces. Test specimens and electrodes have a Bruce profile type, to minimize field increase at borders.
The Bruce profile electrode is composed of three sections, a linear section of radius R0, followed by a sinusoidal section extending over a radial distance of A and terminated by a circular section. It allows to have negligible border effect and nearly constant uniform field region. The effective area of uniform fields can be bigger with Bruce profile compared to other uniform field profiles.
The tests consist into two parts. In the first one DC breakdown tests, at three different uniform temperatures, as per [1] have been carried out at following temperatures:
1) 90°C
2) 70°C
3) 50°C
As second step, a set of ageing tests at 90°C have been performed at voltage levels defined as percentages of DC breakdown voltage defined during the first test.
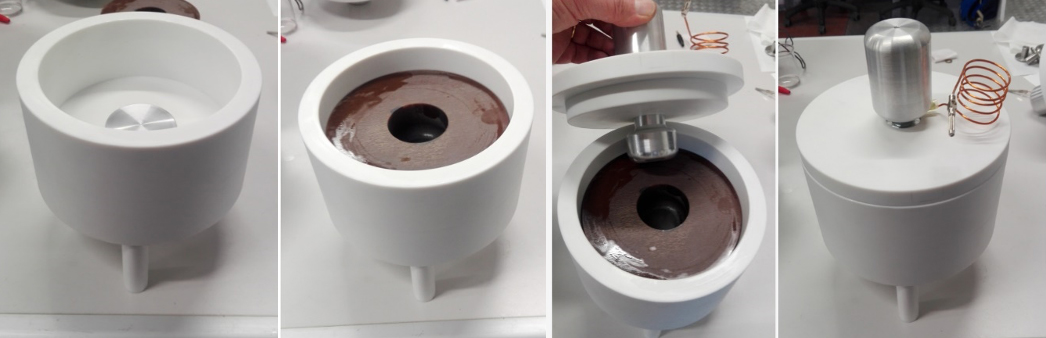
During all the tests, specimens are kept at constant temperature in a dedicated test vessel, using heating resistances placed on the outer surface of the vessel and calibrated for setting the desired temperature values inside.
IEC 60243-2 standard has been followed for test first test to determine the DC breakdown voltage of the samples, using the 60 s step by step method. The 60 s step by step method states that the test shall be applied starting from 40% of probable breakdown voltage and increased by steps, that, for the voltage of the test, have the value of 5 kV. If the test specimen withstands this voltage for 60 s without failure, the voltage shall be increased in incremental steps. Each increased voltage shall be kept for 60 s until failure occurs. The output of first test is an average DC breakdown voltage at 90°C, 70°C and 50°C.
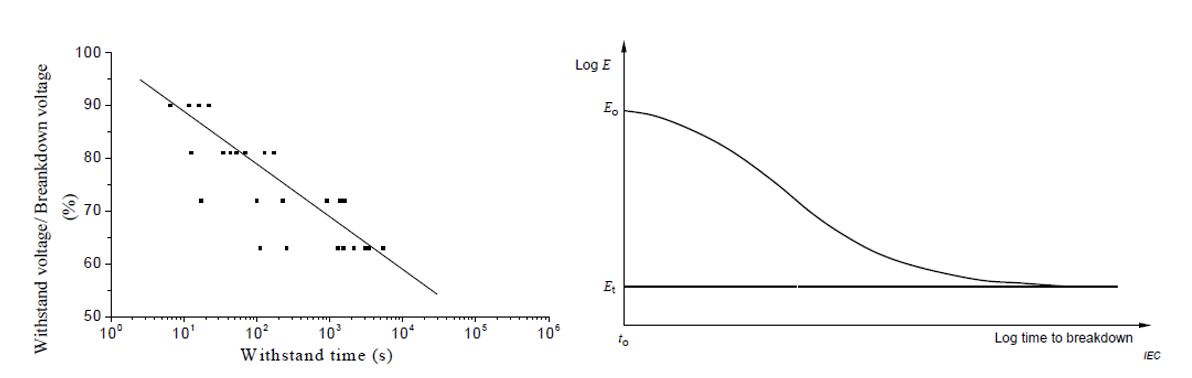
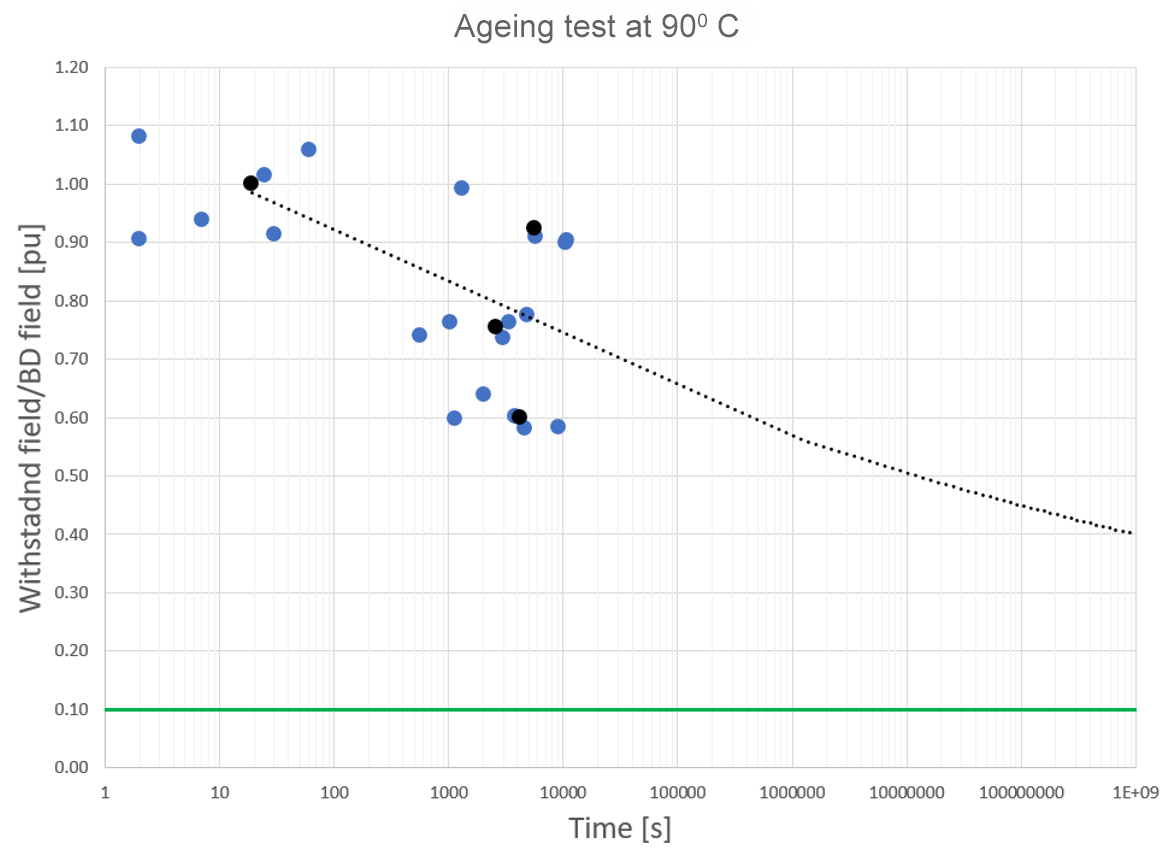
The second part consists in ageing tests. A set of tests have been performed at 90°C. Specimens are kept at constant temperature and constant voltage level up to breakdown. The voltage levels are defined as 90%, 75% and 65% of the short time DC BD Average Voltage. The output of these test is a DC voltage-time (V-t) curve at 90°C as in Fig. 21.
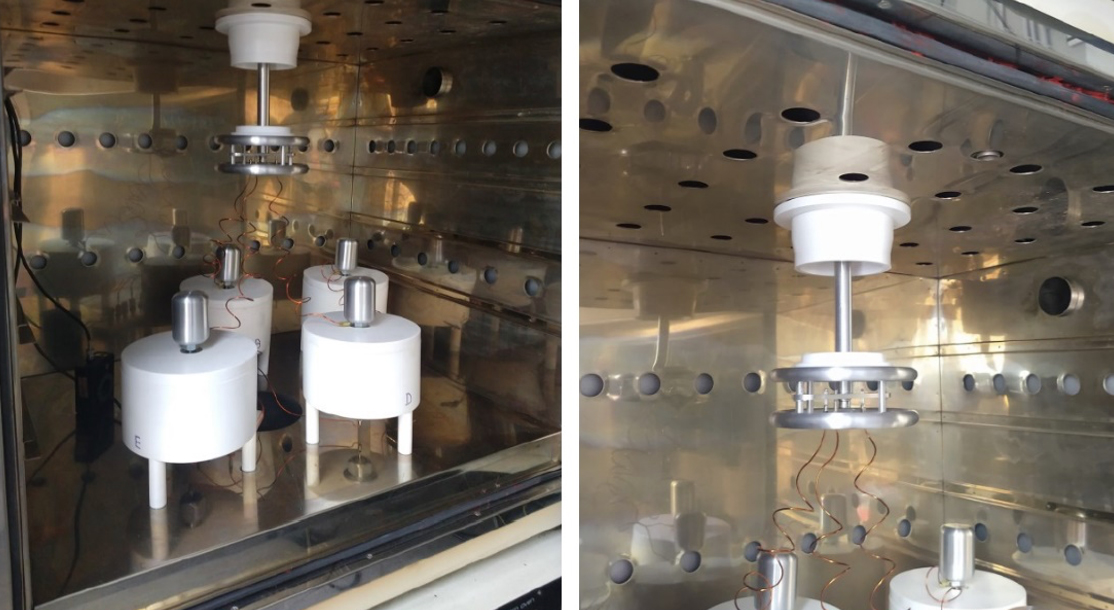
Regarding the set-up, dedicated mock-up for solid material aging has been used to test simultaneously N°5 samples in a gas insulated environment that allows to have pressurized gas (SF6, dry air, etc…) with humidity control and constant temperature. The vessel system allows to disconnect the punctured specimen and going on with the test of the remaining specimens.
Concerning the methodology about the aging tests, the following procedure is foreseen:
1. Samples conditioning at 75°C for 2 days using N2 at 4 bar abs to reduce the humidity content within material bulk and desorbing moisture.
2. Installation of the samples in the test insulated vessel.
3. Application of the aging voltage (90% of the short time DC breakdown voltage) up to breakdown.
4. After each breakdown, the time is recorded, and the voltage re-applied on the remaining samples.
Leakage volume current on each sample is also measured during the whole test duration, to monitor material conductivity evolution with time and have additional information on material deterioration.
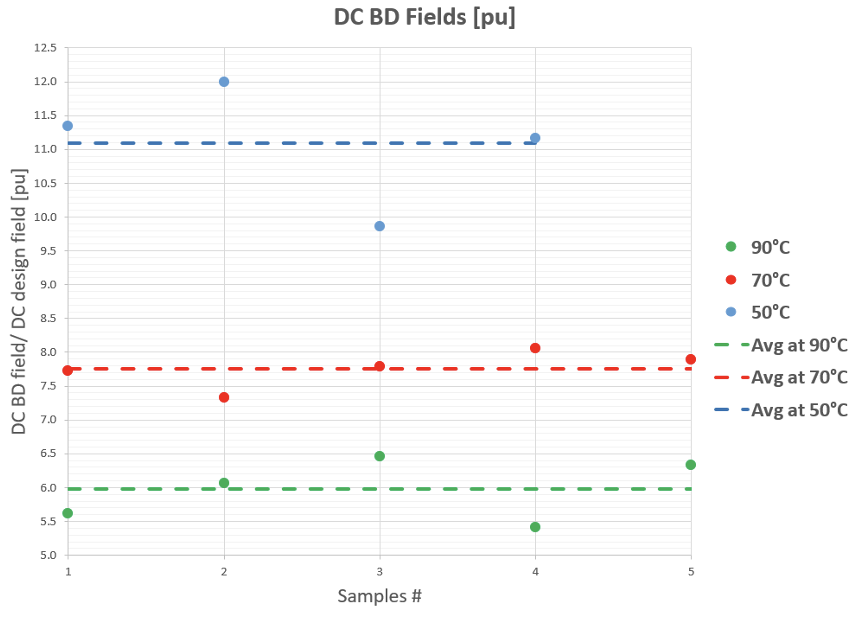
Concerning the results short time DC breakdown voltage tests have been completed. The voltages at breakdown are lower at higher temperatures, as expected. Considering as reference the average breakdown stress at 50°C, the average BD fields per unit are plotted in Fig 23. The increase in temperature almost halves the breakdown field.
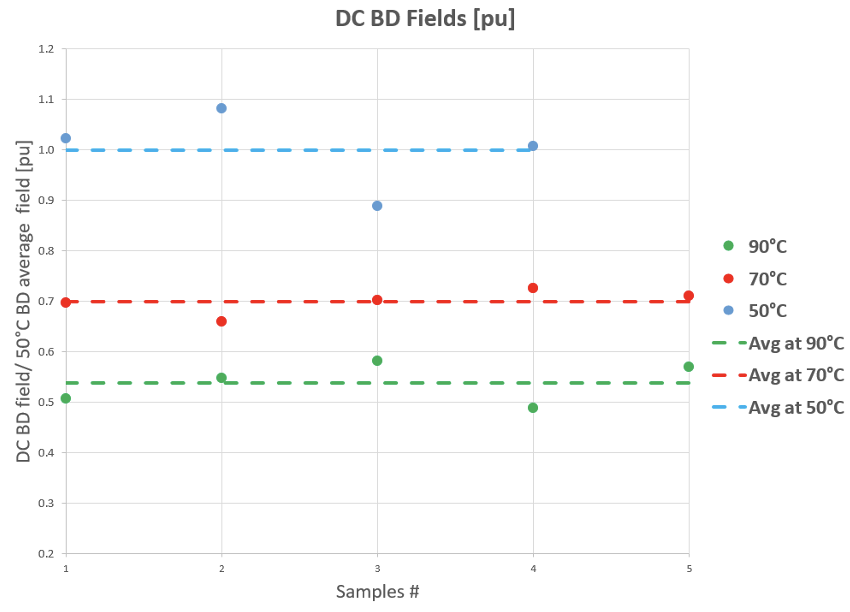
Comparing the results with the average design criteria the safety margin is estimated at each temperature.
Regarding ageing tests, in the figure below the time to breakdown of each tested samples has been plotted versus the ratio between testing voltage and average breakdown voltage. The V-t endurance curve at 90°C that can be built considering the preliminary results of the tests is compared with design voltage, showing that the actual criteria guarantee high reliability for service life.
Partial Discharge Performance of RIP Bushings
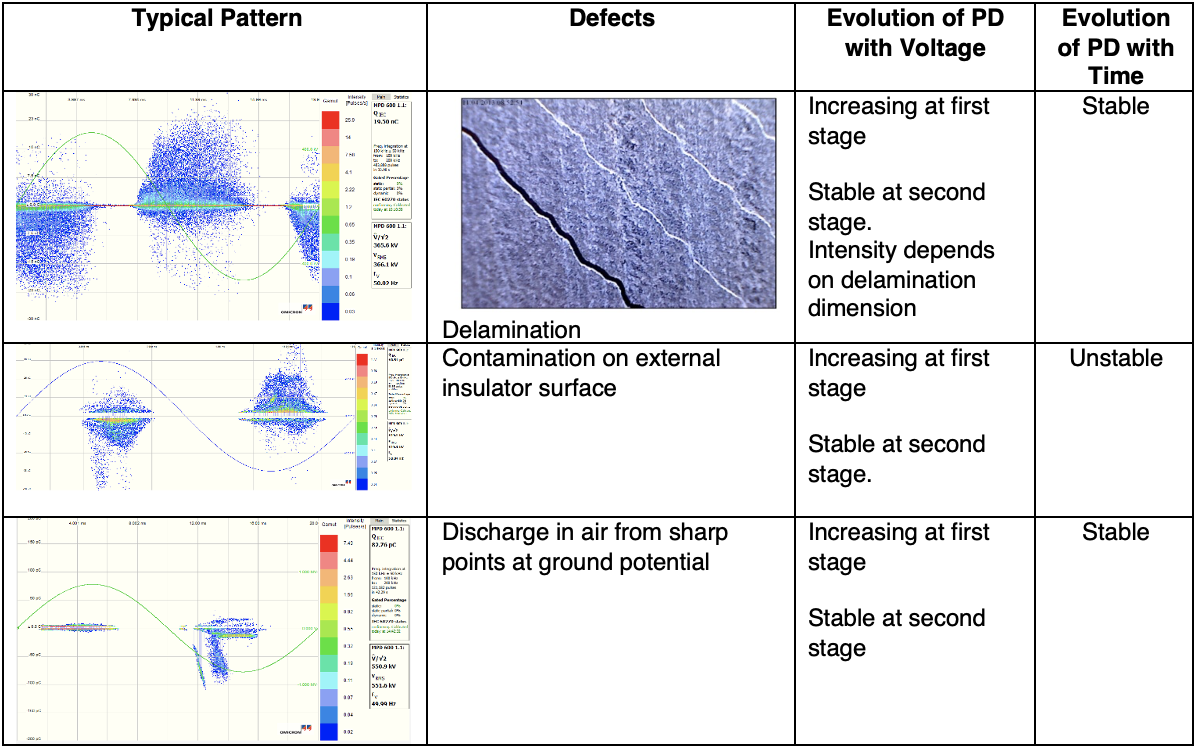
To improve the knowledge of the RIP insulating material, as continuous GE research activity, collecting and analysing activities are in place for identification of typical faults by partial discharges measurements done with conventional method as per IEC 60270. The records about PD patterns permit to identify different typical faults. In literature, there are many works about partial discharge recognition as in [15], but most frequently they are general purpose and not applicable to specific equipment. Phase resolved partial discharge (PRPD) patterns, which visualizes the occurrence of PD activities in reference to the phase of AC voltage allows to classify defects. Based on the classification, it is possible to recognize them. In a PRPD pattern, important parameters are the discharge position in reference to phase angles and discharges magnitude variation with voltage and time. Delamination is a typical defect that can appear in solid insulation. A void can generate a partial discharge activity at the interface between foils and RIP materials. Delamination PD patterns are symmetrical with larger discharge pulses on the positive half-cycle than the negative half-cycle. Other PD patterns, based on GE library, are listed in the table below and refers to contamination on insulator surfaces and discharges in air from sharp point at grounded potential.
This continuous research offers useful support to analyze the bushing defects at FAT and gives also important feedbacks about the process reliability recognizing systematic process deviation.
Special Tests on Dry Type Bushings
Beyond tests on materials, extended DC special tests are performed on dry type bushings, to assess the service reliability considering the polarization effect.
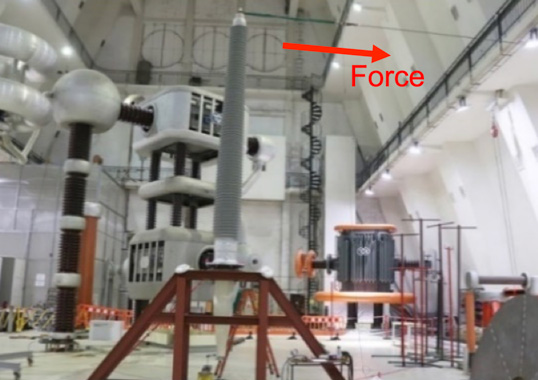
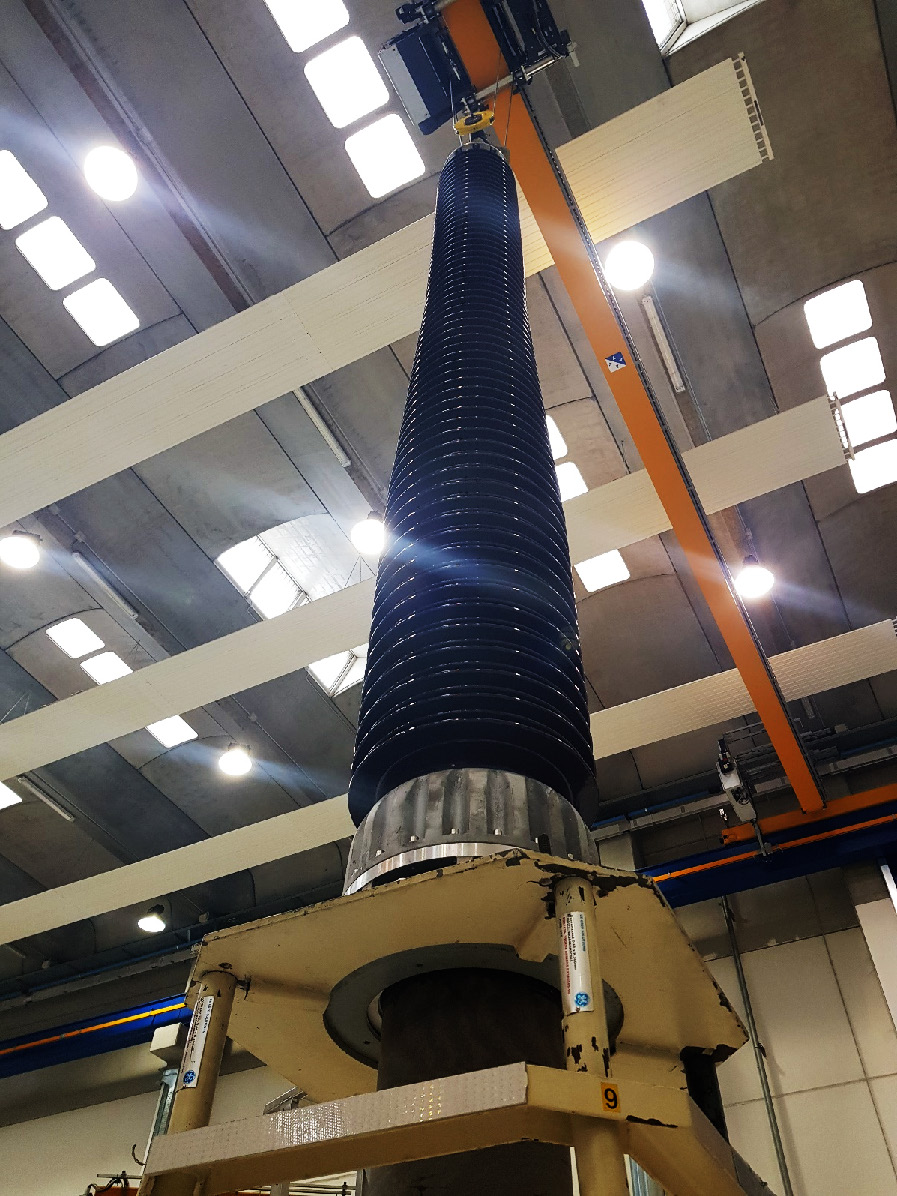
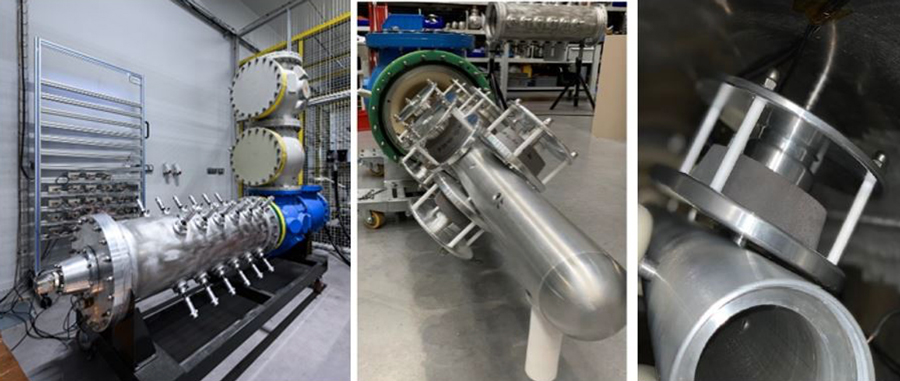
The example shown in Fig. 25 shows a DC RIP bushing, rated with Um at 530 kV, and foreseen for a service voltage of 400 kV. It has been successfully subjected to a 12-hour duration test at 690 kV, which corresponds to 30% more than rated voltage. The bushing was placed inside a turret that houses a barriers system that represents the actual service condition in the HVDC converter transformer. The bushing was tested with continuous PD measurements to detect any abnormal behaviour. After completing the DC extended test, the successfulness of the tests was confirmed by the type tests and AC partial discharge tests performed before and after the long duration test with no change in main parameters.
Mechanical Design Tests
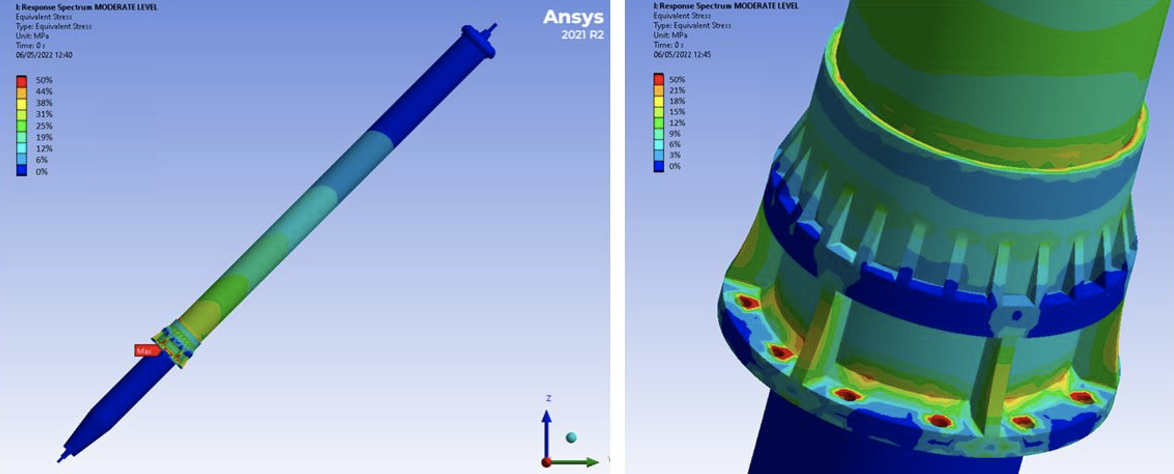
The main aim of mechanical design is to ensure the best service conditions for materials by predicting in advance stress and strain during the bushing cycle life. A proper design must evaluate the stress due to test and service conditions. In this regard the main loads are generally coming from external connections subjected to bending, gravity load because of the mounting angle, earthquakes, and short circuit forces. As preliminary step, advanced numeric analyses are useful for proper schematization of the physical model using different failure criteria and mechanical properties as input for the different materials. The main bushing components are verified for different load conditions, acting at same time, to simulate test and service and suggesting to the designers the best criteria to be adopted. Fig. 26 is shows the ratio between predicted stress of the RIP 550 kV, subjected to seismic test on shake table, and the maximum allowable one according to design rule and material tests.
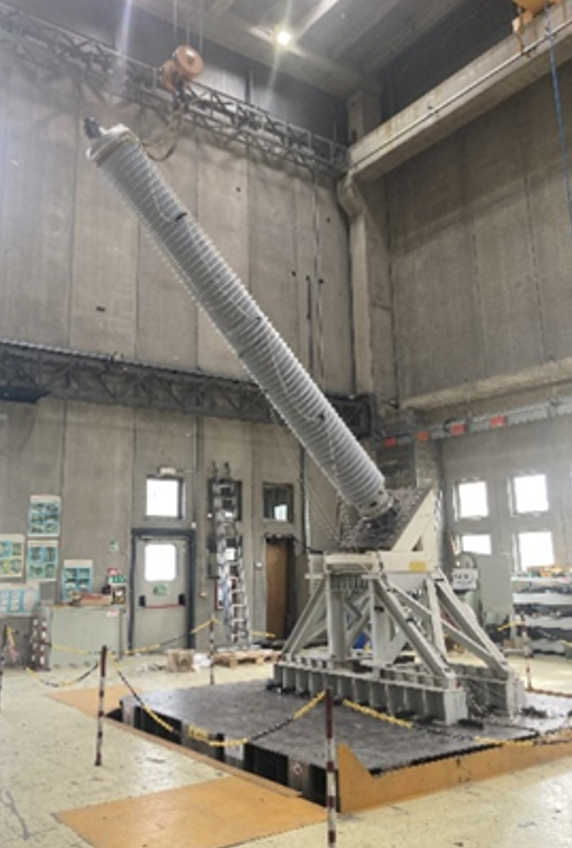
To reach the final product qualification the mechanical type tests are necessary to evaluate the overall bushing performances. The tests recommended by most relevant standards are seismic, for the bushing installed in critical areas where the earthquakes can frequently occur, and cantilever to simulate the stress on the connection and on bushing structure during service. Often the Utilities require type test certificates not older than five or seven years and for this reason a continuous upgrade of products qualification is required to sustain the product portfolio. Focusing on dry bushing technology and seismic aspects, some tests have been carried out at KEMA lab seismic using shake table to validate the RIP bushing classes 245 kV, 362 kV and 550 kV equipped with hollow composite insulators.
In general, the seismic stress has a specific spectrum of frequencies going roughly from 1 to 30 Hz. The maximum peak in frequencies is from 2 to 10 Hz, while for the other frequencies the stress is lower. The critical point for the seismic bushing design is the resonance frequencies can occur within this spectrum, usually at lower range for HV bushings and at the higher for LV ones. To mitigate the seismic effect, at design stage, the numerical analyses are useful to evaluate any reinforcement to be applied on the bushing structure or any improvement in material thickness to change the natural frequencies. For the low voltage bushing it’s relatively easy to modify the vibration mode, instead for high voltage ones it could be complicated and expensive. For this reason, a real test using shake table is very useful to assess the response about materials, subjected to the mechanical stress at same time, and design limit and methodology.
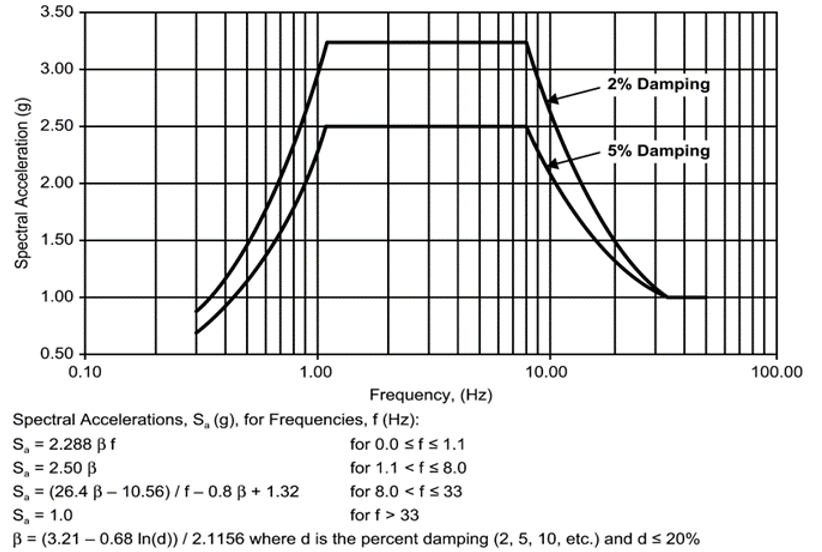
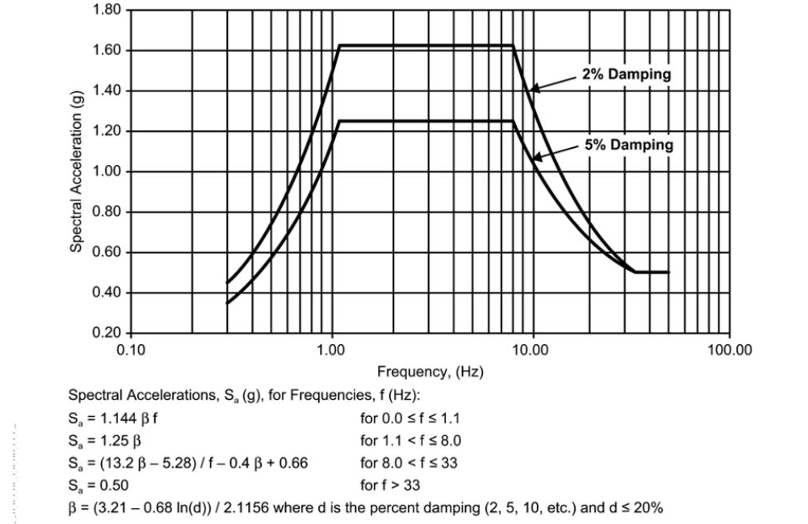
Concerning the setup, the bushings were positioned on a structure that simulates the transformer turret. Through a specifically designed plate, the tested bushings were installed with a mounting angle of 45°, which is in general the maximum required in service for Um ≥ 245 kV. Referring to the reference system in fig. 26, according to IEEE standard, the spectrum in fig 30 is applied for 245 kV and 362 kV classes and the spectrum in fig. 31 is applied for the high voltage class 550 kV. The spectrums are applied along X and Y axes with damping factor at 2%, instead along vertical Z axis the spectrum is applied at 80%.
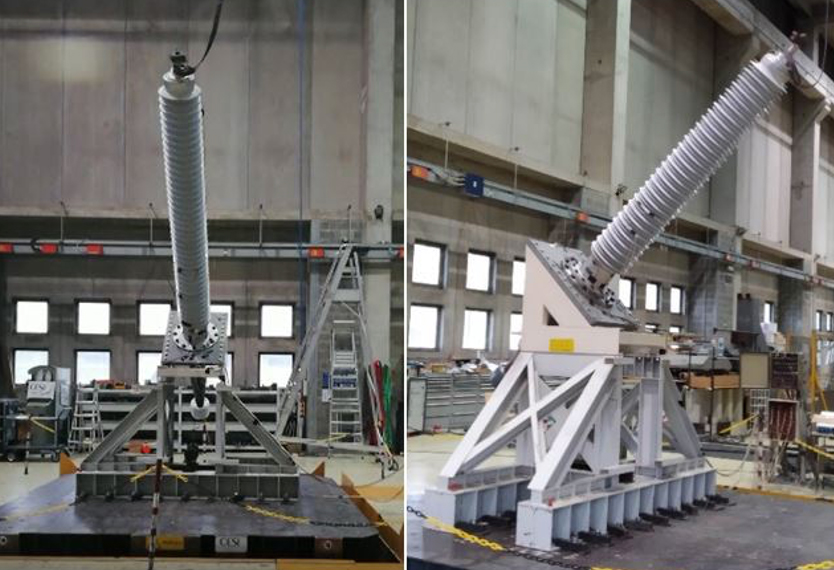
On the top terminal, an additional mass of 7 or 11 kg has been positioned, the value depends on the bushing size in terms of rated voltage. According to IEEE standard 7 kg are required to be added for bushing 145kV ≤ Um ≤ 500kV and 11 kg for Um > 500kV. Instead, the IEC standard requires 7 kg for Um < 420kV and 11 kg for Um ≥ 420kV. Aiming to test the most restrictive conditions, IEC standard has been considered as reference only for additional mass. Before performing the test, each bushing was subjected to routine test in GE UHV testing room. The test objects were also equipped with strain gauges, placed at bottom part of the hollow composite insulator where highest stress and strain are expected. To apply the transducers four 20×30 mm openings were realized cutting the silicone sheds and reaching the fiberglass tube surface as show in fig.29.
Furthermore, four accelerometers were placed as follows:
• A0 on the base, at ground level – reference position placed on shaking table;
• A1 on the terminal at the top of the bushing;
• A2 near the center of gravity;
• A3 on the shield at the bottom of the bushing;
• A4 on the main flange, on top of rigid adaptor near the mounting location.
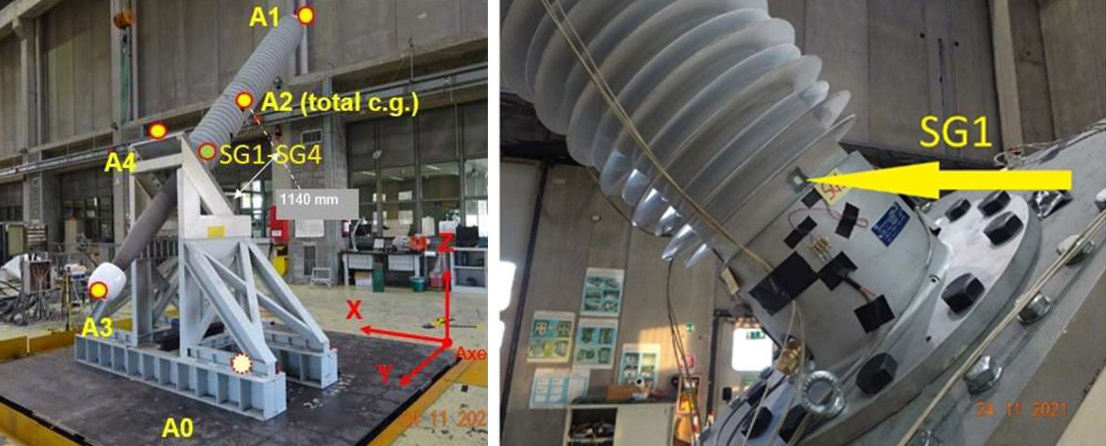
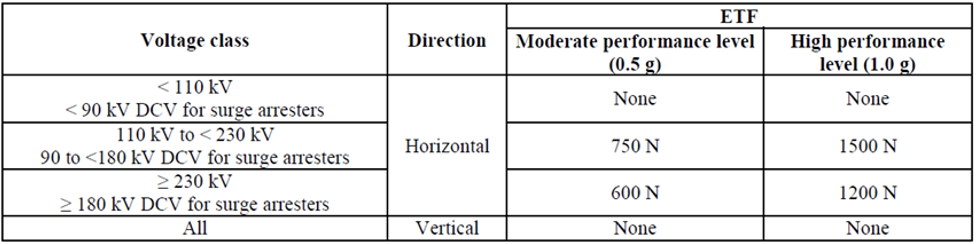
While the bushings were mounted on the shake table according to their class, as shown in Table 2, pre-seismic static pull tests have been executed by applying a 600 or 1200 N force at the top terminal. This procedure is necessary to calibrate the strain gauges for test limit based on the bending type test result carried out on hollow composite itself.
To measure the vibration modes a pre-test has then been performed by imposing an input sine sweep at 0.07g in the main three directions (X, Y, Z) with frequency scanning for resonances research. Those values are usually useful to validate the input used for preliminary finite element analyses. Before starting with the final test at 2.00g, for 245 kV and 362 kV, several steps have been completed: triaxial time history shake table tests for calibration and instrumentation checks were performed at 0.08g, 0.12g, 0.18g, 0.24g, 0.36g, 0.50g, 0.70g, 1.00g, 1.42g ZPA. The deformations, at each step measured through strain gauges, were monitored and the values did not exceed the defined limits.
Finally, the 2×1.00g =2.00g ZPA time history test according to IEEE 693-2018 high level has been performed.
The same procedure for calibration and instrumentation checks was performed at 0.08g, 0.12g, 0.18g, 0.24g, 0.36g, 0.50g, 0.70g for 550 kV class.
After the final test, a post-seismic test inspection has been carried out with following items:
1. Visual inspection if any damage occurred;
2. Bolts torque values comparison before and after test;
3. Evaluation of the test response spectra of the shake table motion about its capability to envelope the required response spectra of the technical specification.
Moreover, for all bushings a post-test resonance search has been performed by imposing an input sine sweep at 0.07g in the main three directions (X, Y, Z). According to IEEE standard, a change of more than 20% in the resonant frequencies can be used as parameter to determine whether there are structural changes because of material damages. Resonance tests have been successfully carried out for each test object: no change for the values before and after tests. The bushings after mechanical test passed the routine electrical checks without changing about partial discharge behavior. The tests were witnessed also by W.E. Gundy & Associates, Inc to validate the product with official qualification report mandatory for the accessibility in some market areas.

Conclusions
This paper analyses special tests, electrical and mechanical, carried out in GE Grid Solution – Italy RPV Unit, to prove the RIP dry bushing’s reliability up to 550kV. Since the market is moving fast toward dry solution, replacing traditional OIP technology, the reliability aspects in service are key points that must be included in each product development activity since the beginning. Furthermore, the bushing dry technology is growing because of the large demand for HVDC and AC free oil and free SF6 bushings. Due to interconnection requirements and network structure, HV substations are sometimes located in high seismic or and polluted areas for which is necessary to offer a full proven solution. Bushings are an essential component of transformers, and any failure of such component can result in a system failure with serious consequences because of damages and high expensive outage for the Utilities. In this regard the most relevant standards require for the bushings higher test level than transformers ones, aiming to obtain reliable products for long service life. In addition to the requirement prescribed by standards some special tests, performed by bushing OEM, can confirm the behavior about optimized solutions with focus on performances and product cost reduction as well
References
[1] IEC 61251 Electrical insulating materials and systems – AC voltage endurance evaluation.
[2] IEC 60243-2 Electric strength of insulating materials – Test methods – Part3: Additional requirements for tests using direct voltage. 2013-11
[3] IEC 60243-3 Electric strength of insulating materials – Test methods – Part3: Additional requirements for 1,2/50 ms impulse tests. 2013-11
[4] Bushing Technology Overview, INMR 01/2022 Prof. Stanislaw Gubanski.
[5] Transformer Bushing Reliability, CIGRE Technical Brochure 755 -February 2019, WG A2.43.
[6] G. Testin, P. Cardano, M. Sehovac, M. Boutlendj, A. Pigini, HV & UHV bushings design optimization from safety point of view, INMR World Congress 2013.
[7] P. Cygan and J. R. Laghari, Models for insulation aging under electrical and thermal multistress, IEEE Trans. Electr. Insul., Vol. 25, pp. 923-933, 1990.
[8] W. Cao, W. Shen, B.He, K.Wu, Structural Design for DC Bushing Core Based on the Material Life, IEEE Trans. Electr. Insul., Vol. 20, pp. 281-288, 2013.
[9] E. L. Brancato, Insulation Aging. A Historical and Critical Review, IEEE Trans. Electr. Insul., Vol. 13,pp. 308-317, 1978.
[10] D. R. Johnston, J. T. LaForte, P. E. Podhorez and H. N. Galpern, Frequency Acceleration of Voltage Endurance, IEEE Trans. Electr. Insul., Vol. 14, pp. 121-126, 1979.
[11] G. Pirovano, P. Omodeo Gianolo, A. Pigini, Assessment of the pollution performance of composite insulators, ISH 2013.
[12] IEC 60815 TS Part 2-Selection and dimensioning of high-voltage insulators intended for use in polluted conditions –Ceramic and glass insulators for a.c. systems.
[13] IEC 60815 TS Part 3 -Selection and dimensioning of high-voltage insulators intended for use in polluted conditions –Polymer insulators for a.c. systems.
[14] N. Giao Trinh, Electrode Design for Testing in Uniform Fields gaps, IEEE Transaction on Power Apparatus and Systems, Vol. PAD-99, No.3 May/June 1980.
[15] Recognition of Discharges, Electra n° 11, CIGRE 1969.
[16] P. Cardano, G. Testin, V. Fogliani, A. Pastore, M. Sehovac, Development of UHV bushings for extremely severe seismic conditions, INMR World Congress 2017.