![]() Leer sobre UV vs IR en Español
Leer sobre UV vs IR en Español
Ultraviolet (UV) discharges and thermal hotspots are reliable indicators of defects at electrical installations and being able to efficiently visualize these has therefore been a longstanding goal among power utilities. This edited past contribution to INMR by engineers at Eskom, CSIR and Uvirco Technologies in South Africa, traced the evolution of systems that allow such defects to become visible to maintenance personnel. It also reviewed some key elements needed to correctly interpret findings.

Thermal imaging using a range of infrared-based devices (IR) has been utilized for a long time and enabled maintenance staff at power utilities to accurately locate problem areas, commonly referred to as ‘hotspots’. However, until the introduction of corona imaging cameras, methods of corona detection, including audible noise, have not been nearly as valuable in pinpointing the source of discharges, even with noise direction finders.
Generally-speaking, since the causes of hotspots and UV discharges can be quite distinct, different technologies are needed to visualize them and to properly assess their level of severity. Having as much data as possible on any problem allows improved decision-making. Similarly, being able to see a defect from a distance improves safety and also working conditions for maintenance staff.
The term ‘corona’ applied to electrical discharge phenomena has an origin dating back to ancient times. During stormy weather at sea, sailors noticed reddish and bluish lights at the tops of masts and at the end of yardarms. Because the rounded head of the mast made this light seem like a crown, it came to be referred to by its Latin equivalent, corona. Many years later, as sources of high voltage electricity were developed, these same types of phenomena were also observed in test laboratories. Corona has become the term commonly used to describe all electrical phenomena occurring either in or near the surface of electrical devices that result in UV discharges.

Principles of UV Discharge Generation
Excessively high electric fields surrounding energized equipment can ionize nitrogen molecules in the air. During this process, photons are emitted at a wavelength characteristic of the spectroscopic properties of nitrogen. Since this molecule emits light (photons) mainly in the ultraviolet region (with peaks at 298 nm, 347 nm and 358 nm), emissions at such wavelengths are barely visible to the eye whose receptors are sensitive only from 400 nm to 700 nm. Similarly, most of the commercial grade lenses in binoculars and cameras are poorly transparent for UV radiation and therefore suppress the discharges that might ordinarily be seen using them.
UV Discharge Acoustic Detection
With the dawn of the electrical age, it was observed that high voltage sparks in air produce acoustic emissions equivalent to the sound of lightning during a thunderstorm although at reduced scale. As increasingly higher voltages came to be used, the electrical coronas at the most stressed regions of electrical equipment and conductors could not only be seen in the dark but their associated acoustic emissions also heard. Most electrical engineers are familiar with this phenomenon at HV substations and along transmission lines – particularly on wet or foggy days.
UV Discharge Visualization
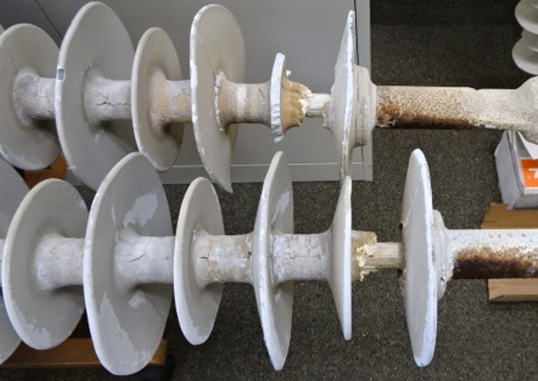
For a long time, the primary method of problem detection through UV discharge visualization was the naked eye, assisted by some optical device and done at night to eliminate the effect of the sun. Potential sources of discharges could also be identified through close up and aerial visual inspection, checking for signs of damage or flashover marks. Such inspections, however, seldom revealed hotspot sources that are primarily internal by nature.
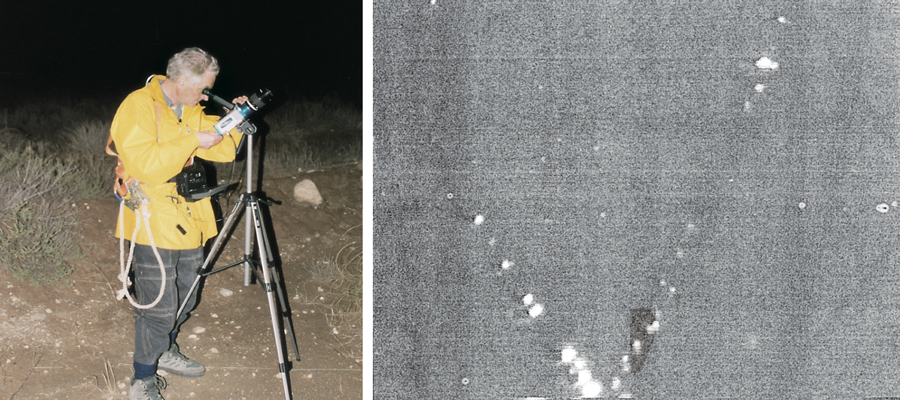
Then came ‘still imaging’ of discharges using standard 35 mm cameras with artificial illumination to show up the source. Again, this could only be performed under low ambient light and required long exposures, meaning that the camera had to be kept still. This would be time consuming when conducting an inspection to find the source of discharges which may have been detected with the ear or an ultrasonic device. Nevertheless, imaging with high definition cameras having a good lens can still be used to determine the detail of any specific fault once its exact origin has been pinpointed using UV or IR visualization equipment.
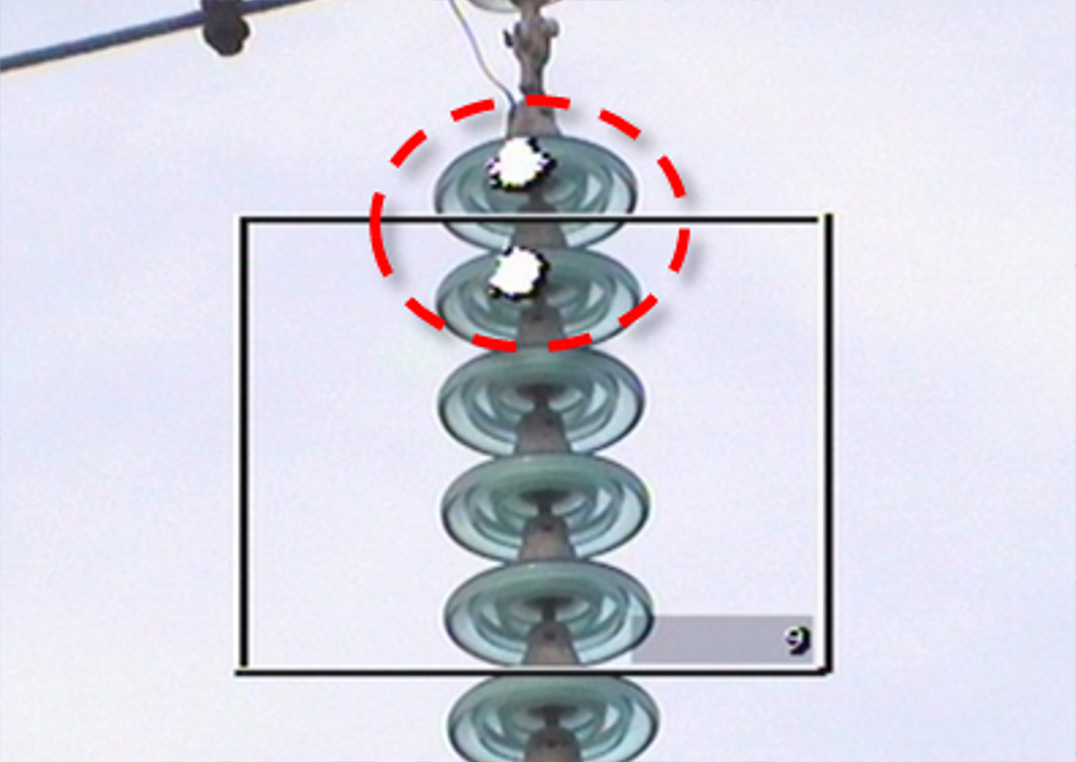
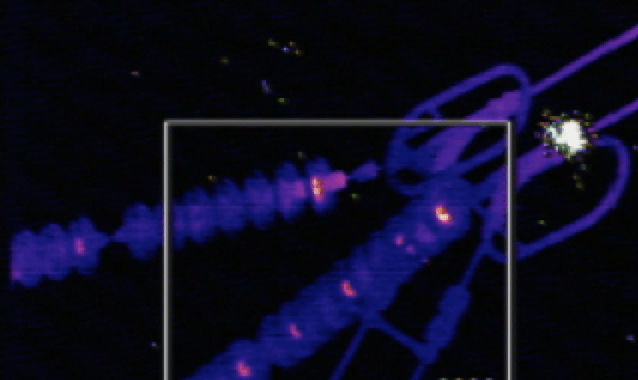
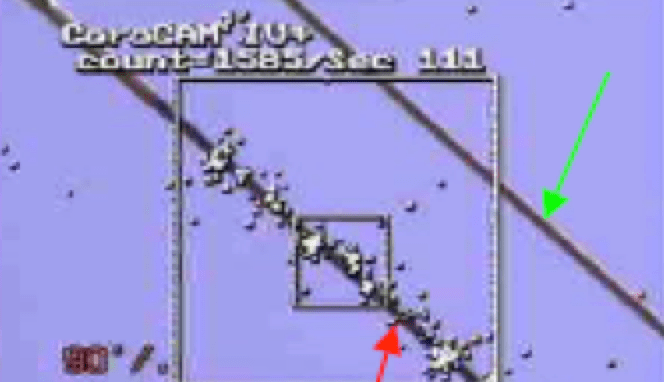
The introduction of corona cameras (initially for night time, low light and indoor use) allowed maintenance personnel to see corona discharges in the UVa (320–400 nm) and UVb (280–320 nm) wavebands at their point of inception. Therefore, it became possible to immediately identify the location. Such analogue systems also provided a real-time image of the phenomenon.
Significant progress was subsequently made in developing this technology to offer greater light collection sensitivity and extend the usage window into low light conditions. Such systems are still being used when manpower or system availability dictates against daytime inspection or where such a survey is indoors, away from overpowering sunlight. However, user needs soon required cameras for daylight hours to promote greater efficiency and safety as well as to offer improved background imaging via a visible channel. The development of the daylight solar-blind camera, while constrained by low levels of UVc corona emissions below 280 nm at which solar energy ceases, has allowed accurate inspections to take place during the day and with some quantification of the UV photon events taking place. The latest generations of daylight UV detection cameras have a removable solar blind filter on the UV channel and a near-IR filter on the visible channel, allowing the same system to be used with better sensitivity under indoor or low light conditions.
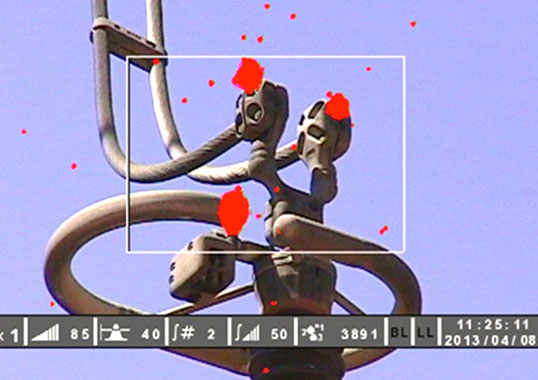
Due to the necessity of splitting the image entering the camera (to allow the solar-blind filter to block sun radiation), the final image in these daylight systems is digital, with the UV image consisting of a series of pixels superimposed on the visible daylight image. This has the advantage that it gives ample opportunity for the UV image to be enhanced, if required, through image-processing and also allows the user options to display it to best advantage. These options include image coloration (to enable the UV to contrast with the background), frame integration (to remove background noise), photon counting (for UV quantification) and high definition zoom (to examine the discharge location more closely). Depending on distance from the object and severity of problem, it has generally been found that the lower voltage limit for daylight detection of faults is around 11 kV (or around 3 kV when the solar-blind filter is removed).
[inline_ad_2]
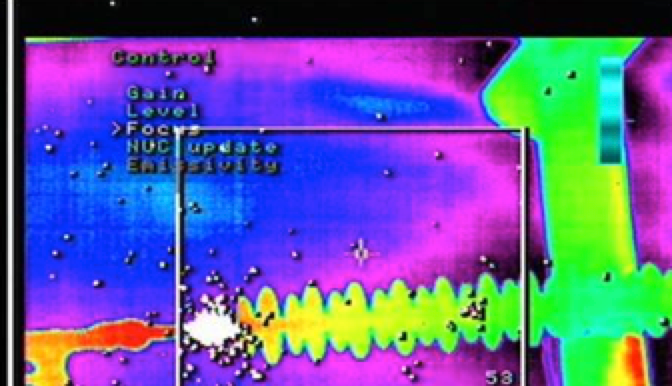
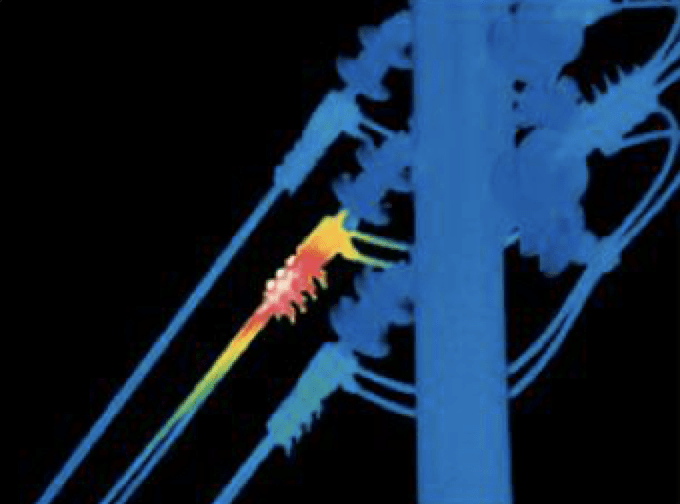
Thermal Hotspot Visualization
Infrared detection technology has been applied for much longer than UV visualization and has long been accepted as a standard methodology to detect faults that could lead to power failures. A number of sophisticated and expensive such systems are commonly available. Unfortunately, IR tells only part of the story since it does not pick up any surface discharges where heat is not generated but which are often related to voltage differences, i.e. indicating areas with potential for flashover and resulting outage). UV detection, by contrast, does not pick up hidden or current related faults from which UV photons cannot escape but which could produce hotspots for the IR imaging system to locate. As such, both technologies are required to provide complete information on the integrity of a line and its associated hardware. If all this can be done using one instrument, the inspection process becomes more efficient and, more important, ensures that both phenomena are observed under the same conditions and instrument settings.
Visualization Applications
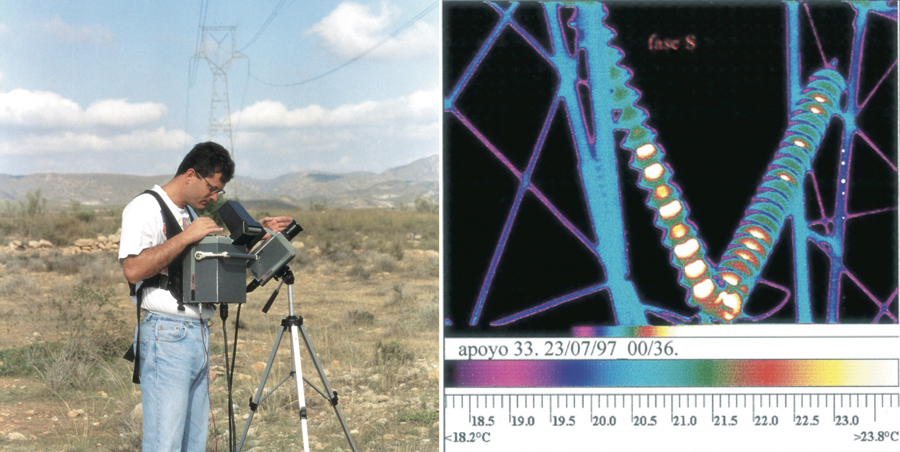
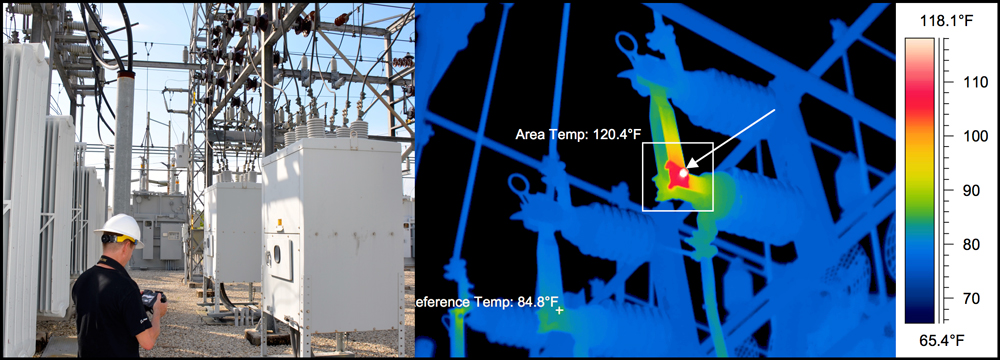
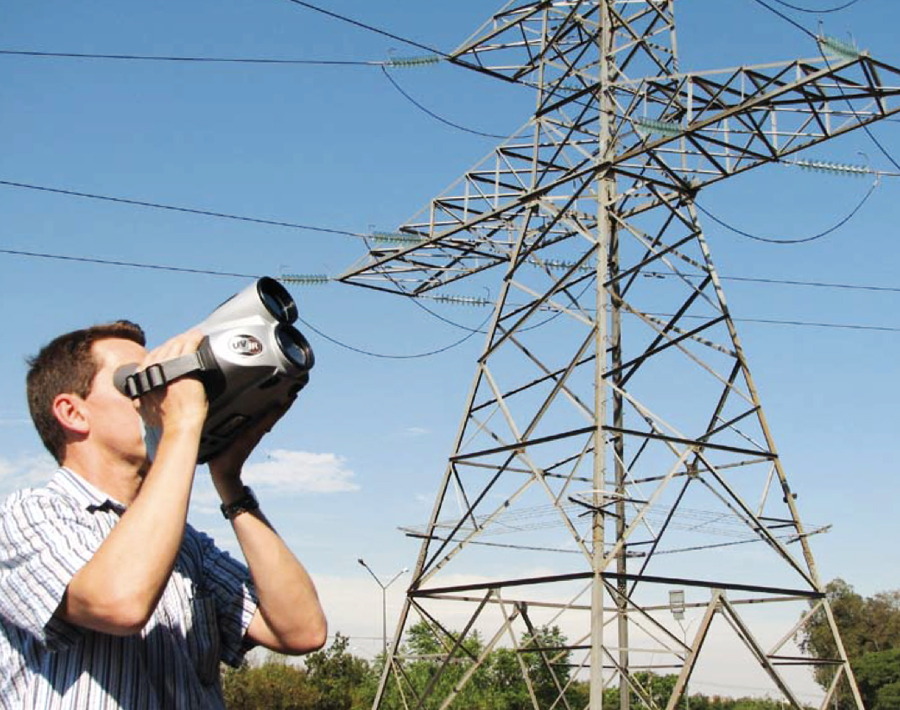
Now that these visualization technologies are widely available, there are several ways to deploy them, depending on application. For smaller areas, such as substations, surveys on foot using portable systems are suitable. For surveys of overhead lines, mounting the detection/visualization system onto a vehicle (for transmission lines), a train (for railway lines) or helicopter (for long lines or across inaccessible terrain) is mandatory. Each system has advantages and drawbacks and careful selection of the appropriate method is required for efficient use of equipment and manpower.
Use of a helicopter offers further options in that the visualization system can be handheld, mounted onto some type of suspension system or installed in an underside gimbal that is controlled from the cockpit. For all these options it is preferable to have a locator system such as a GPS and essential to have a recording system so that the faults detected during the survey can be analyzed and reported at a later time. A refinement on the helicopter theme, for low cost short aerial inspections is development of unmanned aerial vehicles (UAVs). At present, these are radio-controlled by a ground-based operator but autonomous flight systems may soon fly pre-programmed patterns along sections of line until they run out of fuel.
Another application of visualization technology is 24/7 surveying of fixed locations such as particularly vulnerable areas within a substation. This could be done with either a fixed field of view (FOV) camera or, more likely, one mounted on a pan and tilt mechanism to survey larger areas. Such a system can then be used with image or pattern recognition software to alert operators to significant changes between successive sweeps, indicating onset of a potential problem.
Utilizing Visualization Results
The first prerequisite for understanding visualization results is to have them in pictorial form for easy interpretation. This means that the visualization systems must be capable of recording, preferably both still images and video clips, from which further still images can be captured for use in reports. Low-light cameras generally only output video streams that can be recorded on separate video recorders. Daylight systems feature still image storage as well as video output streams thereby allowing more effective use of survey time.
It is important to understand the following points when interpreting results from any IR or UV survey:
• Not all UV discharges or hotspots are immediately dangerous or damaging to equipment. Rather, they offer an indication of some abnormality that is in the process of developing;
• Any UV discharge or hotspot, at a minimum, indicates some loss of transmission/distribution power;
• Individual UV and IR detection camera readings are by themselves not conclusive but should rather be used alongside one another;
• A number of equipment, environmental and instrument variables can impact UV photon or IR temperature readings;
• Any source/cause of UV discharges or hotspots should be understood before deciding on the best remedial course of action.
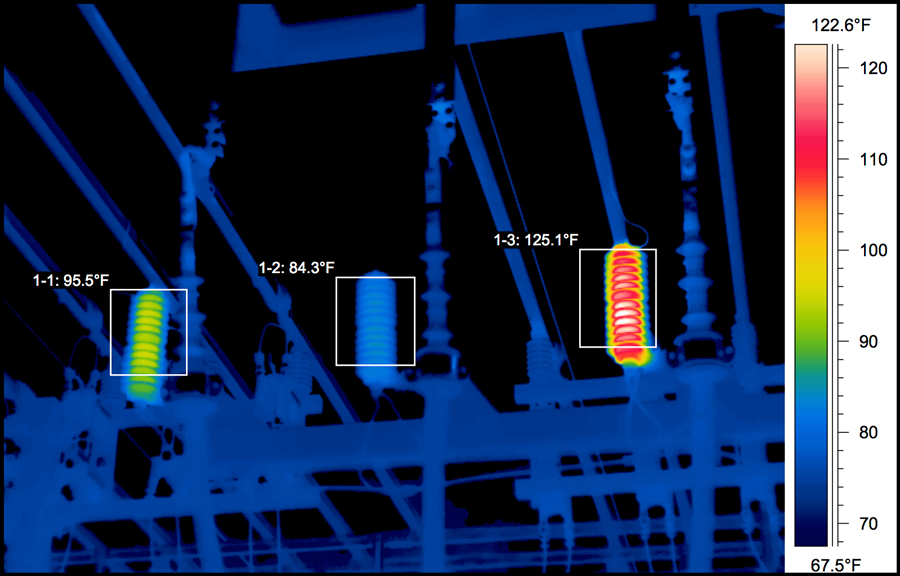
Daylight corona and infrared cameras have the function of counting and displaying number of photons or temperature of a hotspot respectively. However, it is important to realize that this is not necessarily an absolute measurement of the severity of either. Similarly, no specific conclusion should be taken from a single reading without considering all variables, including: distance, atmospheric conditions, camera settings and equipment design parameters. Rather, the cameras should be used as data collection systems, either:
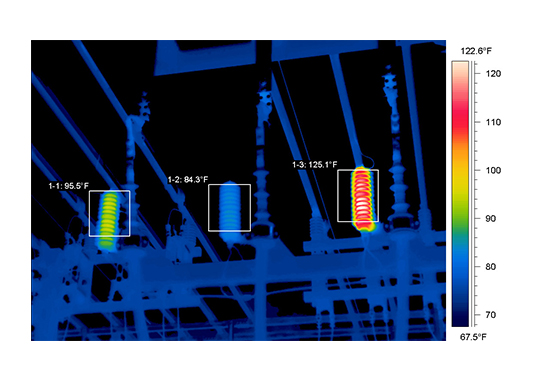
• to compare two equivalent pieces of HV equipment and highlight a significant difference in UV discharge activity or hotspot temperature with the same camera settings, or
• to build up a pictorial history of the change in behavior/UV discharge activity/or hotspot temperature over time from specific pieces of equipment.
In order to best determine what actions should be taken from results of UV or IR surveys of equipment, one should ideally:
1. Establish a list of critical equipment to be monitored;
2. Clarify design criteria/safety factors for this equipment and thus potential failure modes;
3. Develop a matrix for UV discharge/hotspot causes and effects, with suitable actions for each situation;
4. Create a set of criteria for camera settings so as to have consistent equipment monitoring readings;
5. Given the above, create a database of UV discharge and/or IR hotspot values on critical equipment, including environmental factors;
6. Continually update the matrix and criteria as more data becomes available (e.g. photon/temperature readings versus physical inspection of equipment).
The final step to best utilize results of visualization surveys is to create reports that can be used to highlight issues to either management or maintenance departments for remedial action.
Future of Visualization Technology
The next step in the evolution of visualization technologies will likely include application of new sensor technologies from research programs in such fields as nano-technology. These will lead to more sensitive systems (i.e. allowing earlier detection of even minor faults on low voltage systems) that are also more compact yet offer additional features such as better image processing capabilities and additional user adaptable features. The challenge in the aerial inspection field will be reducing survey costs by use of autonomous flight UAV systems.
Another challenge will be meeting user demands for instant analysis of the findings of a visualization process into a report that indicates level of severity and provides recommendations for actions to be taken. Over and above this will be development of other technologies for non-destructive testing of equipment on which faults/defects are being visualized.