[inline_ad_block]
A new ±350 kV HVDC transmission line by Canadian power utility Nalcor Energy runs from Muskrat Falls to Soldiers Pond. Along the route, two areas were considered as potential challenges for insulator dimensioning with respect to pollution and icing; one characterized as coastal area (1) and another as mountainous area (2). A reliable system is required, and therefore confirmation testing was commissioned to verify adequacy of design.
CLICK TO ENLARGE
Based on previous investigations and operational history Nalcor decided to use DC glass cap & pin insulators as an insulation option for the new line design. A number of trial tests on shorter insulator strings were conducted. Based on these results, and taking into account the importance of the project, it was also decided to perform full-scale laboratory tests to verify performance under pollution and icing. Thus, the goal of this work was to verify DC pollution/icing performance of full-scale ±350 kV HVDC overhead line glass cap and pin insulator strings chosen by Nalcor. Withstand tests were performed according to the test program defined by Nalcor in consultation with Kinetrics and STRI, which applied the principles of IEC 61245, IEEE 1783 and an IEEE position paper.Fig. 1: Route of ±350 kV HVDC transmission line (Lower Churchill Project).
Test Program
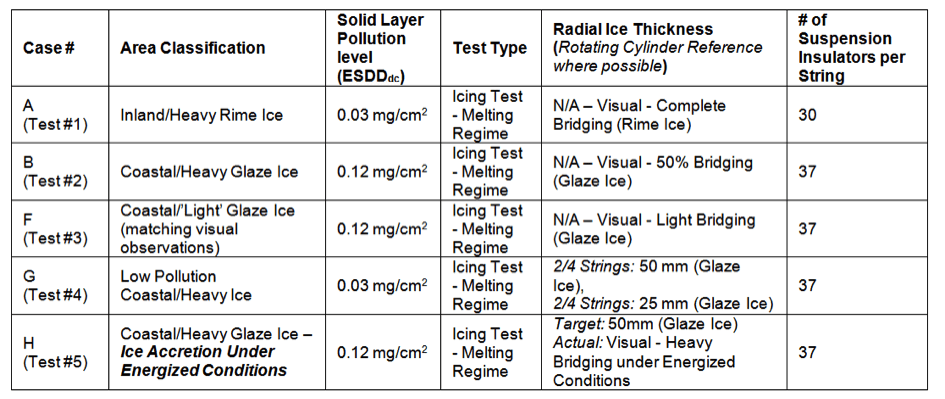
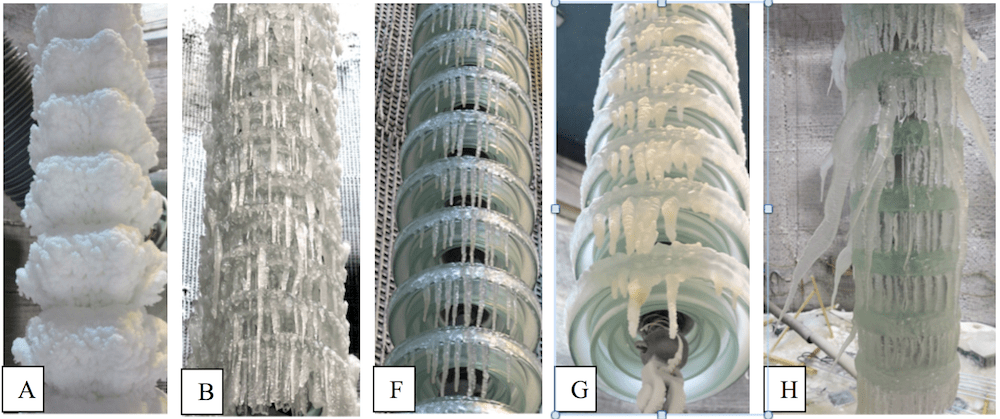
Based on results of reduced-scale testing performed in the laboratory and further discussions, a test program for 5 service cases was created and is presented in Fig. 2. The test objects were DC glass cap & pin insulators of type F 300 PU/C 195 DR. In Fig. 3, the physical appearance of insulators covered by ice before voltage testing is presented for all test cases.
CLICK TO ENLARGE
CLICK TO ENLARGE
Test Details
General Set-up & Application of Pollution
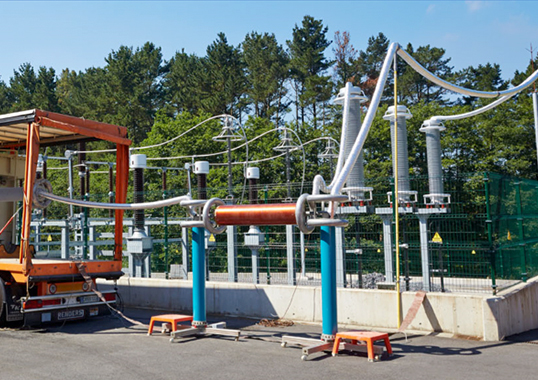
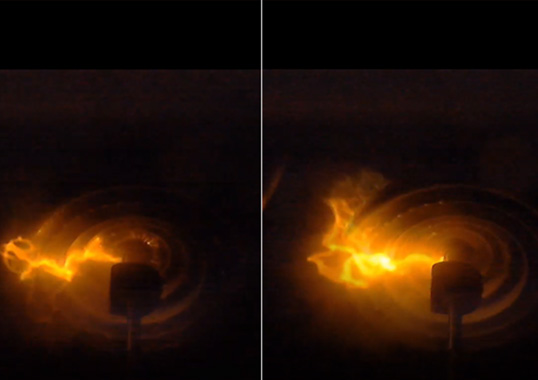
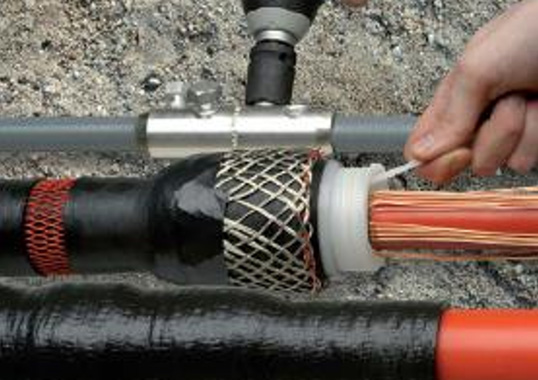
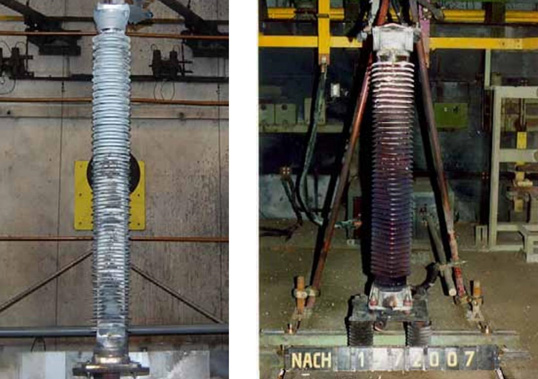
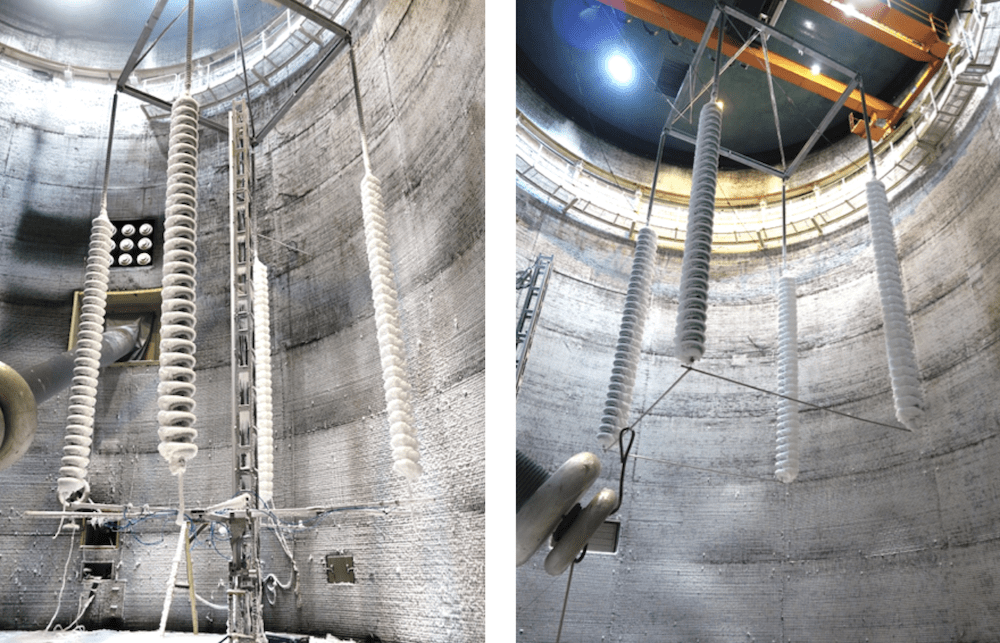
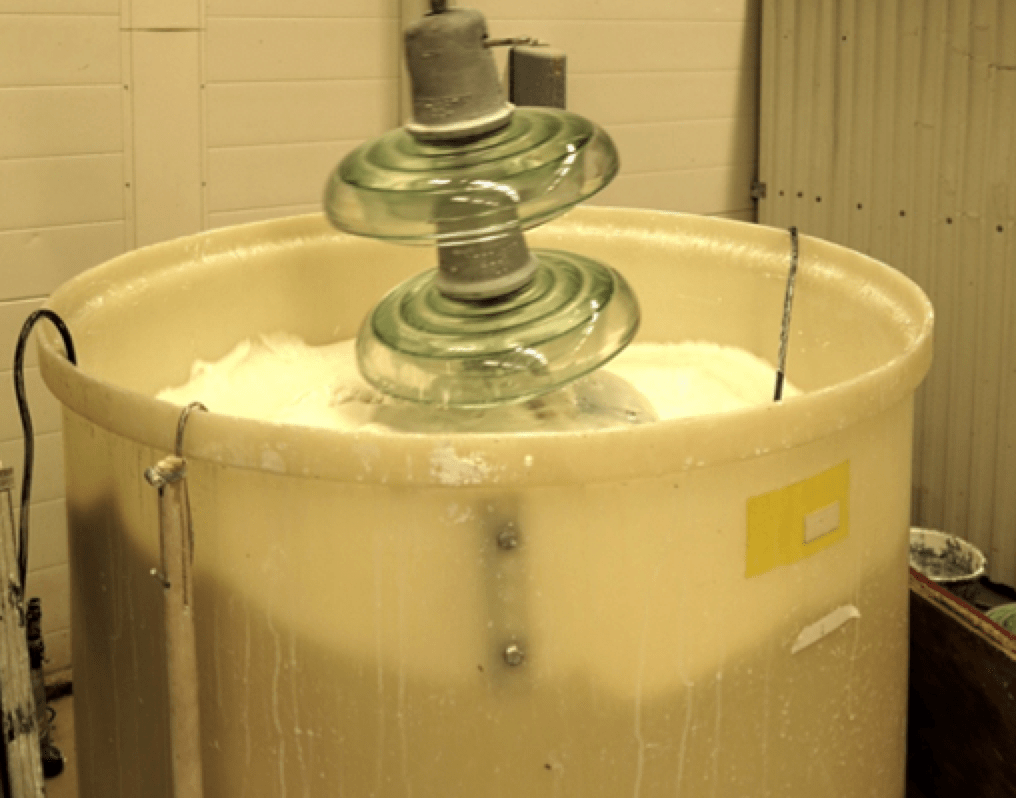
For each test case, four insulator strings were first subjected to the specified ice/pollution conditions and thereafter subjected to a voltage withstand test. In order to be able to meet the test requirements for simultaneous pollution and ice testing, STRI developed a sophisticated set-up providing automatic application of ice without voltage and later a new one, with voltage applied on the relatively long insulator strings during the ice accretion. The view of the set-up for ice accretion for service Case A (Inland/Heavy Rime Ice) in de-energized state (without voltage) is shown in Fig. 4 (left); the same set-up during the voltage test is shown at right. In all test cases pollution was applied by the standard IEC procedure, i.e. by dipping the insulators into a standard suspension prepared from water, salt (NaCl) and kaolin. The targeted pollution levels, determined by Nalcor from field data and characterized by standard pollution parameter Salt Deposit Density (SDD) of 0.03 mg/cm2 (mountainous) and 0.12 mg/cm2 (coastal), were achieved by varying the amount of salt. Another standard pollution parameter, the Non-Soluble Deposit Density (NSDD) was targeted to be approximately 0.1 mg/cm2, which resulted from a standard amount of kaolin in the water solution of 40 g/l. Pollution levels were checked by measurements on sample insulators (average of 3 units) not included in the following ice accretion and voltage test. An example of contamination procedure by dipping is presented in Fig. 5.
CLICK TO ENLARGE
CLICK TO ENLARGE
Ice Accretion
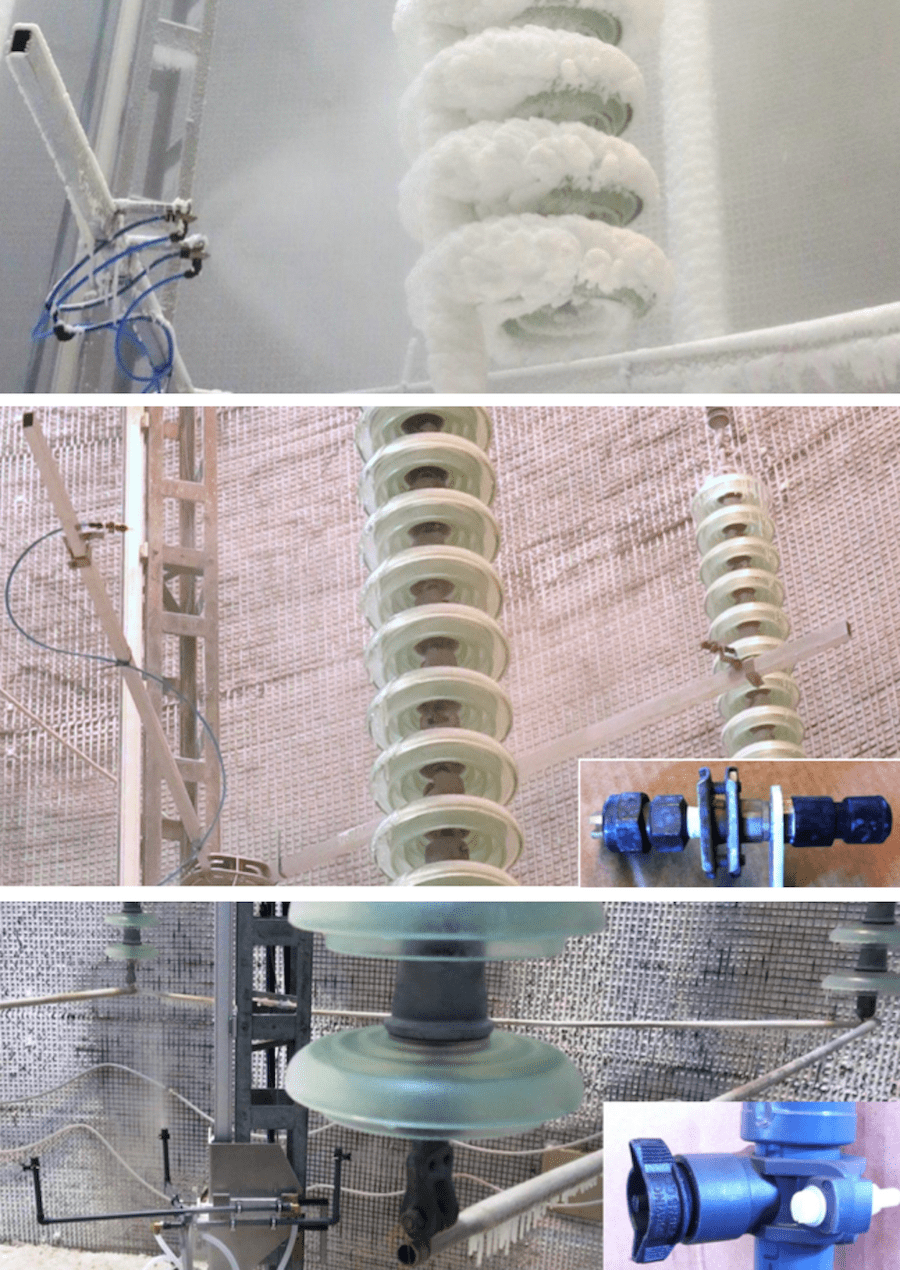
After application of pollution, four complete insulator strings were assembled in parallel in the climate test hall. Ice was accreted onto the de-energized insulator strings (cases A, B, F and G) through spraying of fog by a sophisticated automatic system of nozzles; see Fig. 6, top and middle. To avoid removal of the firstly applied pollution layer, small amounts of water were sprayed onto the insulators in a cyclic manner (using nozzles moving up and down along insulator with adjustable pause length after each sweep). After accretion of the first ice layer to protect the pollution, the pause length between each sweep was decreased, allowing for more time efficient application. According to the test program presented in Fig. 2, the ice should in all cases be of glaze type, except for service Case A, where rime ice was specified. After a number of trial applications the required ice was achieved by use of different nozzles and different distances. For Case A (where rime ice was specified) pneumatic nozzles were used; see Figure 6, top. For this case the water was mixed with pressurized air in the nozzles and this gave a very fine mist with very small droplet size. Two nozzles per string were used, both spraying on the same side of the insulator at a distance of about 0.3 m. The nozzles were moving with a velocity 0.1 m/s. By using the preliminary tuned parameters the water froze more or less instantly when hitting the insulators and no icicles were accreted and no free water could dissolve the pollution layer. Therefore, sweeps were made continuously without any pause. For Case B, F, G glaze ice was specified and for those cases nozzles spraying a mist on the insulators were chosen; see Fig. 6, middle. Two nozzles per string were used in case B and H, spraying on the opposite sides of the insulator at a distance of about 0.6 m. In case H, two nozzles were used to build the first protective ice layer prior to voltage application, and one nozzle was used during icing under voltage. The relative angle between the two nozzles was approximately 180 degrees. In case F and G one nozzle per string was used to reduce the percentage of bridging by icicles. The nozzles were moving with a velocity of 0.1 m/s. By using these parameters a thin film of water was sprayed onto the insulators, which froze to a thin glazed layer in some seconds. Extra attention was paid in the beginning of the ice accretion to prevent the pollution layer from being dissolved and washed off. In general no droplets were observed hanging from the bottom of the insulators in the beginning of the ice accretion indicating excessive amount of water on the surface which could have caused washing of the pollution layer. In the beginning there was up to 5 minutes pause between each spray cycle to ensure freezing without washing. This pause was gradually shortened to be zero after some hours. It was observed that for the higher pollution level the concentration of salt was so high that the surface became wet just due to the hygroscopic property of salt in combination with the high humidity. Thus the surface had to be sprayed a few cycles in order to decrease the concentration, which led to an increase of the freezing temperature, before it could freeze. In service Case H the insulators were ice accreted under full voltage 361 kV of negative polarity. For Case H the same method and nozzles (two per string) as per above (Fig. 6, middle) were initially used for application of the first ice layer without washing of the pollution layer. Then for the ice accretion under voltage a certain distance was needed to prevent flashover. For this part only one nozzle spraying larger droplets (which reach longer) were used; see Fig. 6, bottom. The distance from the nozzles to the insulators was about 2 m. The nozzles were moving up and down with a certain velocity. One nozzle was spraying on each string with a fixed flow rate. The water was pre-cooled to a temperature just above 0°C.
For all test cases the ice was formed either from water similar to the standard IEC rain (conductivity was approximately 100 µS/cm) or from the tap water (conductivity was approximately 200 µS/cm), the details are in relevant sections of the report. During all ice applications the air temperature in the test hall was kept between -7°C and -8°C. Water was sprayed towards the four insulators without additional air flux (no wind simulation).
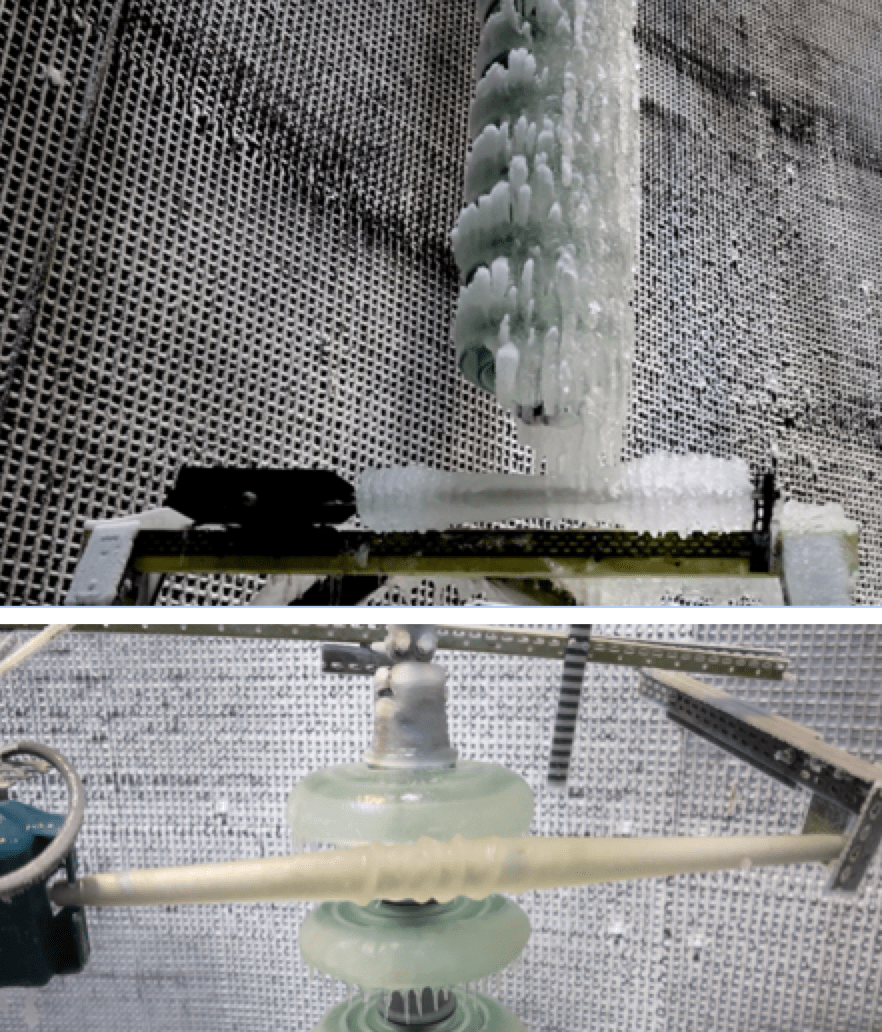
Ice thickness and ice distribution were specified to be measured in some parts of the test program according to Fig. 2. However, the visual criterion for level of bridging between the insulators was the dominant criterion to make a decision when the target ice accretion is accomplished. For cases A and B, ice accretion was continued until the “complete bridging” was achieved (the additional criterion was that about 50% of the diameter of the insulator should be covered by ice); this was defined by visual observation and recorded by photography. Another parameter, the required thickness of ice at the standard rotating cylinder, was measured and documented for cases B, F-H (Fig. 7). The rotating cylinder was installed at the bottom of one of the strings in cases A, B, F, G (Fig. 7, top); while it was installed at the top of the arrangement in case H (Fig 7, bottom).
CLICK TO ENLARGE
CLICK TO ENLARGE
Voltage withstand test
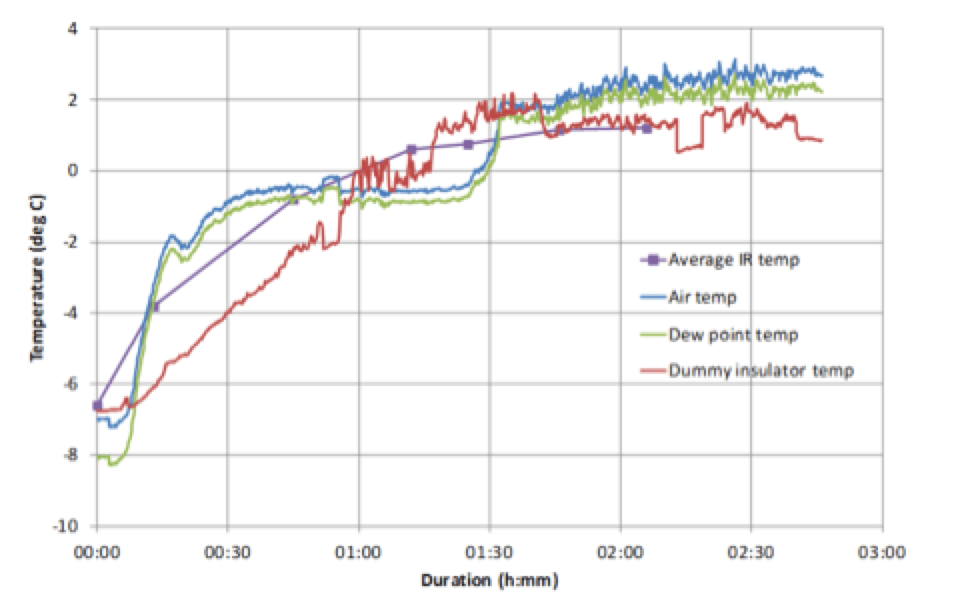
The voltage withstand tests in all cases were performed in “melting regime” mode (which is the worst service case) according to the principles of IEEE 1783. This was achieved by increase of temperature in the climate test hall after finalized ice accretion for each case. The door of the chamber was opened and additional flow of warm air was created by the fans evacuating air through the roof of the chamber. The gradient of temperature increase was in the proximity of zero degrees C to about 1-2oC/h; see Fig. 8.
CLICK TO ENLARGE
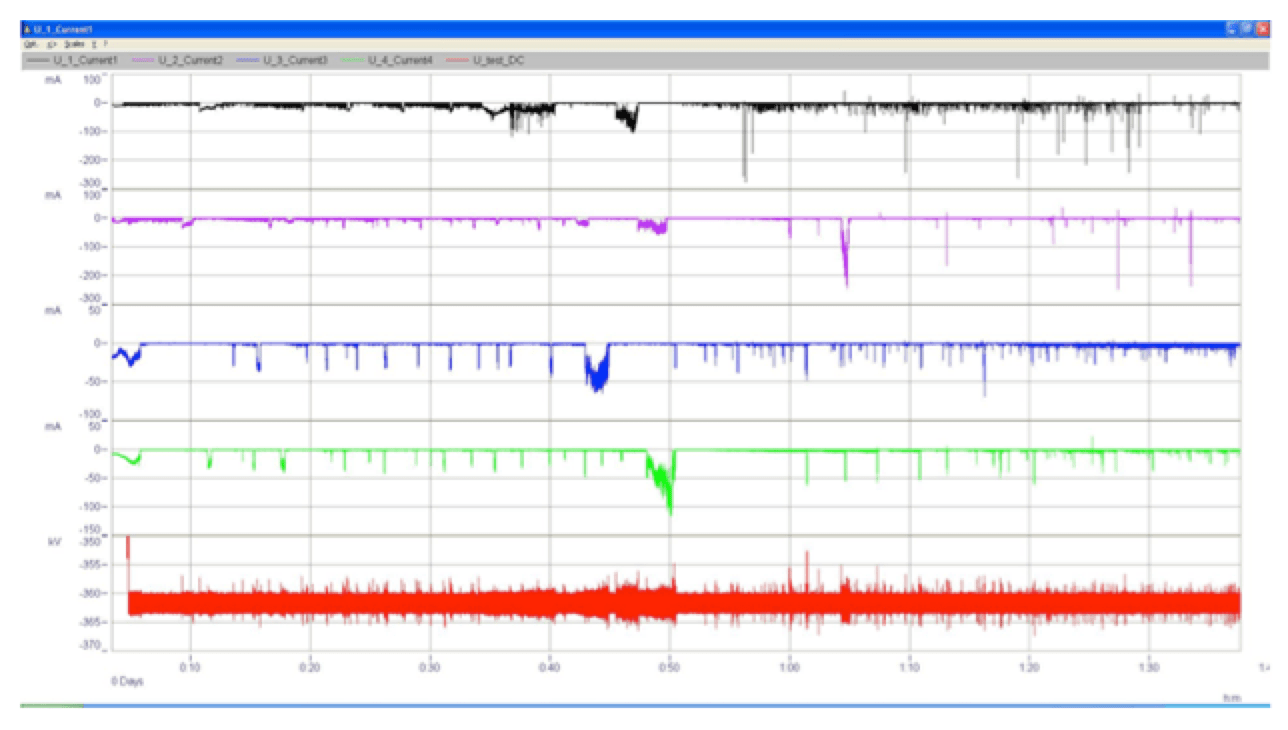
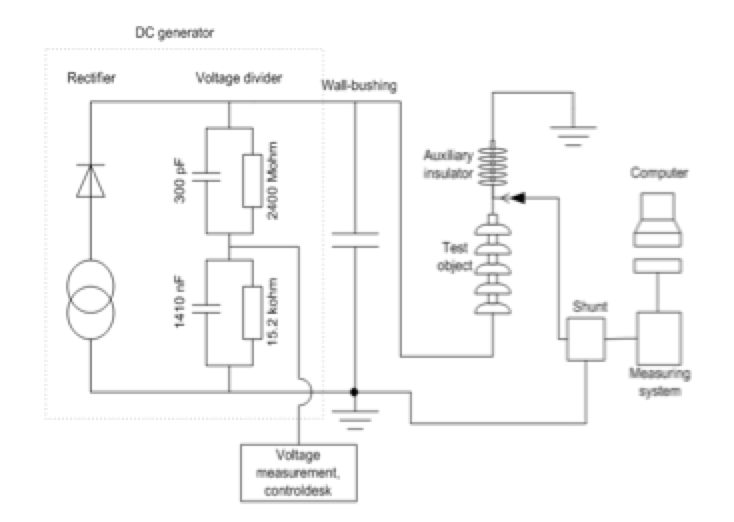
All voltage withstand tests were performed at the test voltage of negative polarity, i.e. -361 kVDC. This voltage was also maintained through the melting phase. Due to the size of the test objects, and the amount of ice, the test objects could not be moved after ice accretion. Thus, the insulator strings could not be tested individually. Therefore, for all cases insulators were tested in the same position as during ice accretion phase; i.e. four insulators in parallel. This arrangement simulated IEC standard withstand procedure, where it is allowed to treat as withstand test either no flashovers after three tests or one flashover after four tests. If flashover occurs on two parallel test objects of four, then the test in this project was treated as failed to confirm the withstand level. The DC generator fully complies with the relevant standards, IEEE Standard and IEC 61245. This is confirmed by the voltage drop in Case H, where the highest leakage currents were obtained (no relative voltage drops or over-shoots larger than 3%); see Fig. 9.
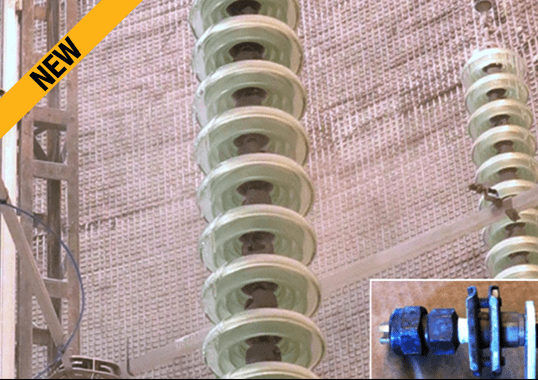
During the voltage tests, leakage currents were recorded utilising a data acquisition system recording the voltage over a resistive shunt connected to the ground lead of the insulator under test; see Fig. 10. The data acquisition system was also set to record applied voltage, the sampling frequency of data acquisition system running continuously was set to 1 kHz. The cables for leakage current connected to the top of each string were mounted to be easily pulled out in order to, in case of flashover, disconnect this insulator and continue the withstand test on the three remaining insulators.
CLICK TO ENLARGE
CLICK TO ENLARGE
Parameters measured during the test
The following parameters were measured during the tests:
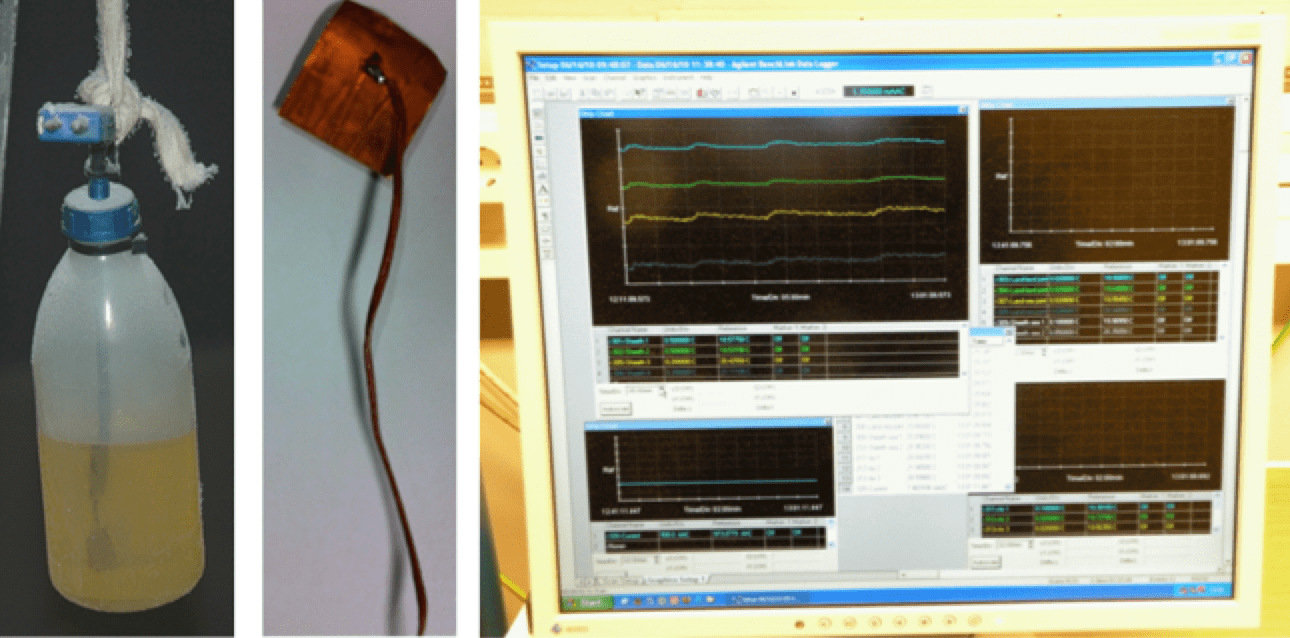
• Temperature in climate hall ( 11, top)
• Humidity in climate hall
• Ice density
• Ice thickness at standard rotating cylinder
• Melted ice water conductivity via collection of melted water during voltage test
• Melted ice water volume via collection of melted water after voltage test
• DC test voltage
• Leakage current
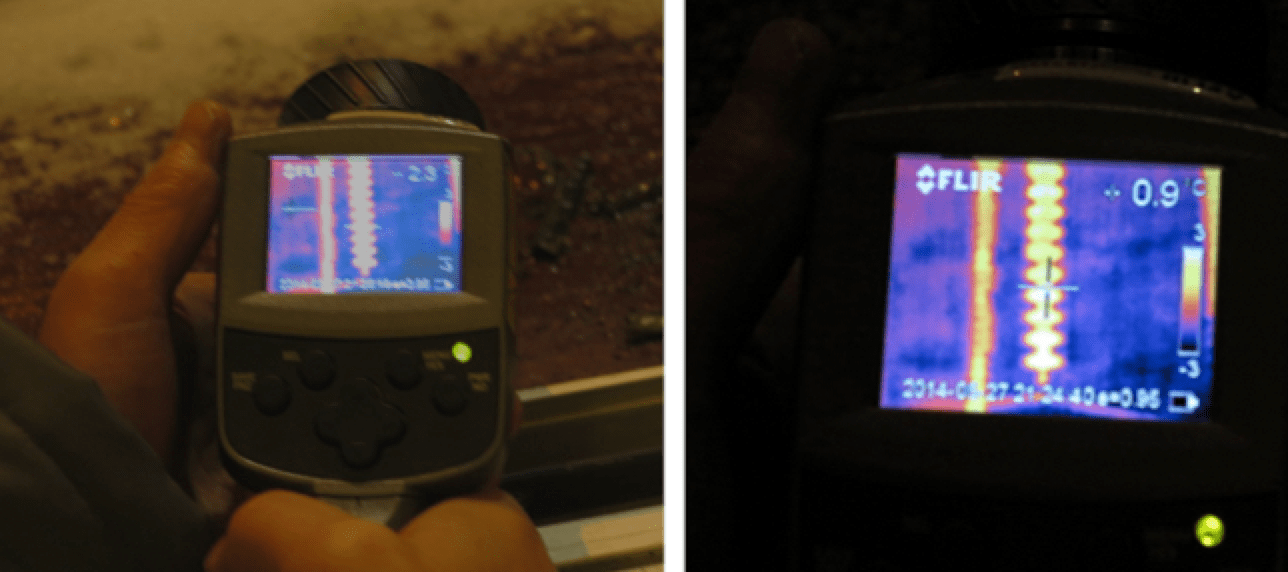
• Ice temperature by non-contact IR measurements ( 11, bottom)
CLICK TO ENLARGE
Summary of Test Results
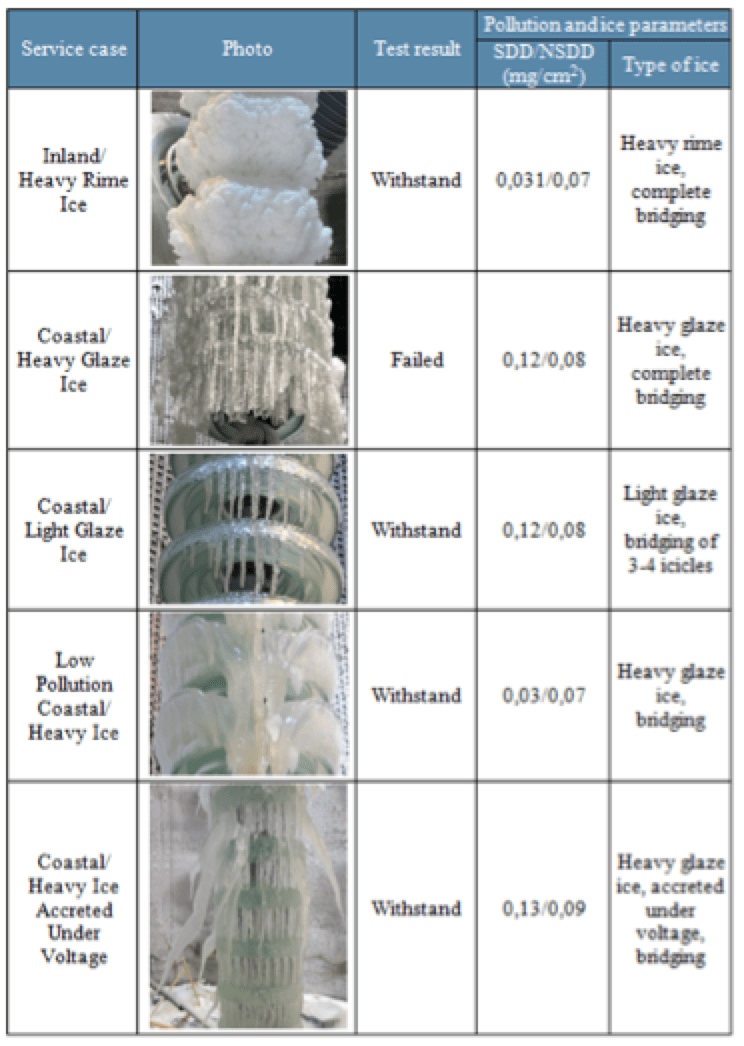
To verify DC pollution and icing performance of ±350 kV HVDC full-scale glass insulator strings were tested at STRI. Five service cases (tests) under different ice and pollution conditions were verified in total. The results are summarized below. An overview of the test results is given in Fig. 17. The preparations, pre-tests and the five cases full-scale tests were performed during May and June 2014.
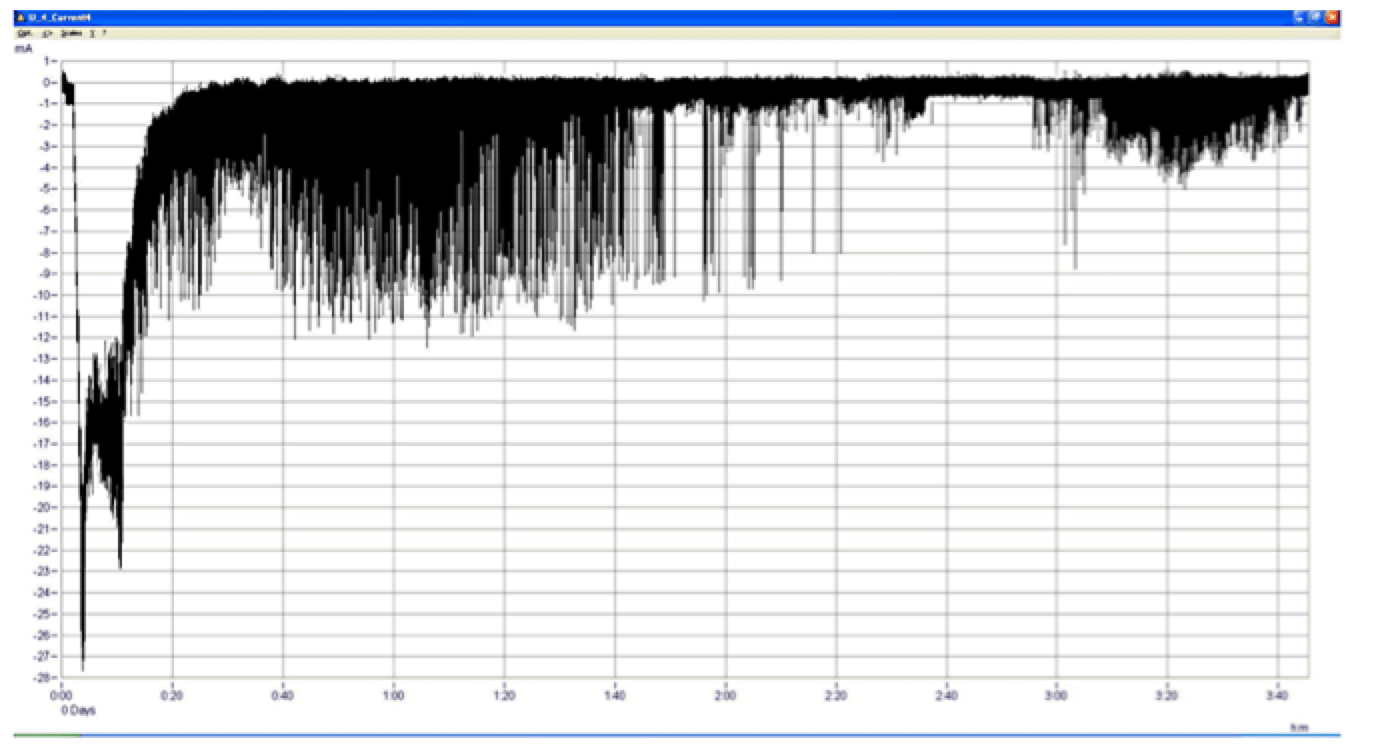
Case A (Inland/Heavy Rime Ice): To simulate inland mountainous conditions, strings with 30 units were polluted at SDD/NSDD 0.031/0.07 mg/cm2 and covered by rime type of ice (using 200 µS/cm water) until complete bridging (ice density 0.55 g/cm3). In the voltage test all four insulators withstood the test voltage -361 kV with maximum leakage currents up to 30 mA, see Fig. 12.
CLICK TO ENLARGE
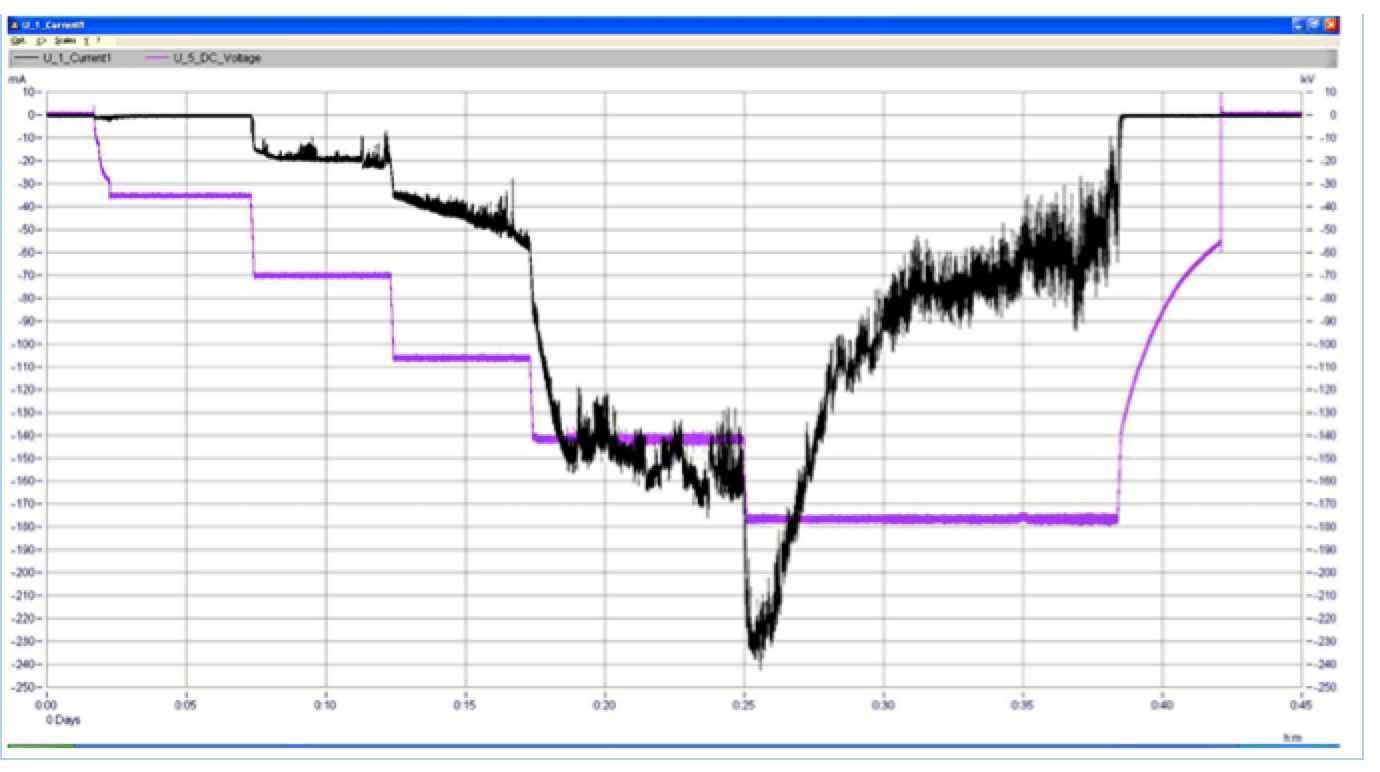
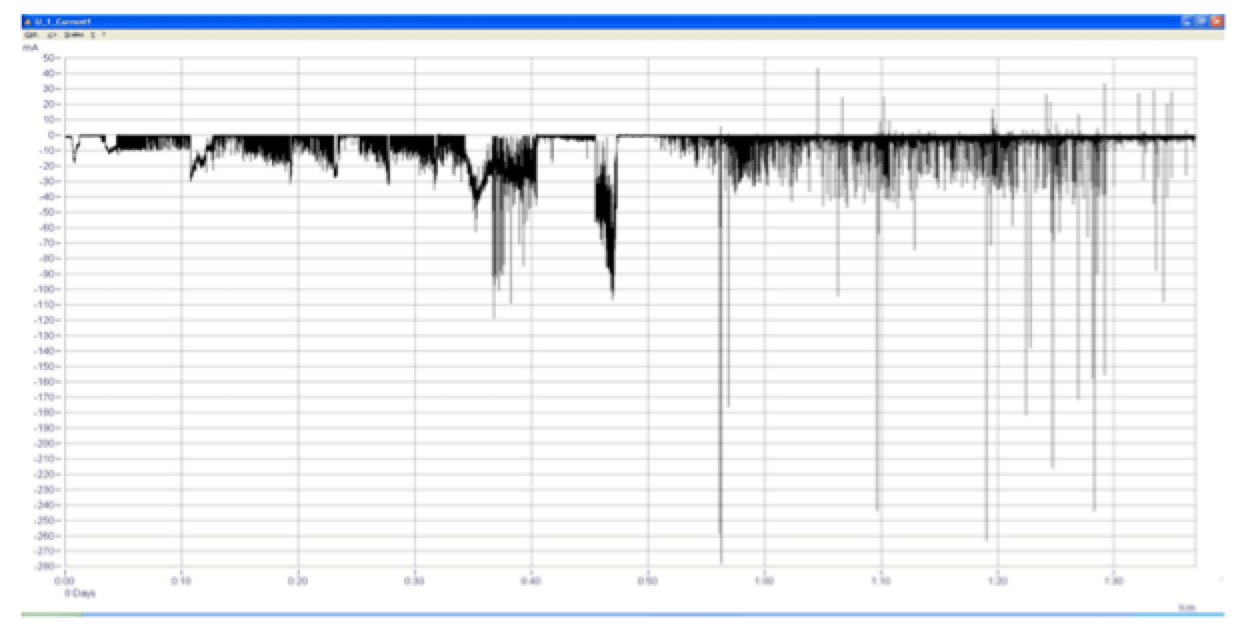
Case B (Coastal/Heavy Glaze Ice): Performance under coastal condition (and what might be the worst case conditions to test an extreme event) was evaluated on strings of 37 units polluted at relatively high level of SDD/NSDD 0.12/0.08 mg/cm2. Heavy level of glaze ice was also accreted by use of 200 µS/cm water until about 50% of the circumference of the insulators was covered by bridging icicles (ice density 0.91 g/cm3). After the ice accretion it was found that that targeted ice level of 50% bridging (Heavy Glaze Ice) resulted in an extreme amount of ice on the strings. The ice accretion on de-energized insulators resulted in complete bridging of the total length, i.e. a column of icicles without the gaps expected to be formed on energized insulators. In the voltage test on the four parallel insulators the DC voltage source was tripped due to the high current (over 700 mA) -260 kV. When voltage was applied to one single insulator, after reaching -180 kV a leakage current of more than 200 mA was registered; see Fig. 13. After a few minutes at the voltage of -180 kV, the two lowest insulators at the bottom of the string shattered in succession. At this moment it was decided to stop the test. Flashovers were expected if voltage should have been raised to -361 kV. Thus the test was considered as failed. This test was designed to verify suitability in an extreme event; however, the probability of combined occurrence of the extreme values with respect to pollution level, amount and distribution of ice can be questioned.
CLICK TO ENLARGE
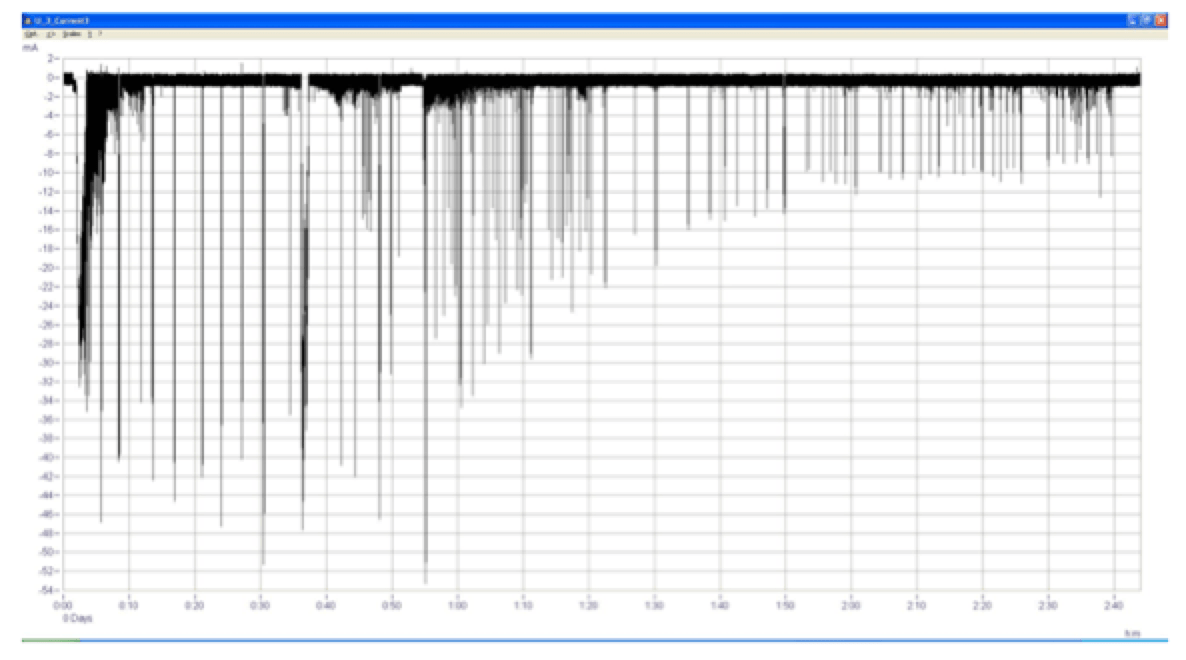
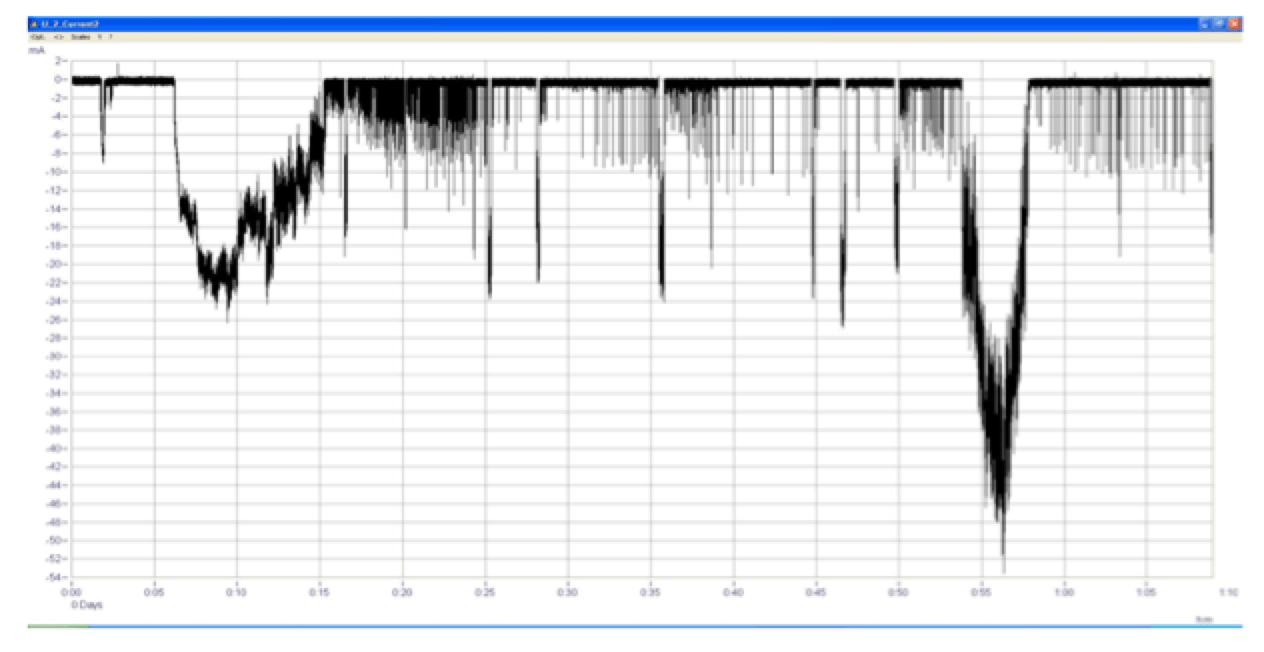
Case F (Coastal/Light Glaze Ice): Strings of 37 units were polluted to SDD/NSDD 0.12/0.08 mg/cm2 and light level of glaze ice was achieved by use of 200 µS/cm water until each gap between the insulators was bridged by 3-4 icicles (ice density 0.91 g/cm3). In the voltage test only one insulator out of four flashed over and the test is considered as withstand. The maximum leakage currents (excluding the flashover current) were about 50 mA; see Fig. 14.
CLICK TO ENLARGE
Case G (Low Pollution Coastal/Heavy Ice): Strings of 37 units were polluted to SDD/NSDD 0.03/0.07 mg/cm2 and glaze ice was accreted by use of 100 µS/cm water (ice density 0.91 g/cm3). Two strings were accreted to 25 mm and two to 50 mm of ice on the reference rotating cylinders. All four insulators withstood the test without flashover. The maximum leakage currents were up to about 50 mA; see Fig. 15.
CLICK TO ENLARGE
Case H (Coastal/Heavy Ice Accreted Under Voltage): In this test the ice accretion was performed under voltage, which is different to the four cases above. Strings of 37 units were polluted to SDD/NSDD 0.13/0.10 mg/cm2 and bridged glaze ice was accreted by use of 100 µS/cm water under DC voltage of -361 kV (ice density 0.89 g/cm3). All four insulators withstood the test without flashover. The maximum leakage currents were about 280 mA; see Fig. 16.
CLICK TO ENLARGE
CLICK TO ENLARGE
Conclusion
Nalcor Energy’s objective for these tests was to verify that the insulator selection and dimensioning would result in a reliable system. Required line routing exposes the system to significant icing and pollution levels. Even though the parameters tested are very rare (>150-years for the icing levels), through these tests, Nalcor was able to verify that the insulation dimensioning would provide for a reliable system. Interesting results were gained in comparison between test B and H, given that under the same pollution and icing levels the test passed when accretion occurred under voltage.