Resin-impregnated paper (RIP) bushings are now an established solution for many applications. Although such bushings are often referred to as ‘maintenance-free’, some of their parameters must nevertheless be monitored prior to putting them into service and also on a regular basis thereafter. Moreover, evaluating their reliability requires understanding certain physical parameters given that unlike in oil-impregnated paper (OIP) bushings the condenser core is solid.
This edited past contribution to INMR by experts at HSP in Germany discussed relevant parameters for such evaluations. Examples from the field were also given to demonstrate how evaluating reliability can be carried out in the case of both bushing technologies.
Resin-impregnated paper (RIP) technology can now be applied for virtually all applications of bushings in the power industry. However, since the condenser core is solid and does not contain the oil found in OIP bushings, there are major differences when it comes to evaluating operational reliability.
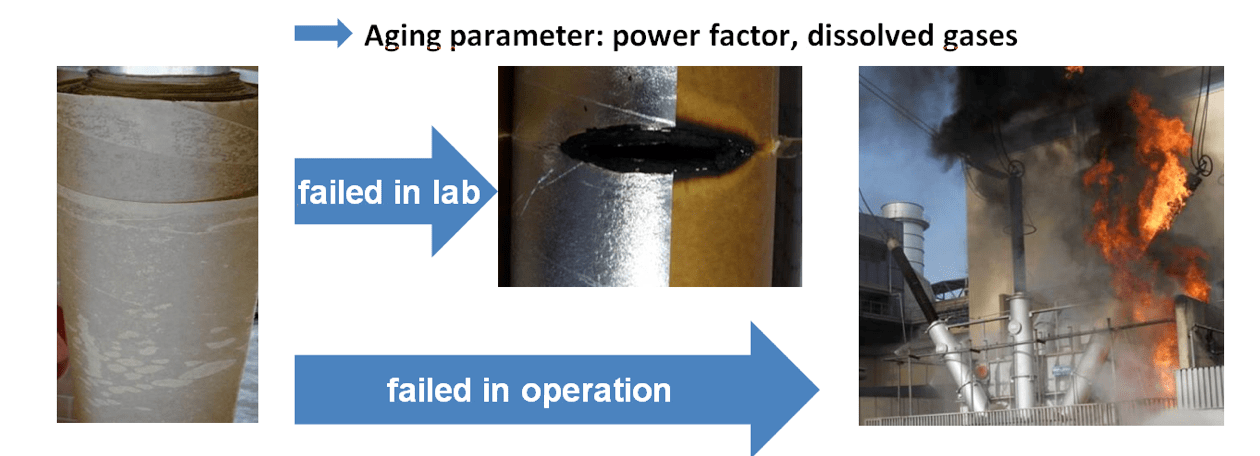
Dissolved gas analysis (DGA), for example, is a well-known methodology to evaluate the condition of OIP bushings. Partial breakdown between grading layers, however, is more difficult to use as a diagnostic for these bushings. This is because the failure mechanism might take place between two successive off-line measurements. Therefore, it is possible that nothing unusual is detected prior to sudden and rapid complete breakdown.
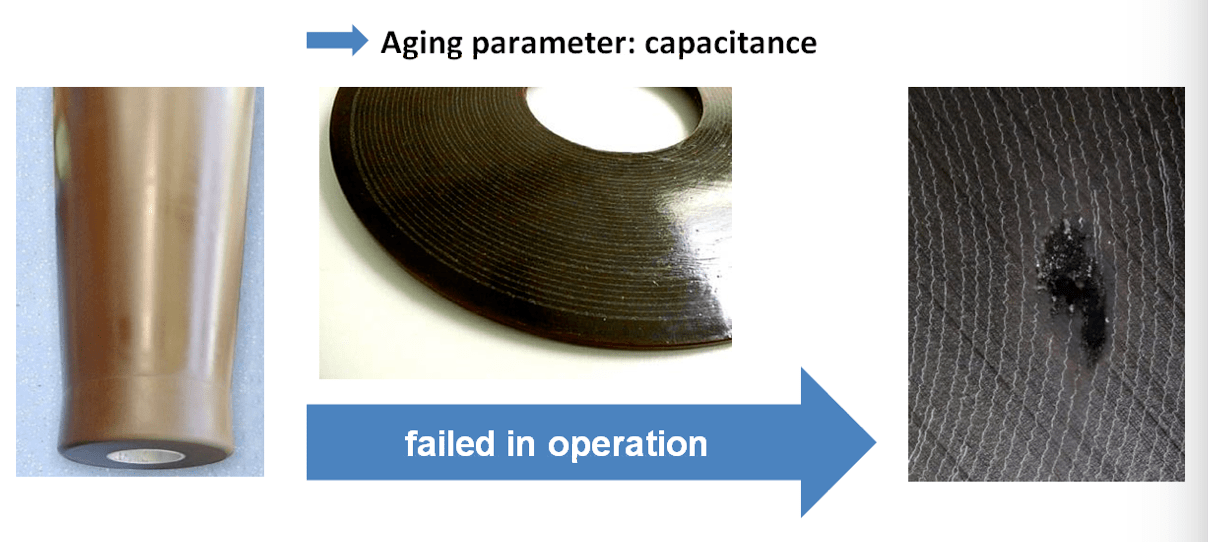
By contrast, in the case of RIP bushings there is no interaction between localized partial breakdown and the rest of the condenser core. Due to the material being solid, any partial breakdown is limited to its particular location. As such, the residual life of an RIP bushing after a first partial breakdown is usually much longer than for an OIP bushing. This means that detection of partial breakdown during offline measurement might be an adequate parameter to evaluate operational reliability.
Aside from capacitance, the power factor of a bushing is also an adequate parameter for diagnostic evaluation. But due to the different design of their condenser cores, the parameters influencing power factor are different for OIP and RIP bushings. For each evaluation, the influence of environmental conditions (e.g. stray capacitances, temperature) must be taken into account. Some parameters are influenced in the same way for OIP and RIP bushings while others are influenced differently. Understanding these influencing parameters is therefore important for each evaluation.

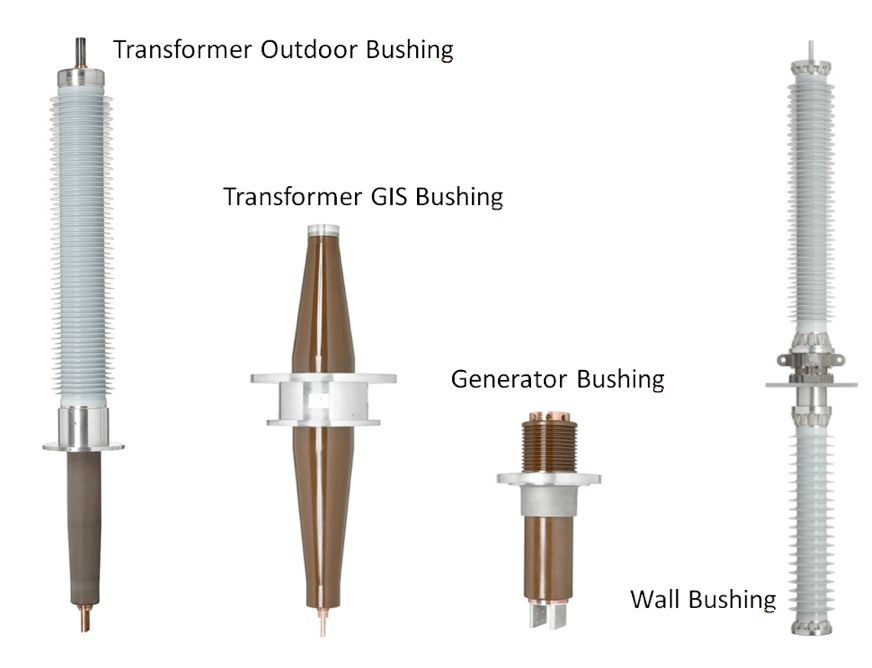
Basic Design of Bushings
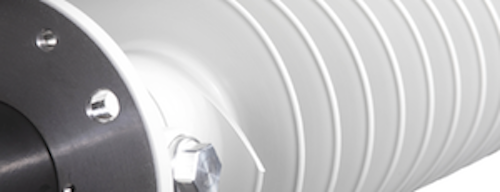
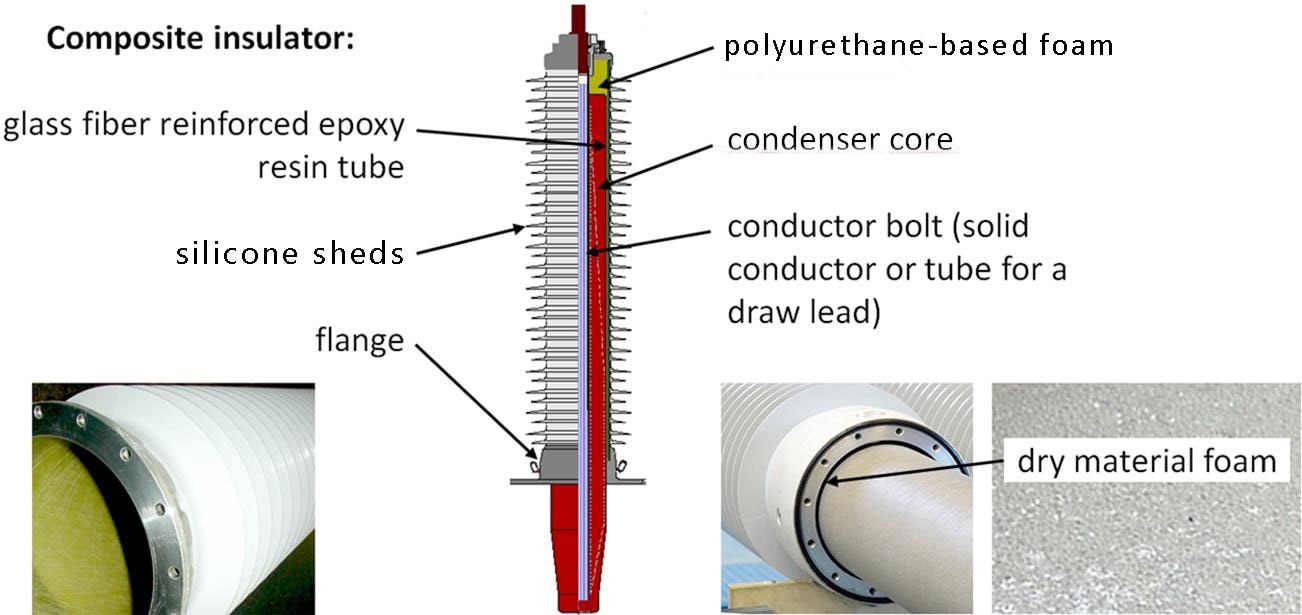
Most typically, OIP bushings are equipped with porcelain insulators while RIP bushings have a composite insulator housing. The condenser core is manufactured using paper that is wound continuously while inserting aluminum foil in precise locations to build up capacitive grading of the electric field. After winding, the core is impregnated either with epoxy resin (RIP) or oil (OIP) under vacuum and heat.
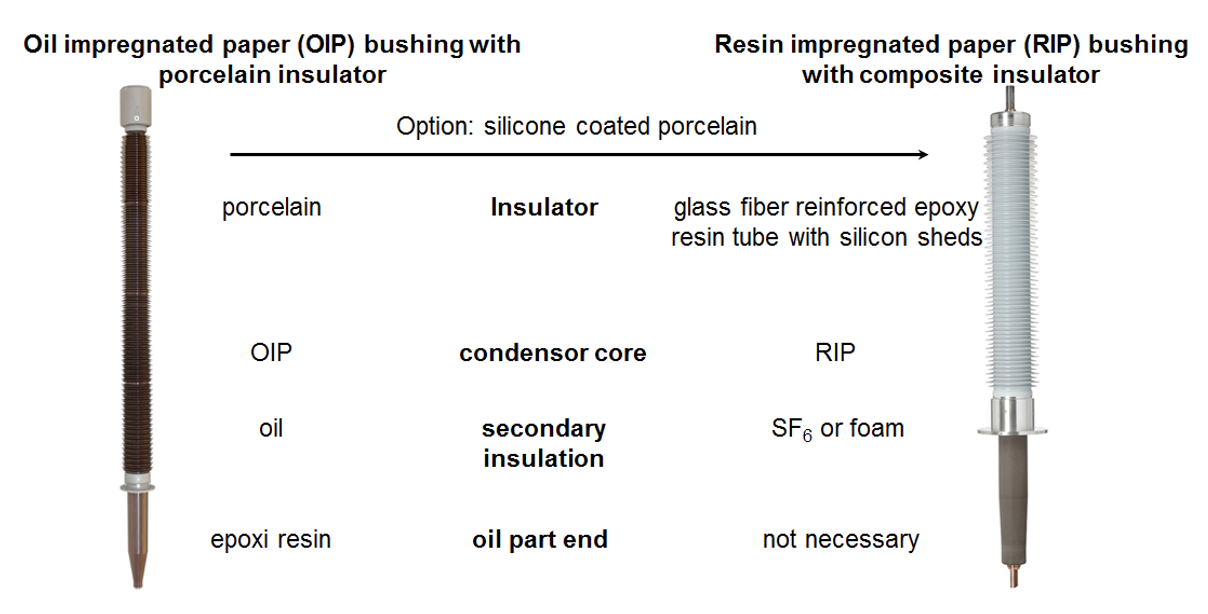
Typically the gap between the condenser core and outer composite insulator in an RIP bushing is filled with foam. Due to the hydrophobicity of silicone housing, cleaning prior to electrical measurement is usually not necessary.
Ageing
Under normal operating conditions, ageing of bushing is caused by electrical stress relative to its nominal voltage compared to any overvoltages, e.g. from lightning strike or switching operations. Accelerated ageing can then be due to unacceptably high overvoltages as well as by thermal stress and humidity ingress.
OIP insulation systems are particularly sensitive to overheating. For example, an increase of only 6K above maximum operating temperature will cause normal life expectancy to be cut in half. Moreover, humidity ingress will also have significant negative influence on service life. In fact, in the event of already greatly aged insulation, the whole system might fail subsequent to any partial breakdown. This could result in catastrophic failure should the bushing catch fire and involve the transformer as well.
Relevant Parameters to Evaluate OIP & RIP Bushings
It is well known that power factor and DGA are both adequate parameters to evaluate operational reliability of an OIP bushing. As discussed earlier, however, the relevant parameters for an RIP bushing are different, making it important to understand these and their possible influence.
A partial breakdown results in an increase in main capacitance C1, with the extent of increase dependent on number of short-circuited compared to total number of grading layers. The higher the bushing’s voltage level, the lower will be the increase in C1 in case of a single partial breakdown. Therefore, parameters influencing capacitance C1 must be taken into account during any evaluation, especially at higher voltages.
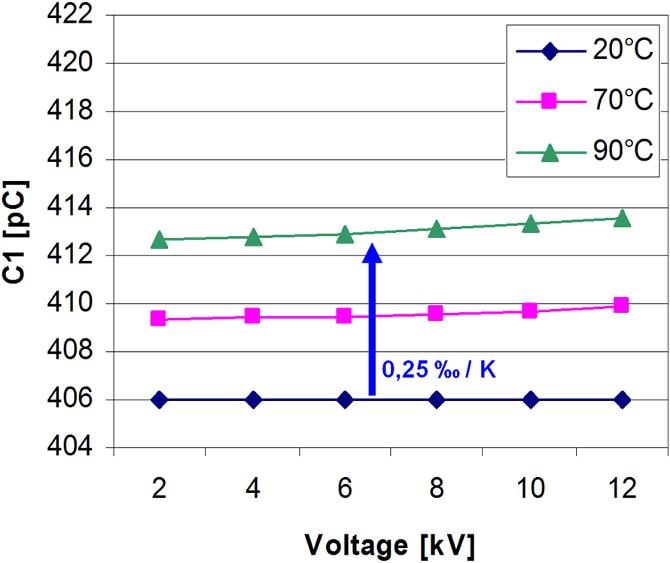
Even if the relative importance of any increase in C1 is different when evaluating OIP versus RIP bushings, the influencing parameters are the same for both technologies. The value of C1 is influenced by stray capacitance and temperature. Since stray capacitance is a geometrical parameter, keeping the set-up constant, will keep it constant as well. Therefore, a ‘fingerprint’ measurement after installing a bushing in its final position is the best reference for subsequent measurements. The temperature dependency of C1 for OIP and RIP bushings is 0.025 %/K and 0.04 %/K, respectively and this is usually only relevant in the case of very large temperature differences. For off-line measurements, the resulting deviation is mostly minor and can be neglected.
Fig. 1 shows measurements for an aged OIP bushing heated in an oven to different temperatures. A temperature dependency of 0.025%/K results in an increase of C1 of 1.75% when heating the bushing from 20°C to 90°C, i.e. from 406 pF to 413 pF. Temperature dependency for the RIP bushing is somewhat higher (0.04%/K), however can also be mostly neglected in off-line measurements.
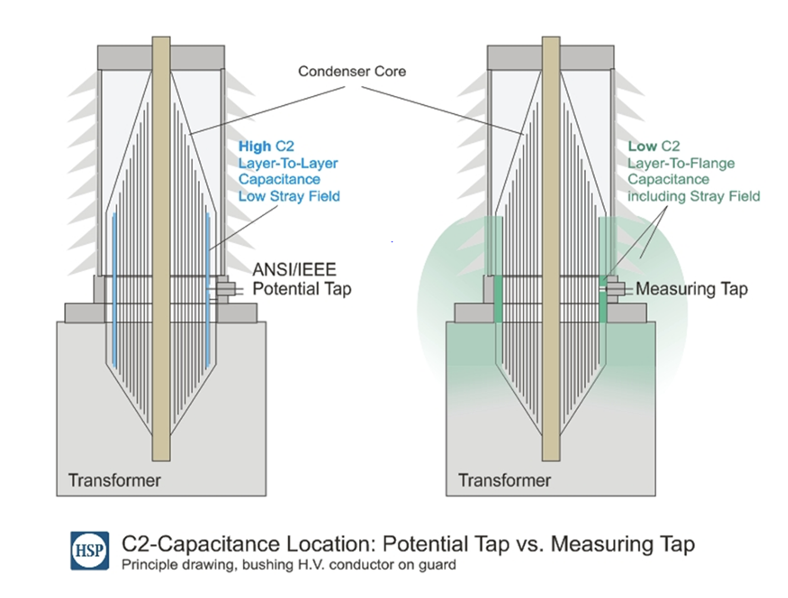
Stray capacitance on test taps has stronger influence on C2 capacitance than on C1 capacitance. This is because C2 is composed of the condenser core as well as the ‘surroundings of the bushing’, determined by the geometry of the transformer turret and other components. As a result, higher C2 deviations can be expected, i.e. up to ±50% from the routine test value. In case of a potential tap for IEEE bushings, influence of stray capacitance is significantly reduced since capacitance C2 of the potential tap is dominated by the last two grading layers. Fig. 2 illustrates the influence of stray capacitance on C2 in the case of a potential tap and a test tap, respectively.
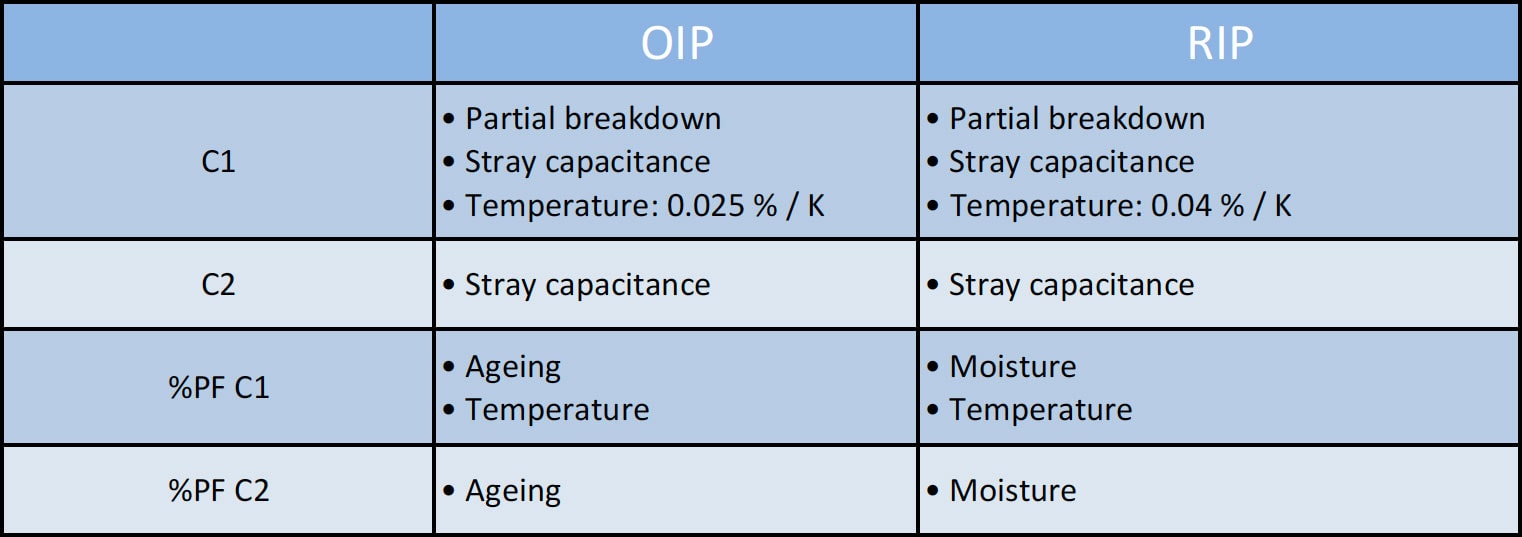
Power factor is an ageing parameter for OIP bushings and is also influenced by temperature. In the case of RIP bushings, an increase in power factor is an indication of humidity ingress but the value is temperature dependent as well. Table 1 summarizes the above relevant evaluation parameters and the factors that influence these values.
The following case histories provide an overview of typical situations that can be encountered during evaluation of RIP bushings:

Case History #1: Increase of C1→Partial Breakdown
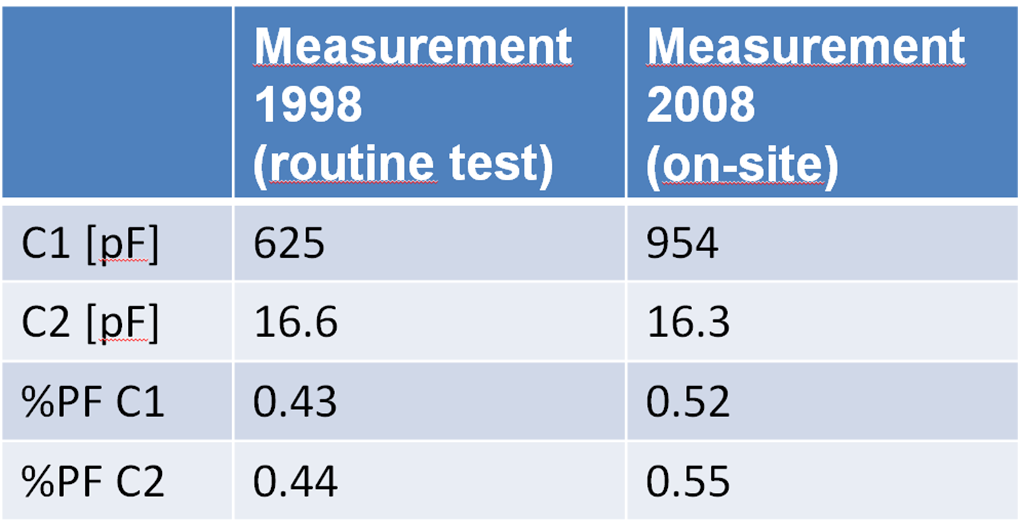
Years ago, the bushing manufacturer was informed about a measurement during a scheduled outage of an RIP bushing that indicated an increase of 53% in capacitance C1. The bushing had been in operation for 10 years and this was the first such measurement after installation. Based on the measurement, it was concluded that several partial breakdowns had taken place.
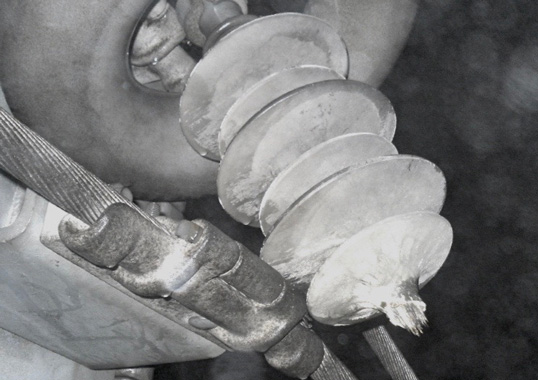
The bushing was then taken apart (once confirmation of the on-site measurement had been done using electrical measurement) and found a hole inside the condenser core. The inner surface of this hole was carbonized and therefore the grading layers involved were short-circuited. The number of short-circuited layers corresponded with the measured increase of capacitance C1. Root cause analysis indicated that a minor defect had clearly been present from the beginning. This defect caused partial discharge and resulted in erosion of the resin in the affected area. Over time, erosion increased and finally resulted in the hole.
Usually, such defects in the condenser core will be discovered during routine testing. However, in the case of a minor defect it is possible that it will not be detected since any partial breakdown is a statistical event. Later, under continuous electrical stress over a time frame of several years, partial discharge started and this failure mode began.
Case History #2: Deviation of C1→Stray Capacitance
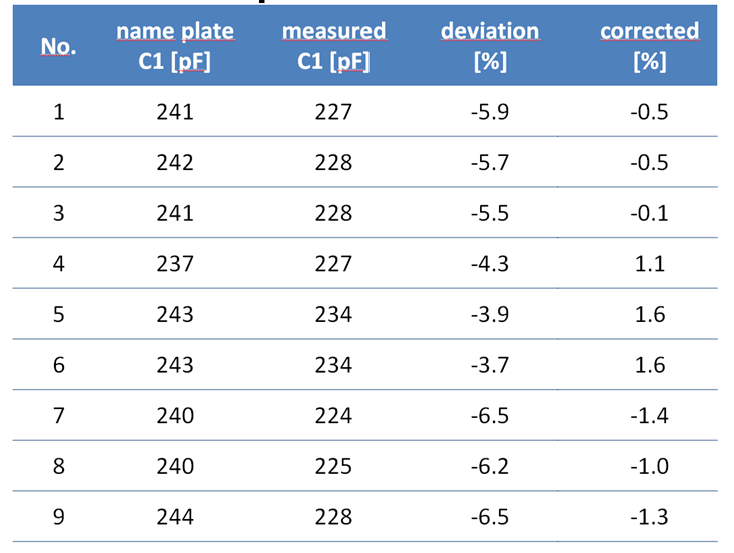
If any small deviation is identified in capacitance C1, it is helpful for the evaluation that, not only one, but several bushings are measured in the same way. Table 3 shows measurement results on 9 newly delivered transformer-GIS bushings where a deviation of approximately 5% was found.
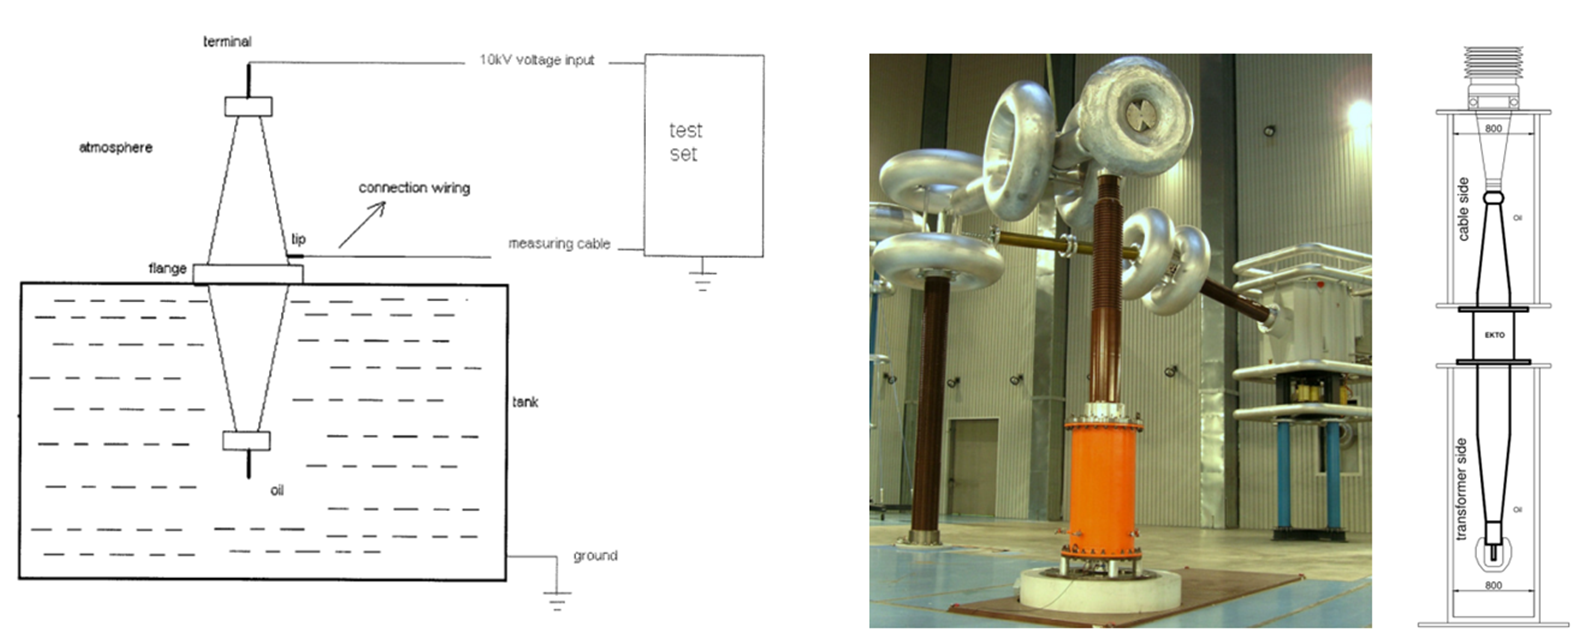
After having received these measurements from the customer, their set-up was compared with the set-up for the routine test conducted at the manufacturer. Fig. 3 illustrates the different set-ups. The customer had installed the bushings in a big oil vessel and the SF6 side remained in air since only a 10 kV measurement was being carried out. By contrast, for the routine test at the manufacturer, the bushings were installed in a smaller oil vessel. Since the bushings are being tested up to test voltage, the SF6 side has to be insulated as well and this is realized using an additional vessel filled with SF6.
Given the different set-ups, the stray capacitance is also different, although it is the same for all bushings for the routine test and the customer measurement, respectively. Thus, it results in a systematic deviation that is constant for all bushings such that, after having identified this situation, compensation can be made for this deviation. The average deviation for the 9 measurements was calculated and added to each individual measurement. The result is shown on the right in Table 3. It can be seen that the deviation is now only in a range from -1.4% to +1.6 %.

Case Example #3: Deviation of C1→Stray Capacitance
With increasing voltage level of a bushing, number of grading layers increases as well. As such, deviation of the capacitance C1 in case of a single partial breakdown decreases with increasing voltage. The evaluation becomes more difficult if this deviation is in the same range of the deviation caused by stray capacitance. The photo below shows a typical set up for a control measurement of a bushing (in this case an 800 kV wall bushing) versus the set-up for the routine test. Due to high number of grading foils, it is barely possible to detect any partial breakdown with the control measurement set-up (measurement was made to measure the % PF).
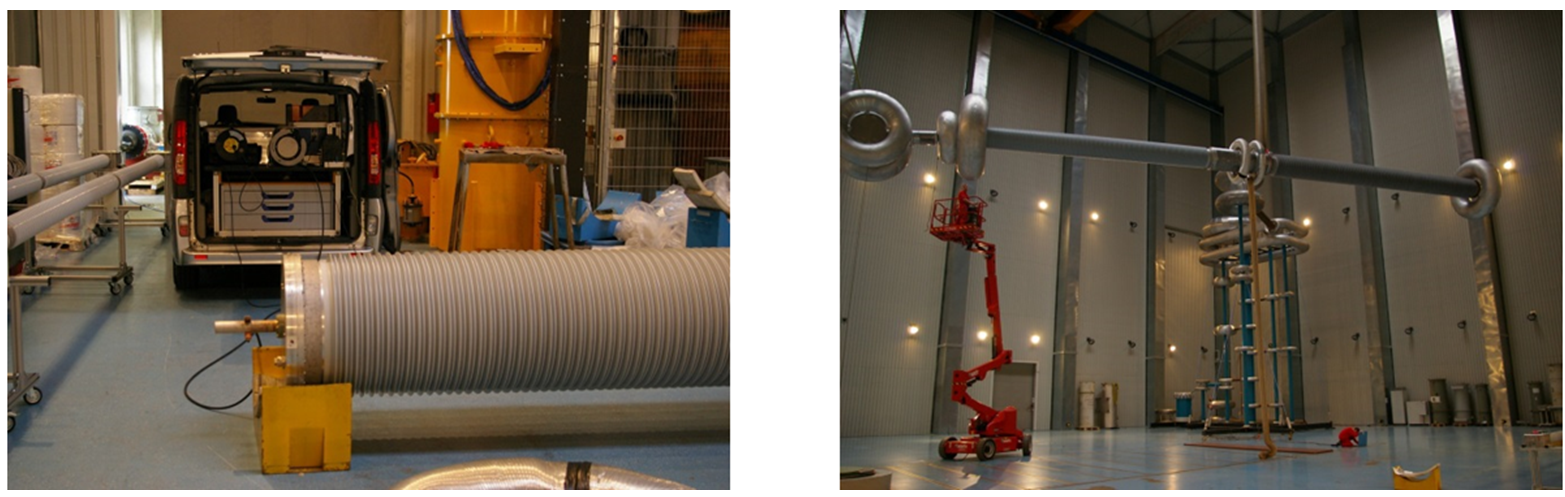
To demonstrate influence of set-up on results, measurements were carried out where in the first case the bushing was supported 1 m above ground while for the second the bushing was lifted 0.1 m using a crane. The measured C1 value changed from 756 pF to 748 pF – a deviation of 1%. Due to the high number of grading layers, such a deviation could already indicate a partial breakdown. However, in this situation it was clearly caused by different stray capacitance. With these two measurement set-ups, i.e. typical set-up for control measurement vs. set-up for routine test, deviation in measured capacitance C1 is even higher.
For any further evaluation, it is therefore necessary to have a ‘fingerprint’ measurement with the bushing mounted in its final position. This becomes more important with increasing voltage level and also with decreasing number of bushings that can be compared with one another.
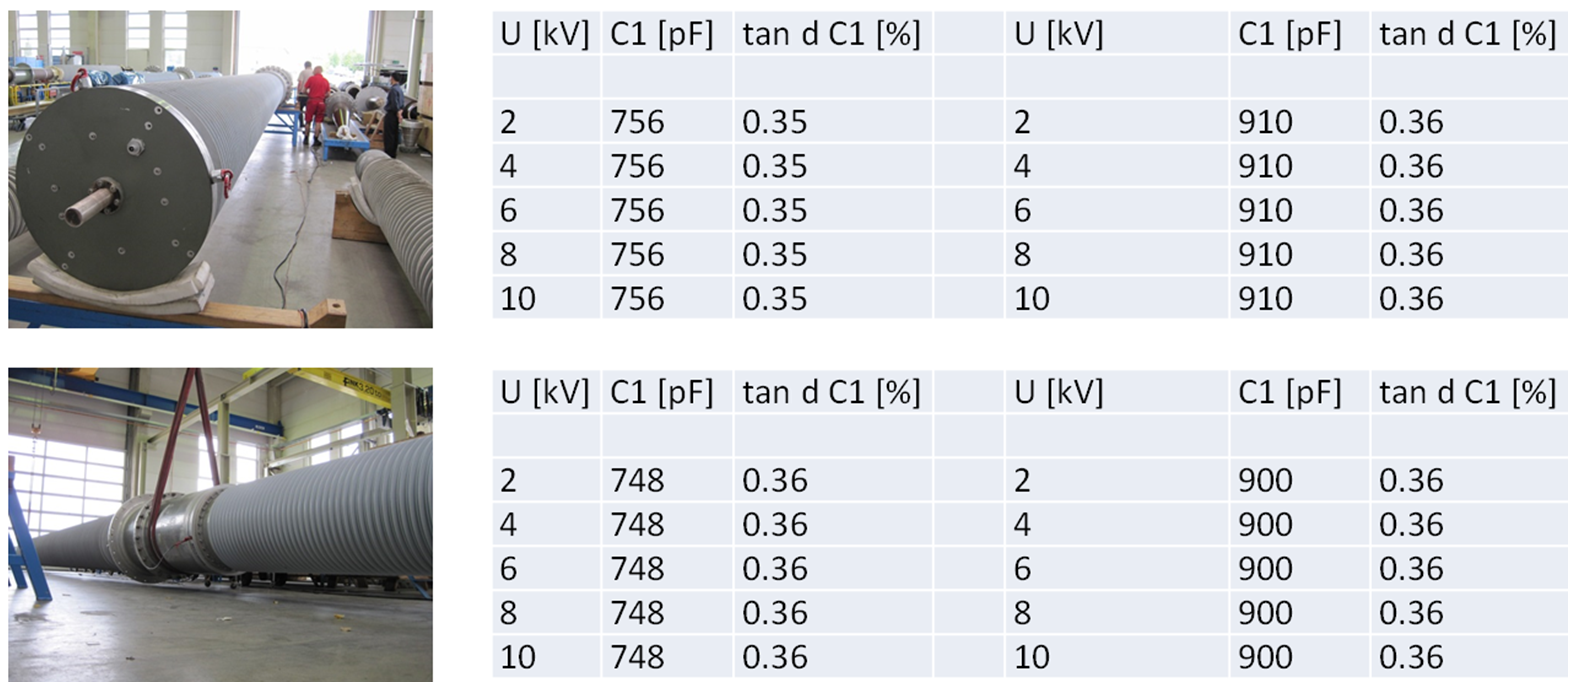
Measurement of indoor side (left) and outdoor side (right)
Case History #4: Deviation of C2→Stray Capacitance
The deviation in C2 is more strongly influenced by stray capacitance than C1 and a change to larger deviation is therefore acceptable. In the case of transformer bushings this deviation is caused mainly by the different sizes of test vessels used for the routine test compared to the transformer turret. Usually, multiple bushings are added in any new installation and therefore it becomes apparent if any deviation is caused by stray capacitance. Table 4 shows the measurement results of both capacitances, C1 and C2, for three transformer bushings after installation in the transformer. The values are compared with routine test results.
As expected, the deviation in C1 is very small, but constant. The values can be corrected to eliminate this deviation completely. The deviation of C2 is 16.8%, 27.6% and 31.2%, respectively. A correction can be made as well, but due to the large difference in the individual deviation this is not useful. Rather, it is more reasonable to define an expected range for the C2 measurement. According to manufacturer recommendation, this range is ±50%. For further measurements, the values from the ‘fingerprint’ measurement should also be used for comparison.
Case History #5: Increase of % PF of C1→Humidity Ingress
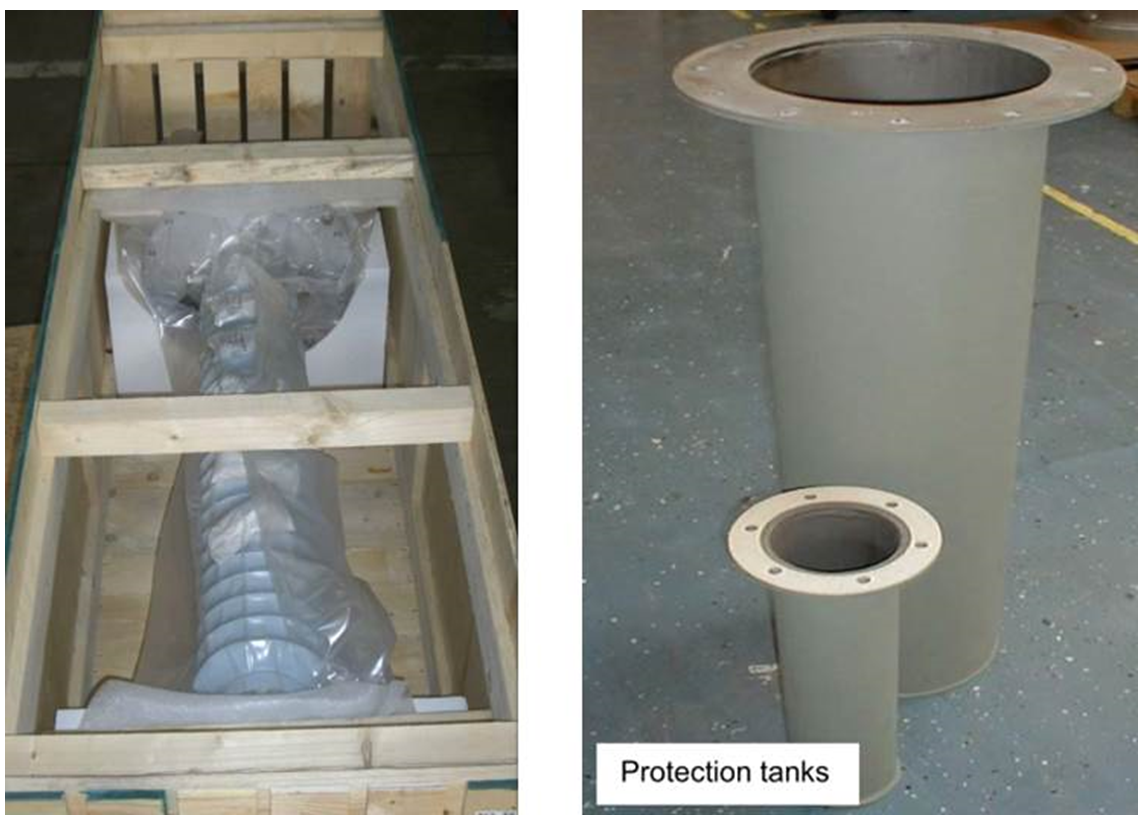
Since an RIP condenser core is solid, no additional housing is needed for the oil end or for the SF6 side. In operation these parts are protected by the oil of the transformer or the SF6 gas of the GIS. However, for transport and storage, these parts need to be protected since RIP is sensitive to humidity ingress. Normally, a storage bag for the entire bushing with drying bags inside is sufficient if the bushing will be installed on short notice. For long-term storage, a protection tank for the oil part end is the recommended solution.
If an RIP condenser core is exposed to humidity it will absorb a certain volume of moisture and this will affect the power factor. The influence of humidity depends greatly on its volume as well as the duration the bushing is exposed to it. Fig. 4 shows measurement results of several transformer bushings exposed to normal weather conditions for several weeks but with partly damaged storage bags. Comparison with results of the routine test shows a systematic deviation (increase) for all bushings, caused by different temperatures and an additional deviation for some bushings.
The bushings with additional increased power factor were then selected for a drying procedure for three days in an oven with a temperature of 70°C. After cooling, the power factor was measured again and now had decreased to a normal value. This same drying procedure could be continued for another few days if the decrease was found insufficient.
Case History #6: Increase of % PF of C1→Temperature
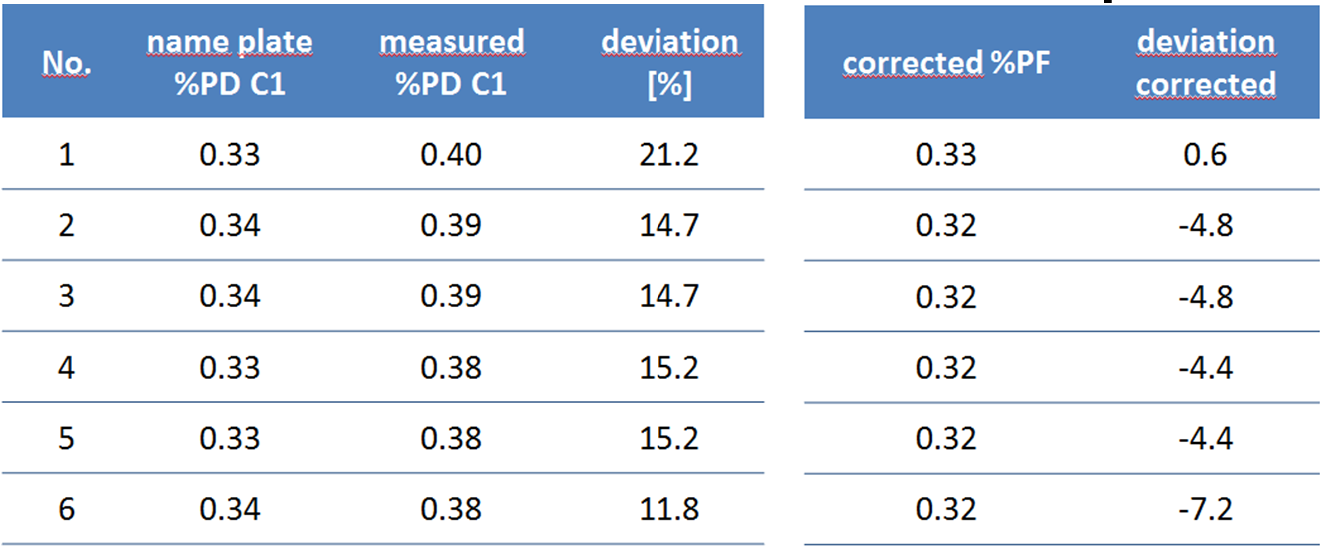
Another parameter influencing power factor is temperature. Since a deviation caused by temperature is reversible, a correction can be done by calculating the corresponding power factor at a temperature of 20°C. Table 5 shows the results of six wall bushings measured during the commissioning test on site. Since wall bushings have a complete housing for their condenser cores, any influence from humidity ingress could be excluded. Still, an increase of from 11.8% to 21.2% compared to results from the routine test was identified. The ambient temperature during the measurement in this case was 10°C – significantly lower than during the routine test which was performed at approximately 20°C.
The typical power factor of an RIP condenser as a function of temperature is shown in Fig. 5. By taking the power factor at 20°C and 10°C (e.g. the mid value) a correction factor for 10°C can be calculated. Table 5 shows the corrected power factor and also the deviation of the corrected value compared with the routine test result. The deviation is now reduced, from 7.2% to 0.6%.
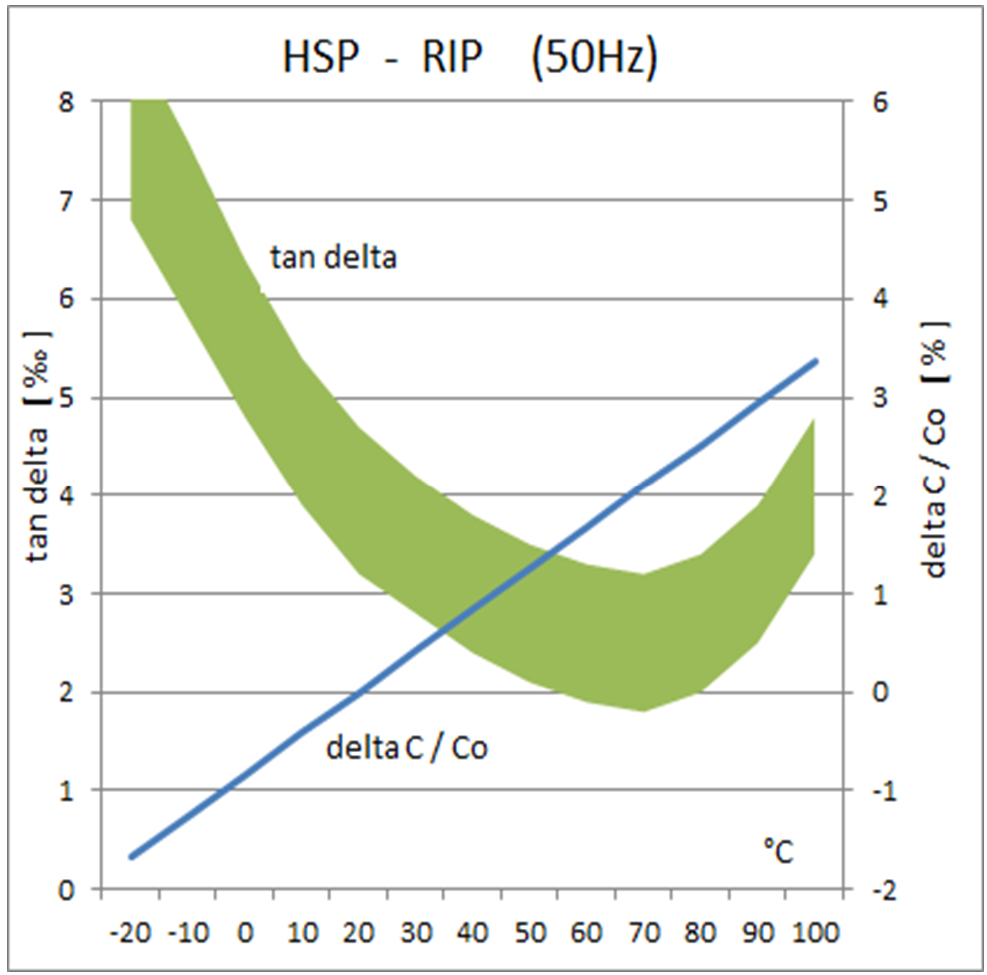
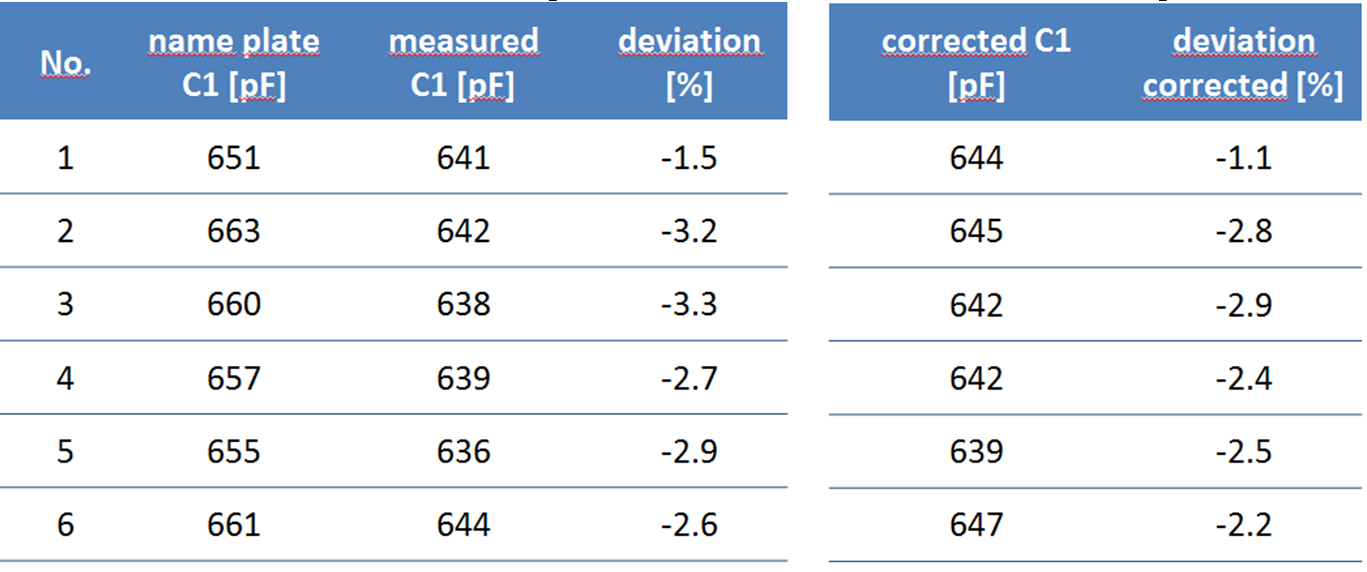
In Fig. 5, the temperature dependency of the capacitance (0.04%/K) is shown and measured values for C1 can be corrected to 20°C as well. Table 6 shows both deviations from the routine test – the measured values and the corrected values. Without correction, the deviation of C1 is from -3.3% to -1.5%. With correction, the deviation is reduced, however is still from -2.9% to -1.1%. Obviously, stray capacitances have a bigger influence on C1 than temperature and therefore any temperature correction for C1 can usually be omitted.
Case History #7: Increase of % PF of C2→Humidity Ingress
As discussed earlier, humidity ingress has an influence on power factor and both power factors might be affected, the power factor of C1 and the power factor of C2. In the case of the power factor of C2, it should be taken into consideration that this value is composed not only of the bushing itself but also e.g. the transformer oil inside the transformer turret. If humidity ingress affects mainly the part of the condenser core close to the flange, it might happen that the power factor of C2 increases significantly whereas the power factor of C1 increases only slightly.
The photo below shows the condenser core of bushings that have been returned to the manufacturer for evaluation after improper outside storage, exposed to rain. The oil part end had been covered with plastic, however the wrap was only up to the flange, without any sealing.
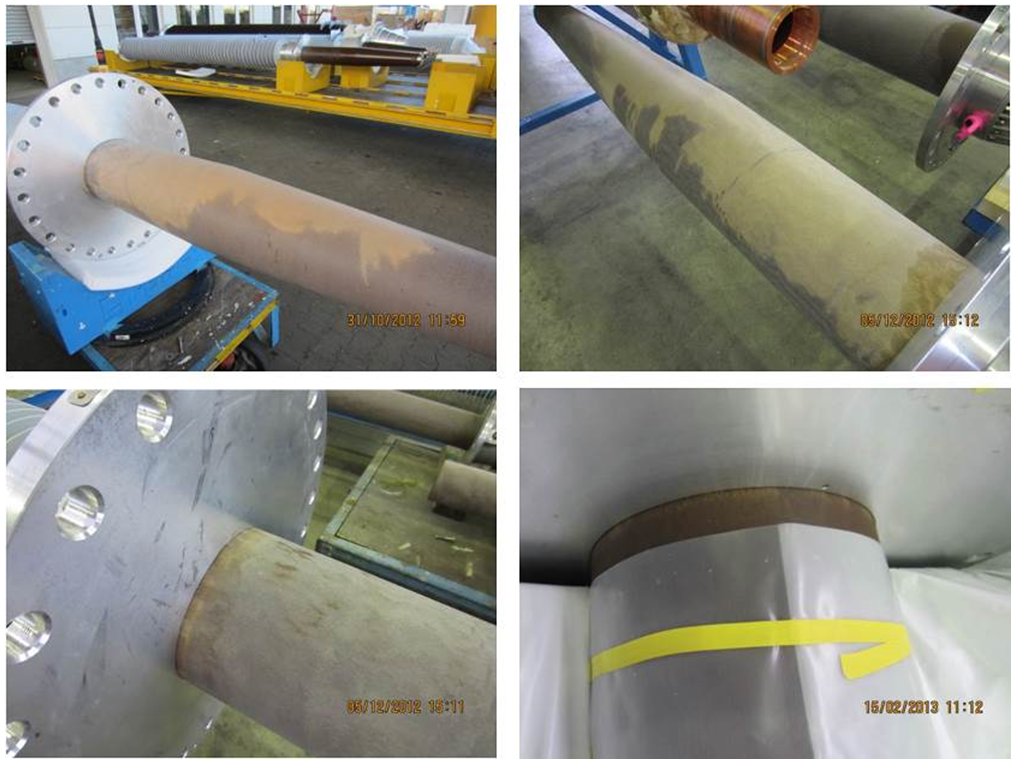
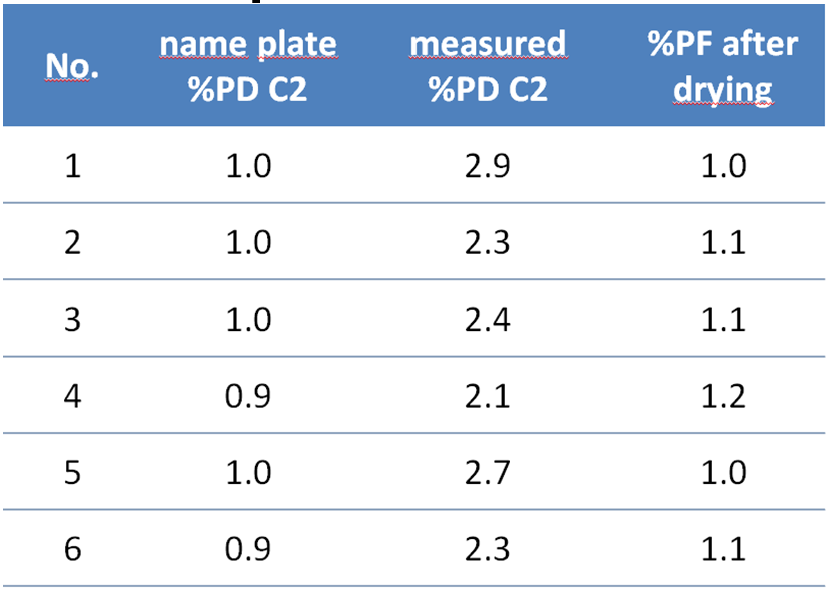
As a result, humidity was allowed to enter the condenser core close to the flange. The ground layer in this area protects the inner part of the condenser core and thus the power factor of C1 did not increase by much. But the power factor of C2 increased significantly, up to nearly three times the routine test value (see Table 6). The same drying procedure mentioned above was then carried out and the result for the power factor measurement of C2 is shown in Table 6 as well. Almost all bushings returned to the original values from the routine test.
Conclusions
The basic design of an OIP bushing and a RIP bushing is the same, but there are some specific differences resulting in different ageing parameters.
For an OIP bushing, an increase of the power factor is a well-known ageing parameter. In addition, a DGA might also give useful information about operational reliability. Any increase of the capacitance C1 indicates a partial breakdown. However, the first partial breakdown might be followed directly by a complete breakdown of the insulation, resulting in catastrophic failure. Therefore C1 is not really an adequate ageing parameter.
For an RIP bushing, any partial breakdown is limited to its specific location without interaction with the remainder of the condenser core. This is due to the fact that the condenser core is solid compared to an OIP bushing, where generated gases and contaminated oil can distribute to the whole condenser core. Also, RIP bushings do not contain any oil and therefore no ageing of oil can occur. Rather, any increase of the power factor is not caused by ageing directly but by humidity ingress that can weaken the insulation. This is usually not relevant for installed bushings but might occur under improper storage conditions before installation. With a proper drying procedure, humidity ingress into the condenser core can be removed.
For both OIP and RIP type bushings, the influence of stray capacitances should be taken into account if measured values are compared with routine test values. A ‘fingerprint’ measurement, taken after installation of the bushing in its final position, is the best reference for all further measurements.
Both, power factor and capacitance are temperature dependent. Any deviation of the power factor can be compensated for using a correction factor. For the capacitance, compensation can be made as well, however, this is usually not necessary since the difference caused by temperature is only minor.
The best evaluation can be made if several bushings rather than only one are measured. In this case, measurement results can be compared to each other as well.