Increasing market integration between countries and introduction of renewable energy sources on a larger scale has resulted in a growing demand for enhanced capacity in transmission systems. As a consequence, utilities are presently uprating or building new overhead lines (OHL) and substations. Several feasibility studies related to different uprating alternatives have been performed, including conversion of OHL from AC to DC operation. Typical approaches applied along with case studies are the topics of this edited contribution to INMR by Andreas Dernfalk, Jan Lundquist and Igor Gutman.
Uprating Alternatives, Drivers & Constraints
Before considering conversion to DC, possible AC line uprating options should ideally be evaluated with regard to efficiency and cost. For example, phase-shifting transformers or FACTS could respectively be applied to redistribute power flow between individual lines or improve transmission capability. Alternatively, capacity can be increased by introduction of dynamic thermal rating schemes that allow higher conductor operating temperature or by re-conductoring with High Temperature Low Sag (HTLS) conductors. Yet another possibility, typically resulting in a higher increase in capacity but at higher cost, is uprating to higher AC voltage. The AC uprating options described will usually be less expensive than conversion to DC per additional MW of power capacity. However, AC uprating seldom achieves the same capacity increase as conversion to DC or offers the system benefits of DC transmission. DC is generally considered the most efficient way to gain major increases in power transfer capability because:
• DC lines can be operated at their thermal limits without stability constraints;
• DC corona effects are less pronounced, especially under wet conditions, which may allow comparatively high operating DC voltage levels;
• Line insulation is more effectively utilized by constant DC voltage.
Growing utility interest in the concept can also be explained by two additional factors:
• Increasing lead times and difficulty in obtaining right-of-ways for new transmission lines due to public resistance;
• Development of voltage source converters (VSC) for HVDC, making introduction of DC more attractive since VSCs can also support the AC system.
The major constraints for AC to DC line conversion are:
• High costs of converter stations;
• Enhanced requirements on insulators under DC voltage in polluted areas.
[inline_ad_1]
Corona & Field Effects
Corona and field effects of DC transmission lines include audible noise (AN) level, radio interference (RI), corona loss (CL) and electric field and ion current density in the vicinity of the line. These effects depend on configuration and positioning of conductors as well as on DC voltage level and are significantly different from AC lines. for example, corona activity increases in rain but, due to formation of space charges, AN and RI levels are reduced and increase in corona loss is limited compared to AC. Based on research of subjective evaluation of DC corona audible noise, it is recommended that a 40 dBA limit be applied for the L50 AN level at the edge of the right-of-way of DC lines in fair weather. There exist empirical formulas to calculate AN L50 level of DC lines in fair weather. RI limit of a DC line should be evaluated on the basis of signal to noise ratio (e.g. 20 dB) in order not to influence broadcast reception, same as for AC lines. There are also empirical formulas for direct calculation of the RI L50 level of DC lines in fair weather. DC corona loss is larger in rain than in fair weather but this increase is far less than for AC lines. Fair weather CL should be confirmed when evaluating the feasibility of AC to DC conversion, although its magnitude relative to conductor ohmic losses is usually small. Again, empirical formulas allow calculating CL in both foul and fair weather.
The electric fields of DC lines are different from AC electric fields when it comes to effect on the public. The static electric fields produced by DC lines do not produce significant electric fields or currents inside the body that could cause biological effects. The remaining effects of DC electric fields are the ions produced by corona and their charging effects on hair and skin, and annoying possible microshocks when someone touches charged or grounded metallic objects under a line. Limiting field intensity as well as ion current density at ground level is recommended since perception of electric field depends on combination of the two. In order to avoid adverse effects from electric fields and ions, some utilities apply electric field limits of 25 to 40 kV/m under a line, sometimes combined with a limit on ion current density of 100 nA/m². It should be noted that DC electric fields and ion currents at ground level depend on conductor sag as well as climatic conditions such as wind. Therefore, the probability of exceeding certain levels must be considered for any limits imposed. Ground-level electric field and ion current density under DC transmission lines depend primarily on operating voltage, configuration of the conductor bundle and minimum height of the conductors (i.e. conductor sag). Any restriction on DC voltage from the viewpoint of electric field effects can be estimated using existing methods.
[inline_ad_2]
DC Insulator Dimensioning
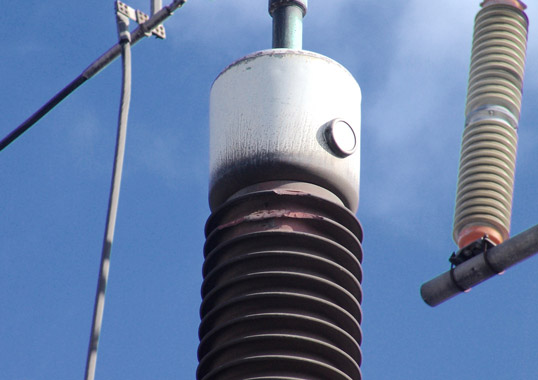
Existing AC glass or porcelain cap & pin insulators cannot be used for long-term DC service due to issues of corrosion and ion migration. When replaced by composite or special DC glass insulators, it is important to emphasize that sensitivity to pollution is more pronounced under DC compared to AC. A statistical method for insulator dimensioning is therefore typically applied to make optimal use of the available space for the new DC insulators.
Required Insulator Length
The process entails selection of the dielectric strength of an insulator with respect to voltage and environmental stresses (stress/strength concept) so as to fulfil a specific availability requirement. This is done by evaluating risk for flashover of potential insulation options and selecting those yielding acceptable performance. In this context, insulator performance is typically quantified in terms of the parameter, Mean Time Between Flashover (MTBF).
![Stress concept for calculating the risk of pollution flashover (from [10]).](https://www.inmr.com/wp-content/uploads/2016/02/Screen-Shot-2016-02-17-at-2.18.59-PM.png)
CLICK TO ENLARGE
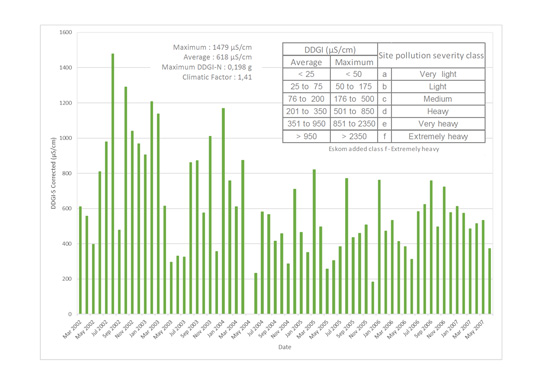
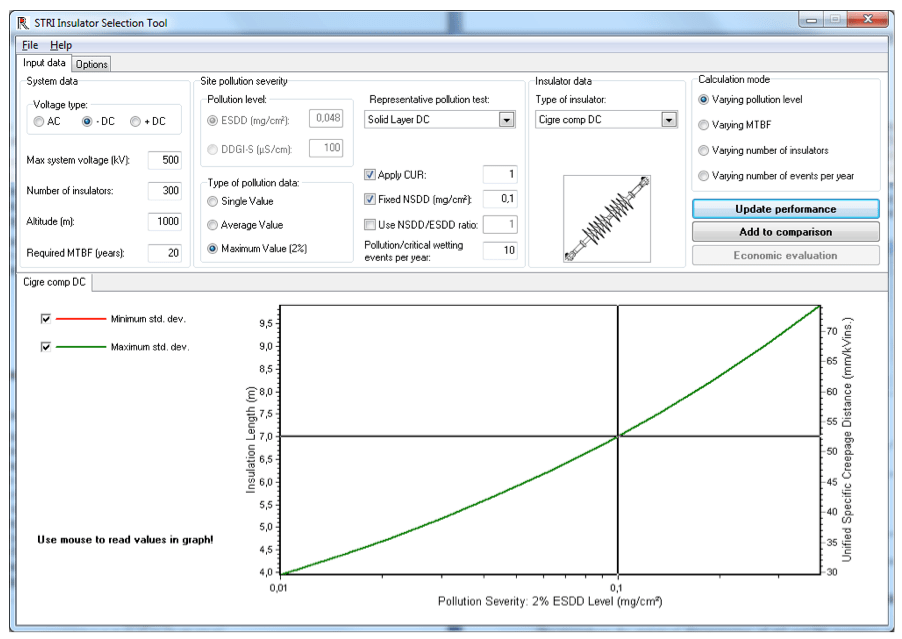
Practically speaking, statistical dimensioning of insulators with respect to pollution can be performed using existing dedicated software, e.g. STRI’s Insulator Selection Tool (IST). This program allows a user to calculate e.g. required insulator length to obtain a given MTBF as a function of pollution level (see Fig. 2). Site severity distributions are normally characterized by 2%-values of ESDD/NSDD distributions while insulator flashover strength of any specific type of insulator is derived from laboratory test results. The calculations take into account number of parallel insulators and number of pollution events. Whereas procedures for statistical dimensioning of AC and DC insulators are identical, inputs are different since there is a difference in ‘pollution catch’ between insulators energized by AC and DC voltage due to electrostatic charging. This effect can have large impact on Site Pollution Severity (SPS), especially in areas with low wind. For coastal areas, where pollution accumulates rather quickly and pollution is deposited by strong winds, influence of electrostatic charging is lower. For example, if existing AC insulators are to be replaced by composite longrod or composite post insulators, their pollution performance can be represented by a generic performance curve, corresponding to the median of several different composite insulators. Due to the fact that hydrophobic properties of the composite insulator surface are intentionally suppressed during testing, results present a ‘worst case’ scenario. Nevertheless, it should be kept in mind that the pollution performance curve does not represent a specific or typical insulator profile. As such, it is highly recommended that pollution performance of the DC insulators selected be verified by representative laboratory tests for the specific service conditions before any final decision.
CLICK TO ENLARGE
Required Clearance to Ground
Maximum attainable power transfer capacity of a converted OHL is given by maximum DC voltage and maximum conductor current. Maximum voltage in turn is limited by corona and field effects as well as by required insulator length with regard to pollution performance. Maximum current on the other hand is limited by maximum allowable conductor temperature or maximum conductor sag with respect to required conductor clearance to ground. Required conductor clearance to ground is further determined by insulator arcing distance. Consequently, required insulator length and required clearance to ground are interrelated via DC voltage level.
[inline_ad_3]
Maximum Power Capacity
Maximum power capacity is determined by recommended limits for corona and field effects and also by requirements on insulator length and clearance to ground. Due to the coupling between required insulator length and required clearance to ground, maximum power capacity is found by applying a set of selected DC voltage levels in a step-by-step procedure, comprising:
• Calculation of required insulation length based on pollution performance requirements;
• Determination of required clearance to ground based on insulator arcing distance;
• Determination of maximum conductor temperature, as limited by the allowable conductor sag or other restrictions;
• Calculation of maximum power capacity for DC voltage selected.
[inline_ad_4]
Case Studies
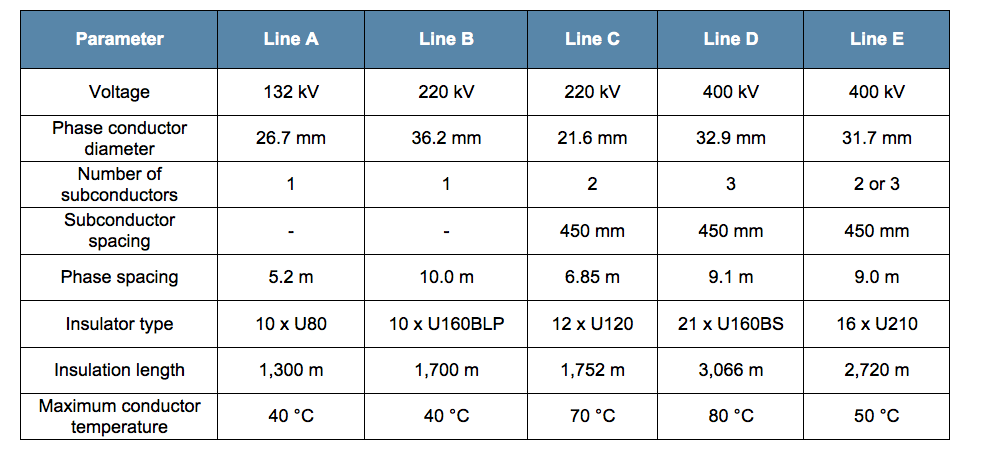
The procedure and results of typical feasibility studies using the principles described above and aimed at determining maximum attainable thermal capacity are illustrated by several case histories involving OHLs from 132 kV to 400 kV.
CLICK TO ENLARGE
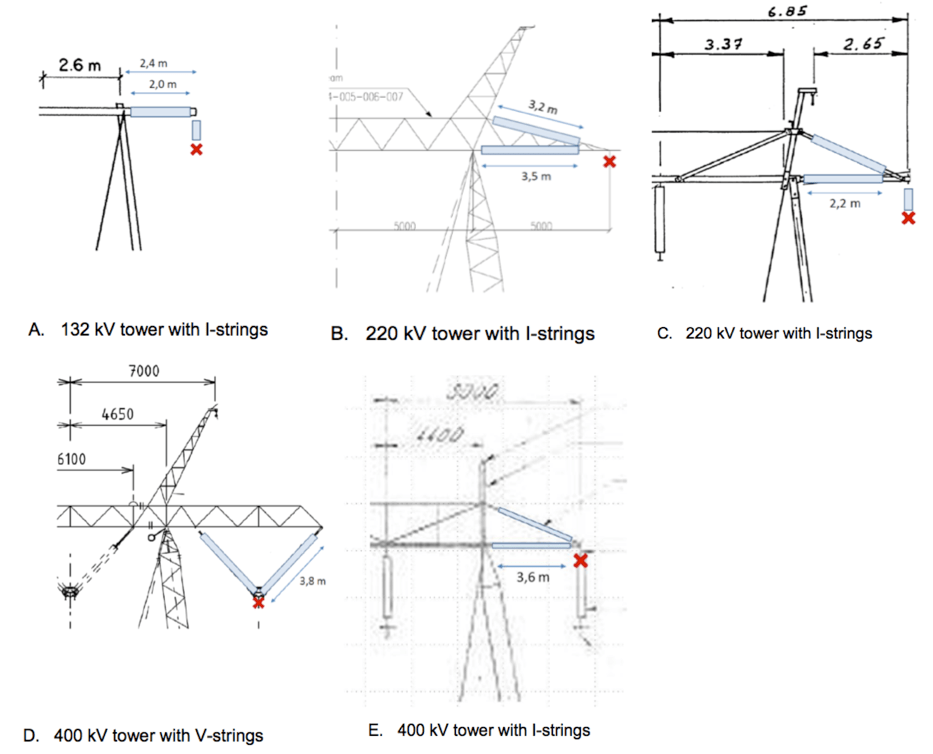
The five tower types considered all had horizontal phase configurations. Moreover, all but one (i.e. Line D) was fitted with vertical insulators, i.e. I-strings. Main tower head dimensions and proposed modification of insulator configurations after conversion are shown schematically in Fig. 3. The lines are assumed to be converted to bipolar DC line with the centre phase serving as neutral conductor.
CLICK TO ENLARGE
Required Insulator Length
A number of different approaches exist to evaluate DC pollution severity. For these case studies, there was no existing information on service experience of DC lines or substations located in the same area or in a similar environment. Nor were there any results available on pollution severity measurements on DC energized insulators. DC pollution severity was therefore estimated instead from the perspective of pollution performance of insulators energized by AC voltage. Practically, design ESDD levels of the existing AC lines were initially estimated through statistical evaluation using the IST with the following assumptions:
• Maximum system voltage;
• Insulator length;
• Number of suspension insulators (estimated from total line length and typical span length);
• Number of pollution events per year (estimated from weather data);
• Mean time between flashover (estimated from service records);
• Pollution performance of existing insulators equal to standard reference glass insulator (creepage 305 mm, height 146 mm);
• NSDD equals 0.1 mg/cm2 (i.e. a conservative value for the environments under consideration);
• Uniform pollution deposit on top/bottom side of insulators.
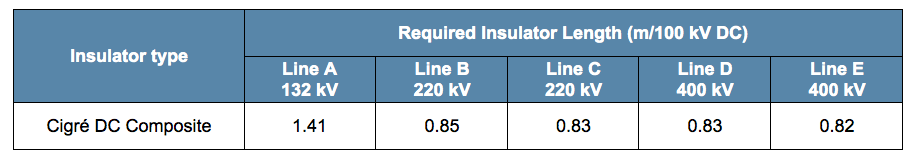
After comparison with available design data, the AC ESDD levels selected were converted to DC ESDD. Finally, repeated statistical calculations using pollution performance of the selected DC insulator type (i.e. a Cigré DC composite), derived DC ESDD level and MTBF, provided for a corresponding DC insulator length per 100 kV.
CLICK TO ENLARGE
Corona & Field Effects
AN and RI calculations were carried out using formulas that calculate the fair weather L50 levels of AN (dBA) and RI (dB at 0.5 MHz). Maximum electric field and ion current densities were calculated using the AnyPole Program that provides approximate L10 level (exceeded 10% of the time) in fair weather during no-wind conditions when using default values for corona onset gradients, i.e., 14 and 13 kV/cm for positive and negative conductors, respectively.
Maximum Power Transfer Capacity
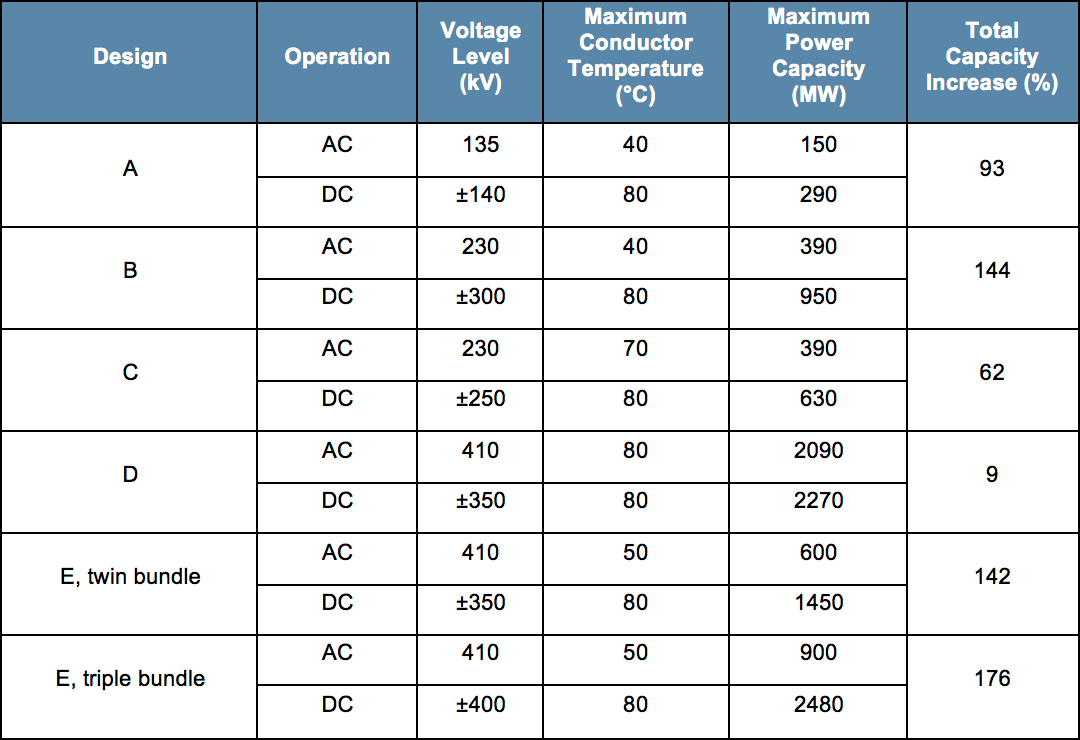
Maximum power capacities of the lines were calculated according to the procedure described above and presented in Table 3. Maximum conductor temperature, after conversion, was in all cases set to 80°C. For each line design, thermal capacity of the existing AC line was also calculated using assumed operating AC voltage, presently allowed maximum conductor temperature and the power factor cos =0.9. Comparisons of maximum power capacity before and after conversion showed that potential gain varied significantly, i.e. from an only 9% increase for line D (already operating at 80°C) to 176% for line E equipped with a triple conductor bundle. It should be noted that design finally selected for conversion is influenced by a set of different boundary conditions. In these different case examples, the voltage giving highest thermal power capacity has been considered as the optimal solution. If maximum conductor temperature is limited to a lower value, e.g. to reduce power losses, maximum power capacity will be different. It should also be noted that the originally proposed utilization of I-strings in combination with post insulators for lines A and C was found not to be required. For line A, associated height reduction would impact temperature rating leading to lower capacity. For line C, DC voltage was limited by electric field strength.
CLICK TO ENLARGE
Cost of Insulator Modification
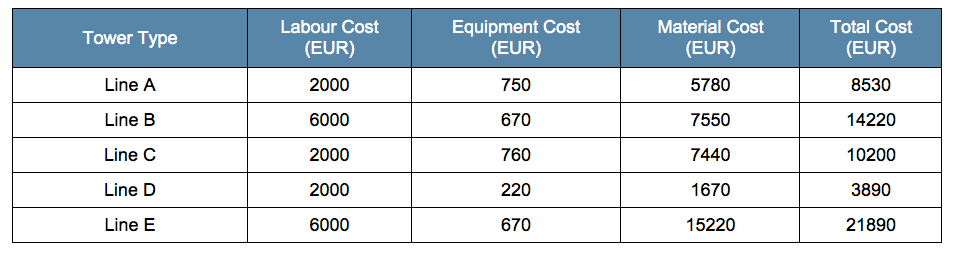
Evaluation of line conversion options show that application of composite line insulators in existing or new insulator configurations is necessary to achieve substantial increase in power capacity through conversion to DC. Costs for the various insulator options proposed in Fig. 3 were therefore estimated to allow comparison with other uprating alternatives. Estimated costs per tower when modifying 1000 towers per line are summarized in Table 4. Costs are divided into labour, equipment and materials, assuming conventional work methods. Possible added costs to strengthen tower bodies or foundations due to changing mechanical loads are not included. Similarly, costs for alternative work methods, e.g., live line work, were not considered.
CLICK TO ENLARGE
Summary
Typical approaches for AC/DC conversion projects have been presented followed by specific case studies for 132 kV to 400 kV AC overhead lines. Results indicate that potential gain in thermal power capacity can vary significantly between different line designs. Design finally selected for conversion is influenced by a set of boundary conditions including: original OHL design and allowed degree of alteration, pollution level and associated performance requirements, thermal rating, losses, cost of conversion, etc. Consequently, feasibility of potential conversion projects must ideally always be studied on a case-by-case basis.